Upwards movement has continued as the main Elliott wave count expected.
Summary: A bounce or a sideways consolidation has begun within the larger downwards trend. With On Balance Volume at resistance, price at resistance, and weak volume for Friday, look out for a downwards reaction on Monday.
This correction for intermediate wave (B) may be a choppy sideways movement. It may not present a good trading opportunity. More experienced members may like to use a range bound trading approach at this time for short term scalps. Less experienced members should stand aside and wait patiently for it to end before re-entering the trend.
Always use a stop on every trade. Do not invest more than 1-3% of equity at this time on any one trade.
New updates to this analysis are in bold.
Last monthly charts and alternate weekly charts are here, video is here.
Grand SuperCycle analysis is here.
WEEKLY CHART I
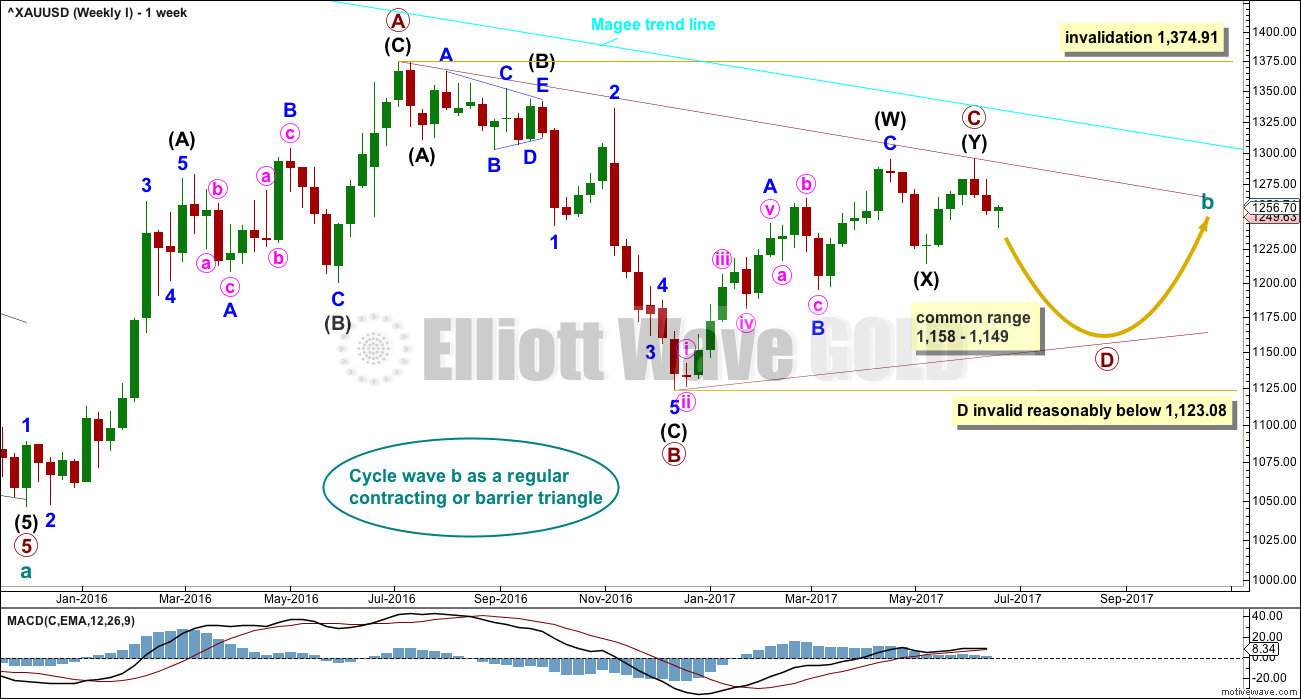
The Magee bear market trend line is added to the weekly charts. This cyan line is drawn from the all time high for Gold on the 6th of September, 2011, to the first major swing high within the following bear market on the 5th of October, 2012. This line should provide strong resistance.
At this stage, a triangle still looks most likely and has the best fit for cycle wave b.
Within a triangle, one sub-wave should be a more complicated multiple, which may be primary wave C. Primary wave C may not move beyond the end of primary wave A above 1,374.91. This invalidation point is black and white.
At this stage, it looks like primary wave C is now complete at the hourly and daily chart level. However, at the weekly chart level, it looks possible it may continue higher. This possibility must be acknowledged while price remains above 1,214.81. Within intermediate wave (Y), minor wave B may not move beyond the start of minor wave A.
Primary wave D of a contracting triangle may not move beyond the end of primary wave B below 1,123.08. Contracting triangles are the most common variety.
Primary wave D of a barrier triangle should end about the same level as primary wave B at 1,123.08, so that the B-D trend line remains essentially flat. This involves some subjectivity; price may move slightly below 1,123.08 and the triangle wave count may remain valid. This is the only Elliott wave rule which is not black and white.
Primary wave C may end when price comes up to touch the Magee trend line.
There are three alternate wave counts that have been published in the last historic analysis, which is linked to above. They are all very bullish. Members may like to review them at this stage. They will only be published on a daily basis if price shows them to be true with a new high now above 1,295.65.
DAILY CHART
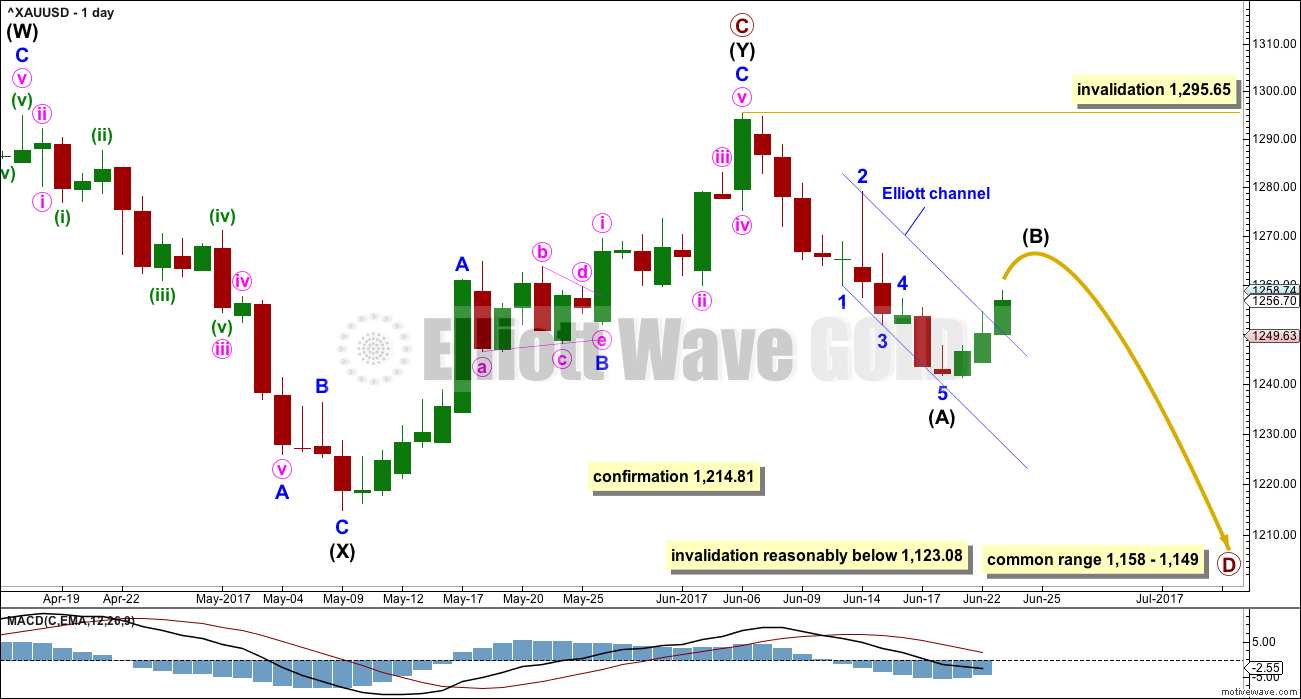
Intermediate wave (Y) may now be a complete zigzag if it is accepted that a triangle completed in the position labelled minor wave B. This has a perfect fit on the hourly chart.
A new low below 1,214.81 could not be minor wave B within intermediate wave (Y) and would provide strong confirmation that intermediate wave (Y) is over.
A common range for triangle sub-waves is from about 0.8 to 0.85 the prior sub-wave, this gives a range for primary wave D from 1,158 to 1,149.
If primary wave C is correctly labelled as a double zigzag, then primary wave D must be a simple A-B-C structure and would most likely be a zigzag. Within primary wave D, minor wave B may not move beyond the start of minor wave A above 1,295.64.
With a clear breach of the Elliott channel today at the hourly chart level, and a strong overshoot at the daily chart level, it looks very much like intermediate wave (A) is over. If intermediate wave (A) is over, then it would have lasted 10 days (not a Fibonacci number). For the wave count to have the right look intermediate wave (B) may be at least even in duration with intermediate wave (A).
Intermediate wave (B) may be any one of more than 23 possible corrective structures. It may be a swift sharp zigzag with a strong upwards slope, or it may be a shallow sideways complicated combination, triangle or flat. It is impossible until it is almost complete to know with confidence what structure it has taken. B waves exhibit the greatest variety in price behaviour and structure, so they do not present good trading opportunities.
Only the most experienced of traders should attempt to trade B waves, even at intermediate degree. If members choose to attempt to trade intermediate wave (B) upwards, it is my strong advice to reduce risk to only 1-3% of equity. It is essential that stops are always used.
Primary wave A lasted 31 weeks, primary wave B lasted 23 weeks, and primary wave C may have been complete in 25 weeks.
Primary wave D should be expected to last at least 8 weeks (but most likely longer). The next Fibonacci ratio in the sequence would be a Fibonacci 13 and then 21.
HOURLY CHART
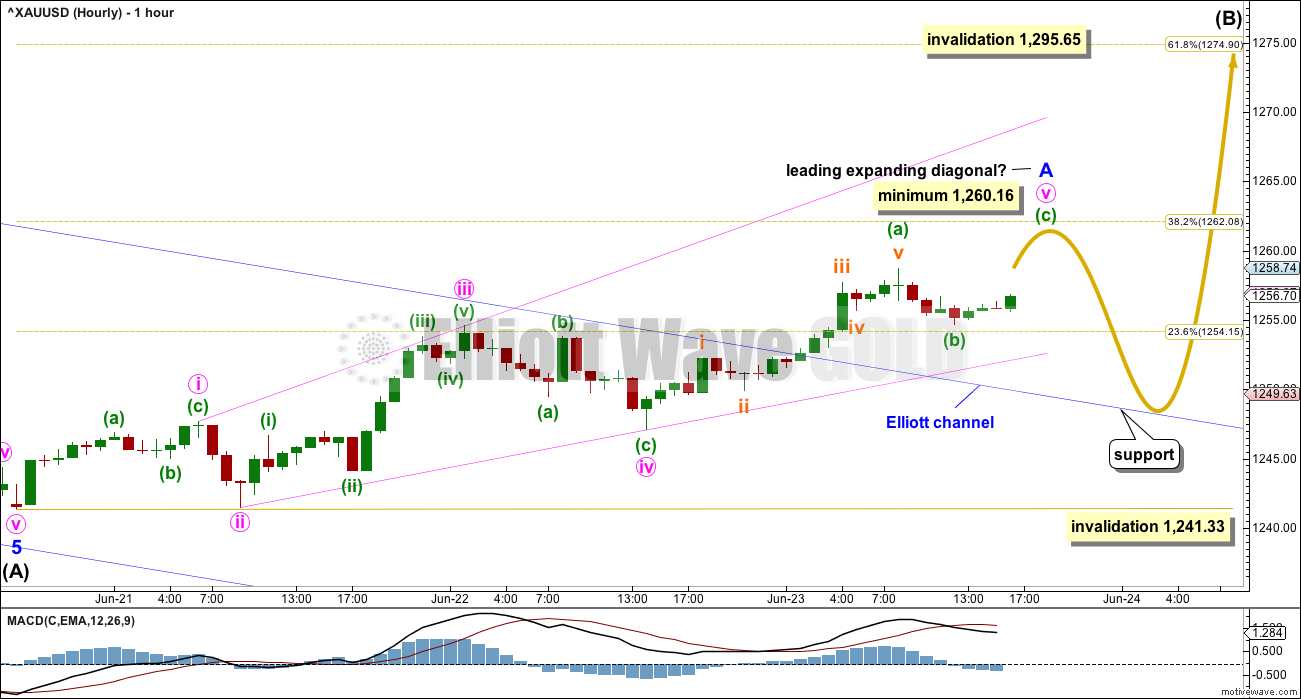
The strong breach of the Elliott channel at the hourly chart level is a strong indication of a trend change.
If intermediate wave (A) is complete, then a new wave up at intermediate degree should start with a five wave structure upwards on the hourly chart. This is incomplete. It may be unfolding as a leading expanding diagonal.
Because the diagonal is expanding, minute wave v must be longer than minute wave iii. At 1,260.16 minute wave v would reach equality in length with minute wave iii; minute wave v must end above this point.
When minor wave A is complete, if it is a five, then minor wave B may not move beyond its start below 1,241.33.
The first five up may also be moved down one degree; this may be only minute wave i of minor wave A. If it is minute wave i, then minute wave ii may not move beyond its start below 1,241.33.
ALTERNATE HOURLY CHART
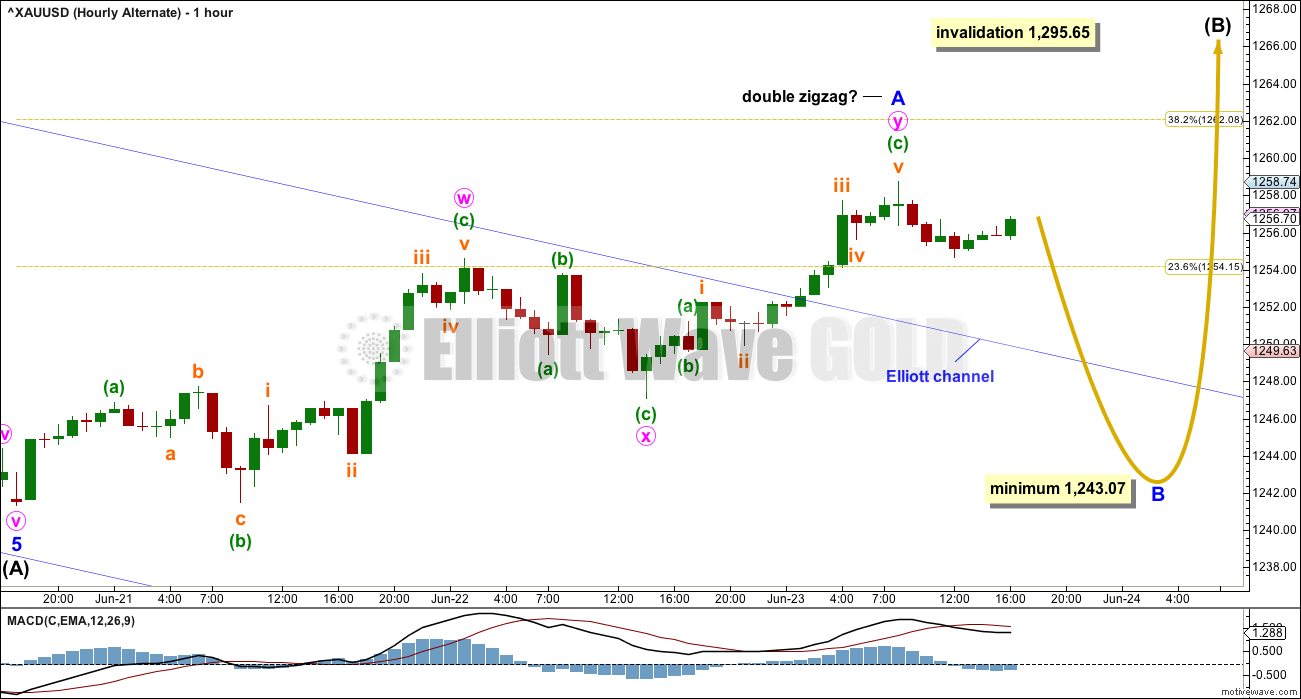
Because intermediate wave (B) may be any one of more than 23 possible structures, it is necessary to consider alternate wave counts as it unfolds.
Minor wave A may be a complete double zigzag. When A waves subdivide as threes, then the larger correction is either a flat or triangle. Within flats and triangles, B waves may make new price extremes beyond the start of A waves as in expanded flats and running triangles. Minor wave B may make a new low below 1,241.33.
The minimum requirement of 0.9 the length of minor wave A at 1,243.07 is for a flat correction.
If intermediate wave B is unfolding as a triangle, there is no minimum requirement for minor wave B.
TECHNICAL ANALYSIS
WEEKLY CHART
Click chart to enlarge. Chart courtesy of StockCharts.com.
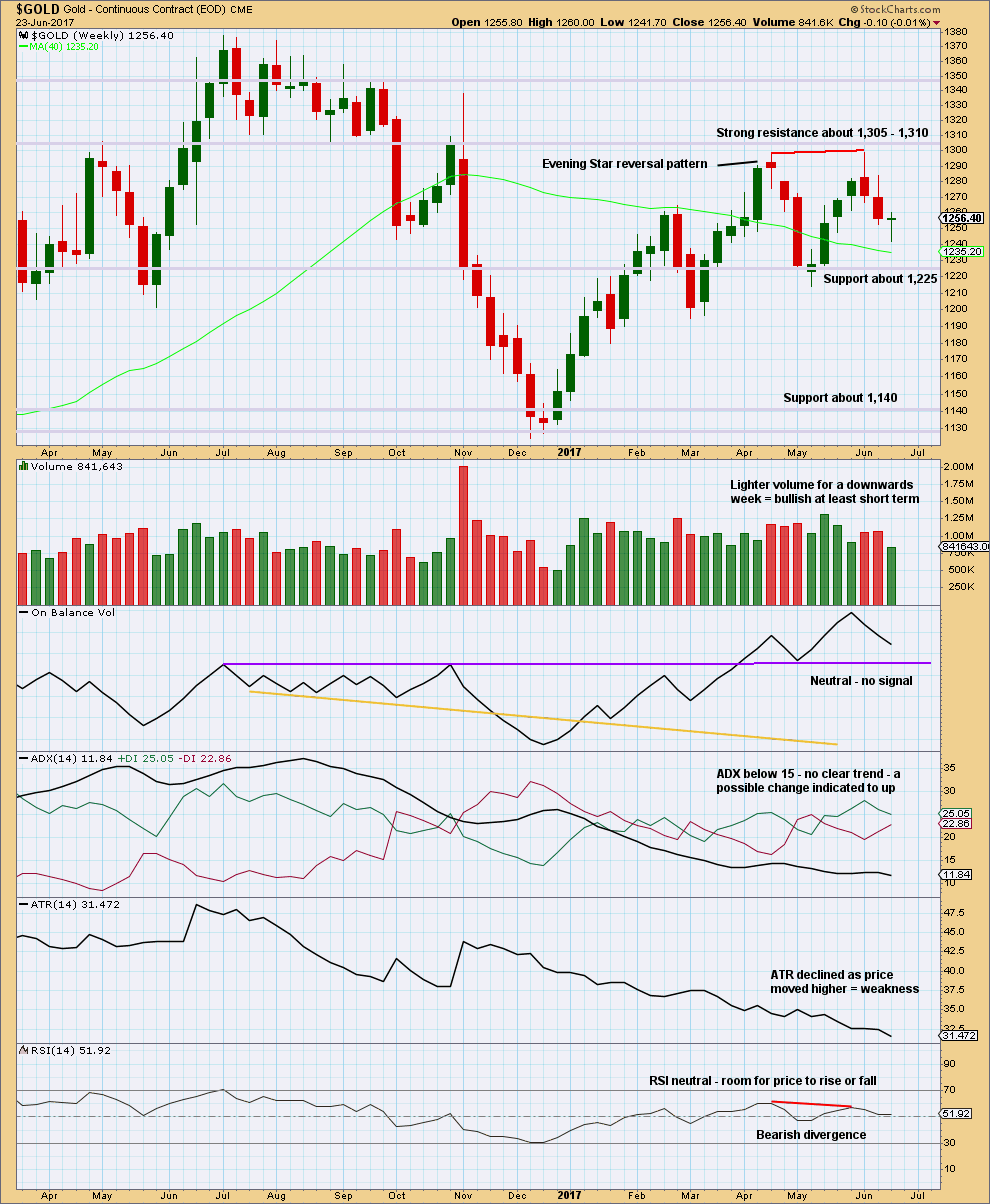
The long lower wick of the last weekly candlestick is bullish. This puts the short term trend from down to neutral.
Lighter volume for the last week does not support the fall in price. In conjunction with the longer lower wick and doji candlestick, a bounce here looks like a very real possibility.
Declining ATR for a long time fits neatly with the expectation of a large triangle unfolding.
DAILY CHART
Click chart to enlarge. Chart courtesy of StockCharts.com.
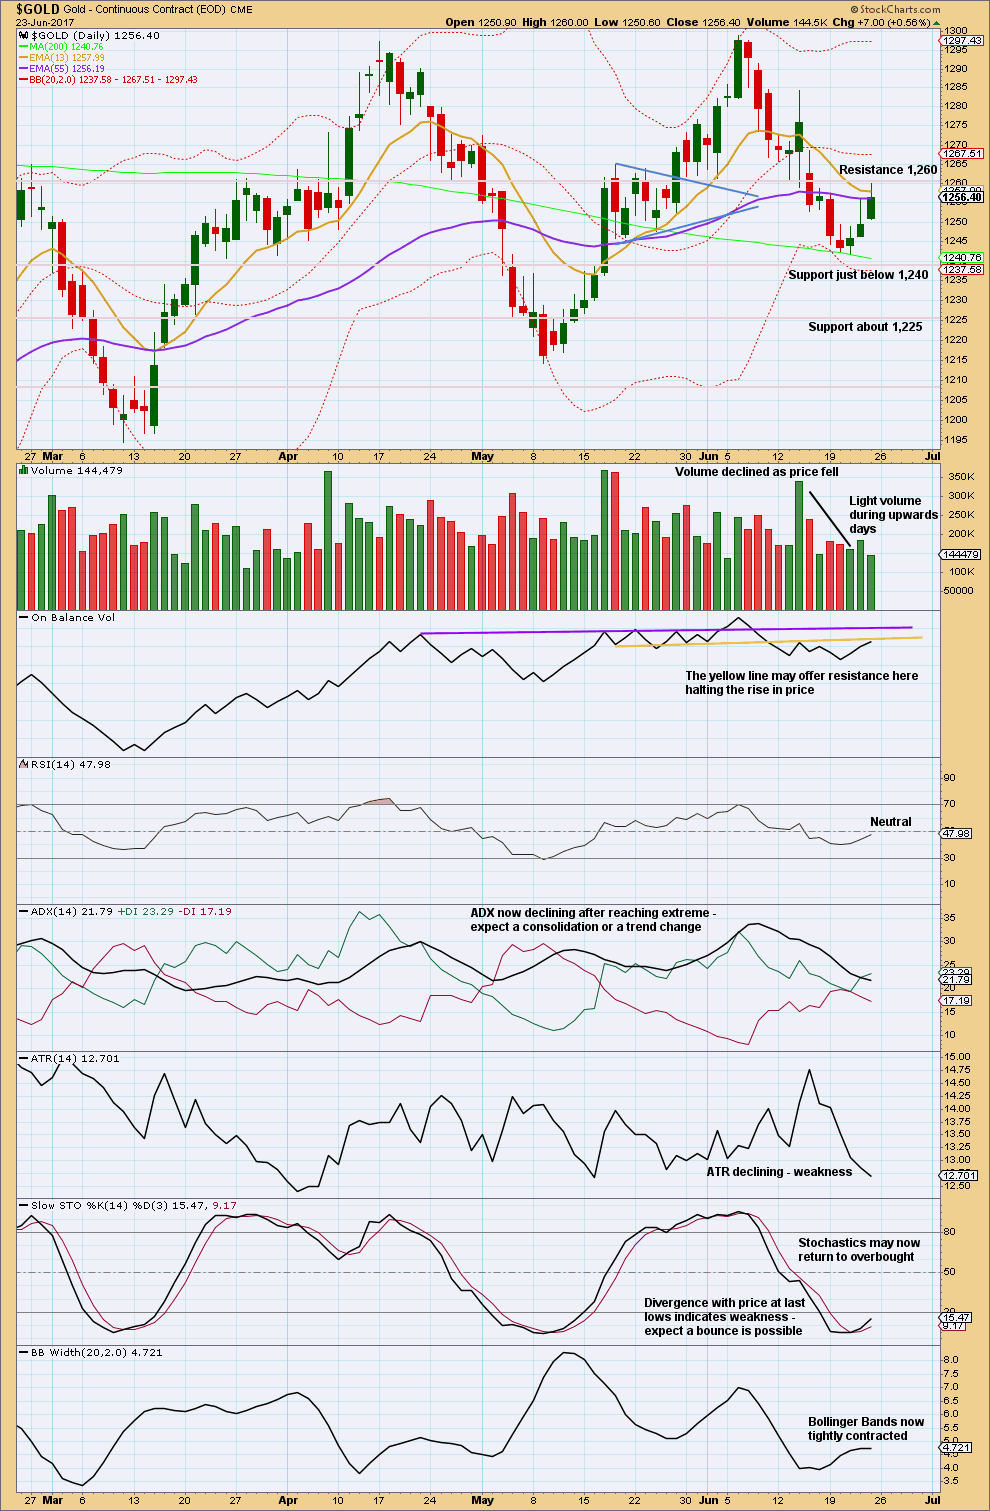
Long upper wicks on the last two daily candlesticks indicate weakness in upwards movement. Look out for a downwards reaction from resistance here, about 1,260. A lack of volume for Friday’s session also suggests a downwards reaction short term. On Balance Volume supports this view.
GDX
DAILY CHART
Click chart to enlarge. Chart courtesy of StockCharts.com.
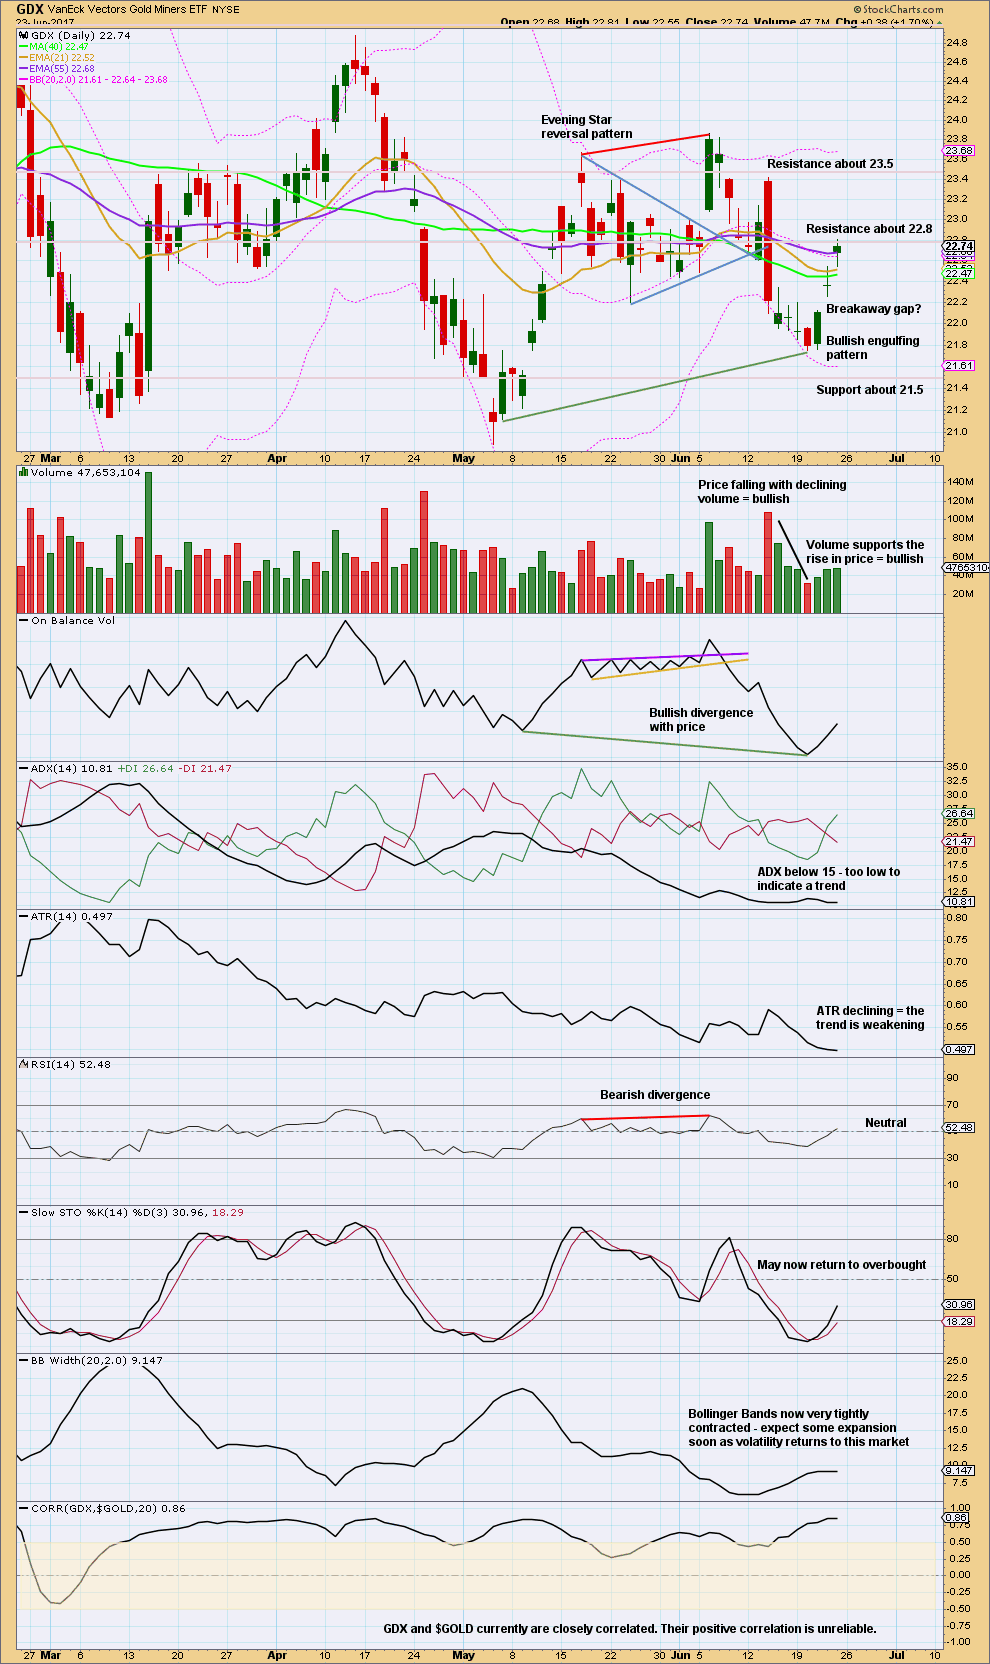
GDX looks more clearly bullish than Gold.
If the gap up is a breakaway gap from a small consolidation, then the lower edge of the gap should offer support. Breakaway gaps are not usually closed.
While GDX still looks more clearly bullish than Gold for the short term, upwards movement has small range and overall lighter volume than the prior downwards movement. This looks like a counter trend movement that is not yet done.
This analysis is published @ 11:02 p.m. EST.

I continue to accumulate my favorite mining stock GORO under 5.00.
It pays a 0.5% dividend and is the only mining company I know that will pay your dividend in the actual metal if you so choose. It requires a few extra steps but is well worth the trouble. The shares are also option-able so you can safely generate another 3-5% by selling covered calls against your long position. What’s not to like?! 🙂
If you are interested:
https://www.goldresourcecorp.com/gold-silver-dividends.php
Uncle Sam will not allow folk to use this program in retirement accounts…I wonder why??? Hmnnnnn….
It looks like the alternate may be correct. An expanded flat may be unfolding.
Now that they are a massive 300 tons short with Gold threatening to retake 1250, will they double down, or will they cover? GDX already in the green.
Commercials covered about 40k net short positions last week. They probably saw a bounce coming. Reported on June 20, when gold was at its lows, now with gold going down to 1235ish, they may have covered more.
Somebody’s buying! (besides moi) 🙂
The 1-hour Ichimoku chart shows that there is nothing positive going for gold. The tenkan-sen lies below the kijun-sen, and gold price is having a hard time trying to break above the tenkan-sen. I think it will be a period of consolidation before any strong move could occur.
It does seem the low of 1237.06 is not the end of the drop yet. Using the Alternate Count, with Intermediate B so far 1241.33 – 1258.74 – Minor B – Minor C, if we take Minor B as 1237.06, it will be a 1.236 Fib retracement. Minor B could indeed drop lower, as far as the brown uptrend support line that I have been constantly using. At 1.618 Fib, Minor B would be 1230.57, nearer to the uptrend line, and that’s where I reckon it could find its resting place. The subsequent rebound in Minor C would be either 1.618 or 2.618 of Minor A, since Intermediate B is already established as an expanded flat.
A further thought is that what if the Main Count has Primary D either completed at 1230.57 or lower. Primary D could be 1295.65 – 1259.75 – 1279.06 – 1230.57? Primary E would then bring prices higher.
In either case, I’m waiting for a signal that the low is in before going long.
I don’t think primary D could be over. It would be just far too brief and shallow, the B-D trend line would have a strong slope.
It is possible we may have already had the “double dump”. Move off the spike low quite brisk. If we close above 1240 today I will be adding another 1/4 position.
Word on the street is the banksters dumped 300 tons of short contracts. Supposedly to help finance week-end Italian bank bailout. I was expecting something like this. One more dump probably coming. Look for it to be smartly bought.
Lara I’m perceiving confusion where I think people are saying minor b instead of intermediate b (Alan below excluded). So under the Daily Chart narrative you have, should the minor b be saying intermediate b? “Within primary wave D, minor wave B may not move beyond the start of minor wave A above 1,295.64”. Please set me straight,.. thanks.
Intermediate B is unfolding as a three wave structure of minors a,b, and c waves. The current move down would be minor b of intermediate B.
right. I think Laras got a misprint
Yes, I do.
Apologies for the confusion everybody. It should read intermediate (B), not minor B.
Wow. Disobediently, gold price had fallen below Daily Ichimoku cloud support. The brown uptrend line is still intact, so the bear market has not arrived, at least not yet.
If the low of 1239.83 has been the bottom, then Minor B can become an expanded flat, with a target of 1267 on the rebound.
I’m away at the moment as I have to meet some homecoming relatives, hence I couldn’t provide a full report, just a short comment.
Tell them to go back on vacation and come home later. We need you!!!! Hahahaha
wow is right. I was going to say something like– no worries, glad you could comment (cause you are much appreciated) — but Stephens comment is so much better! lol
Thanks people for your trust in me.
I’m back — see Ichimoku update above.
At the moment, I think the drop is not yet over. I couldn’t find any definite positive signal that a price rise is taking over from the spike down earlier today.
Entering 1/4 position long GDX. Another half at 1255 for Gold.
Classic bear raid to run stops of long positions. Probaby the end of minor b.
Gold to silver ratio (GSR) in hour period is forming top HnS Nl at 74.8 and Head at last top 76.
The spike is right shoulder.
See if this HnS is confirmed by GSR dropping below the NL.
Lara’s alt hourly wave count is in play and GSR is indicating that wave B may be complete.
Lara : In daily post is it possible to include summary of alt count as well?
Thanks for excellent analysis and your guidance I can not get any where else.
Happy to be here among other top analysts and their view points.
GSR right at the N: 74.920 down from RS.
Hope it breaks down from here and confirms top HnS.
As GSR goes down nominal price of metals trend up.
Any forecast where the GSR is headed to after BO??
Do you mean the alt count at the hourly chart level, or weekly?
Yes hourly level.
Okay
Hourly wave count is invalidated at 1236.
This drop is deep. Maybe caused by money laundering act taking effect from 26th June 2017 in Germany.
If the right honorable PM Narendra Moodi thinks he is going to get Indians to let the banksters confiscate their Gold I got a bridge in Brooklyn I would like to sell him! Hyuk! Hyuk!
Nah. It is a simple matter. Roosevelt did it in 1933. Just sign an executive order and the people have to comply under penalty of law. No big deal.
Jordan on gold…
https://thedailygold.com/gold-gold-stocks-nearing-a-big-move/
Thanks for the update guys. You both add great value!
I posted on the last thread about CFTC action on price manipulation so I am always alert for a potential unexpected move in the metals if regulators actually begin to police this area. As we all know notional contracts exceed the physical metal by better than 100:1, and there are also 15K tons purchased for delivery yearly above global production. That Gold has probably been quietly moving from Western vaults. Folks who own un allocated metal may one day discover it has been “loaned” to another party.
In addition to regulatory tightening of the rules regarding the way the metal is traded, there is one other event that could serve as a paradigm shift in the price of Gold and Silver. I am not certain how this would be reflected in the EW count but the fact that every day the metals are traded this remains a distinct possibility. This potential black swan is of course a “failure to deliver” on a large trade. While we don’t normally think about this, the fact is it is a very real possibility when you consider the sheer volume being traded daily. Clearly it is in the best interest of the players that this never happens. For the seller it would put him out of business. For the buyer, it is the end of his ability to accumulate the metal at suppressed prices. I think this is the only reason it has not yet happened, or at least been publicly disclosed. I think it is not a matter of IF this will happen, only when. At that point, chances are bids will disappear from the market and you will be unable to obtain Gold or Silver at any price. Thankfully that is still some time away I think. First, a deflationary depression with prices going back below 1000.00 for the last time this century. I am a long term bull!
SILVER Weekly Ichimoku Analysis
Data as at market close of June 23
===========================
Like gold, the silver market initially fell during the week but then rolled right back at 16.32, just above the brown long-term uptrend line. (Whew! Any lower and it will be an entrenched bear market). The V-shaped bounce is, of course, bullish, and prices should head towards the 17.00 level where the bottom cloud boundary currently is, and maybe the 17.50 level after that. Longer-term, once buyers return to the market, upward pressure should continue.
In the Daily Ichimoku Chart, prices continue to trade below both the tenkan-sen and the kijun-sen, and the cloud has been red for more than half a month already. The tenkan-sen made a negative crossover with the kijun-sen early in the week, adding to the woes of a bearish market. Moving forward, prices ought to rise in tandem with gold, but there’s going to be a massive amount of volatility along the way. This is because the cloud is red into the near future, unlike gold. Unless prices can enter into the cloud, and better yet, rise above the top cloud boundary at 17.36, trading would be sluggish. (That’s why I mentioned in the previous paragraph that buyers would only come back in droves above 17.50).
The risk to the downside still remains. There is no rule that says that silver must move in tandem with gold. The brown support line has to be monitored for the first signs of trouble. A break below that, and the bear rules.
Great trend line! The pattern of the three prior peaks suggest we do have some room to move higher and I suspect the next move down could take it out.
So far as how they trade, I think Silver and Gold are closely correlated so temporary price divergence means somebody is going to play catchup…
End of Week Analysis
Data as at the market close of June 23
================================
Gold markets initially fell during the week, but found enough support at the Ichimoku cloud bottom boundary that we turned around to form a significant hammer. If we can break above the 1260 resistance level, the market should then go towards the 1275 level, followed very shortly by the 1300 level. A break above that level is strongly bullish and investors will be loading up the truck for the ride up to the 1500 level.
The brown uptrend line will be the line to watch. As long as the uptrend line holds, pullbacks continue to offer value. If it does not hold, then things change; breaking down below the bottom of the uptrend line would send the market looking for the 1225 level, and then eventually the 1200 level after that. The mechanism by which this occurs would be the “kiss of death”. For those not familiar with this trading technique, this is a sequence of events starting with a sell-off taking prices below the 50 SMA. Price would then rebound towards the 50 SMA, and if it could not break above, the bearish momentum would take over to sink the price.
The Daily Ichimoku Chart shows that gold prices have bounced decidedly off the bottom cloud boundary. The cloud remains green although there is a short period in the first week of July when it is briefly red, indicating a slight pullback. The past three days have seen a fairly strong rally of almost $20, and that despite the tenkan-sen falling below the kijun-sen. The tenkan-sen had flattened out whilst the kijun-sen is rising, pointing to an increasing chance of a pullback in the very near-term. The long upper wicks of the candlesticks also signify weakness in the short rally. This rally, if it is not already over, should not move past the tenkan-sen at 1262.95. Following that, a pullback should move towards 1250, or the top cloud boundary.
This pullback would offer a nice opportunity to go long into at least the beginning of August, following the contour of the cloud. (Please note that Ichimoku analysis can only project 26 trading days into the future). Currently, the movements in the gold miners indicate that it is easier to go the upside, so that’s exactly how I’m looking at the market. Who knows, we may be rewarded with a break above the 1300 level, and a bull run ensues, trampling the bears. This may not be a pipe dream after all because geopolitics had been dormant for a while. When awakened from its slumber, it can make a difference.
Thank you very much Alan for sharing again your invaluable analysis.
I see what you see. An increasing chance for a pullback, short term.
Let’s see what happens in the markets Monday / Tuesday.
Lara. Thanks for the support. I hope I’m getting it right. Please do comment if otherwise. We can all learn and improve along the way, honing our trading techniques.
Have a nice weekend. Here, In Singapore, we have a day off on Monday in celebration of the end of the Muslim fasting month, the Eid al-Fitr. But being a non-Muslim, I’ll still trade.
Thanks Alan for all your frequent updates. Have more or less the same views. Expecting similar price action like last week – possible rally for Monday; for a likely take out of Friday high targeting around 1264+? (imo Gold price is presently bottomy at 1251-49 holding) and then a pullback during the week to go long on it, depends on how deep the pullback will go…. Nimble trade!
Here’s a zoomed in look at the 30 minute GDX chart for just the impulsive move up this week. If correct, it should be complete. A 2-3 day pullback is expected for early next week, likely ending at the .382 or .618 Fib retracement.
https://www.tradingview.com/x/p6lAi4h5/
That would fit very neatly with the expectations I have for Gold early next week.
Way to go, Dreamer.
This ties in perfectly with my analysis for NUGT.
Like Lara mentioned in your other post, I was taken aback by the speed at which the triangle completed. It looks like a nice ride up just after this pullback.
GDX had a nice impulsive move up this week for a 4.9% gain from the low. Price is now near channel resistance. This is the Bull count; however, even if the Bear count prevails, another leg up is expected after a 2-3 day pullback early next week.
https://www.tradingview.com/x/BXU4ODUF/
A very nice wave count Dreamer, and thank you again for sharing.
I’m uncomfortable with how quickly the triangle comes to an end. However, having said that, a couple of triangles have come to a remarkably quick end on the S&P recently and caught me out. So take my discomfort possibly with a reasonable amount of salt 🙂
Triangles are such tricky structures. It’s so easy to label them wrong before they’re done. I’ve learned the hard way to always try an alternate idea with them.
What if primary B isn’t done? What if recent sideways movement is a smaller triangle within the larger triangle for an X wave of a double zigzag for primary B upwards?
Lara, thanks for your thoughts. I agree on the difficulty of labeling triangles correctly. Seasonality is supportive of a strong move up starting about now.
That said, I do realize that it may be too obvious that the triangle is complete and that I need to continue looking for other options. I’m also not comfortable that this wave count doesn’t match up well with your gold count for the intermediate term.
Unfortunately, I’m afraid being uncomfortable 😣, is something we need to get comfortable with until the market shares more of it’s intentions 😳 😂