
The channel on the daily chart was breached indicating price should move lower, which it has.
Summary: The target for downwards movement to continue remains at 15.17. Corrections are an opportunity to join the trend. Stops may be set just above the last swing high at 17.742.
Always use a stop. Invest only 1-5% of equity on any one trade.
New updates to this analysis are in bold.
Last monthly chart is here.
ELLIOTT WAVE COUNT
FIRST WEEKLY CHART
Click chart to enlarge.
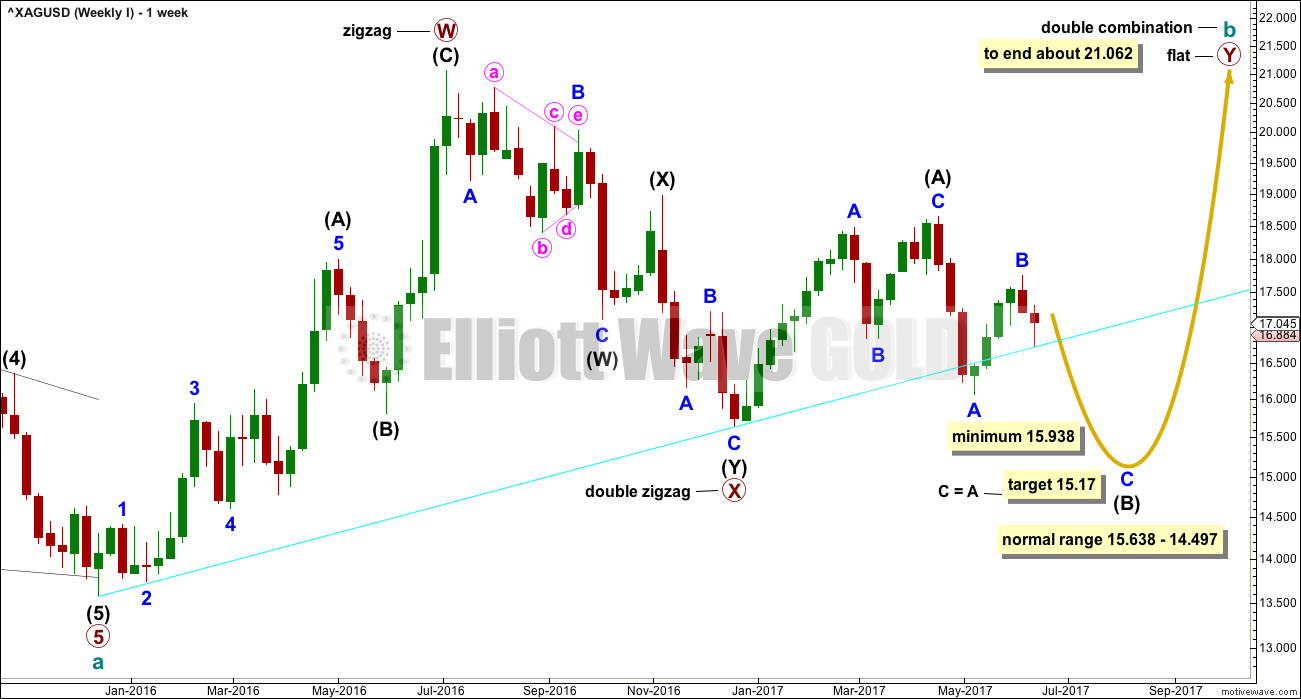
Cycle wave b may be completing as a double combination: zigzag – X – flat. The second structure, a flat correction for primary wave Y, may be underway.
Within a flat correction, intermediate wave (B) must retrace a minimum 0.9 length of intermediate wave (A) at 15.938. The common range for intermediate wave (B) is from 1 to 1.38 the length of intermediate wave (A). The target calculated this week would see intermediate wave (B) reach to within the common range and pass its minimum requirement. If minor wave B moves any higher, then the target for intermediate wave (B) must also move correspondingly higher.
Intermediate wave (B) may make a new price extreme beyond the start of intermediate wave (A), as in an expanded flat, which are very common structures.
The bigger picture for cycle wave b would expect primary wave Y to end about the same level as primary wave W about 21.062. The purpose of combinations is to take up time and move price sideways. To achieve this purpose the second structure in the double normally ends about the same level as the first.
The maximum number of corrective structures is three within combinations (and multiple zigzags). This maximum applies to sub-waves W, Y and Z. Within these structures, they may only be labelled as simple A-B-C corrections (or A-B-C-D-E in the case of triangles). They may not themselves be labeled multiples as that would increase the number of corrections within the structure beyond three and violate the rule.
X waves are joining structures and they are not counted in the maximum total of three (otherwise the maximum would be five). X waves may be any corrective structure, including multiples.
While the combination wave count at the weekly chart level does not currently work for Gold, it does still work for Silver. They do not have to complete the same structures for cycle wave b, and fairly often their structures are different.
FIRST DAILY CHART
Click chart to enlarge.
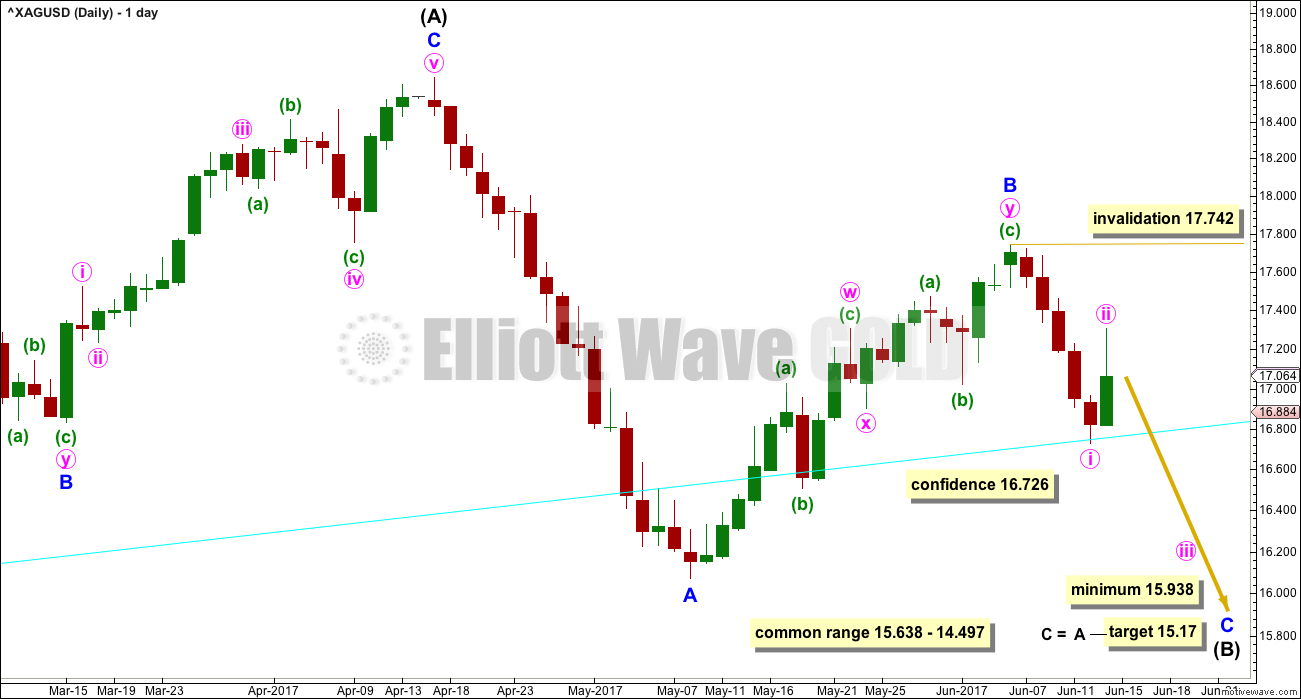
After price breached the channel that was drawn about minor wave B (in last analysis), it continued lower. Price has bounced strongly up off the cyan trend line.
Minute wave ii is a deep 0.57 correction of minute wave i. It looks fairly likely to now be over.
Minute wave iii downwards should exhibit an increase in downwards momentum.
SECOND WEEKLY CHART
Click chart to enlarge.
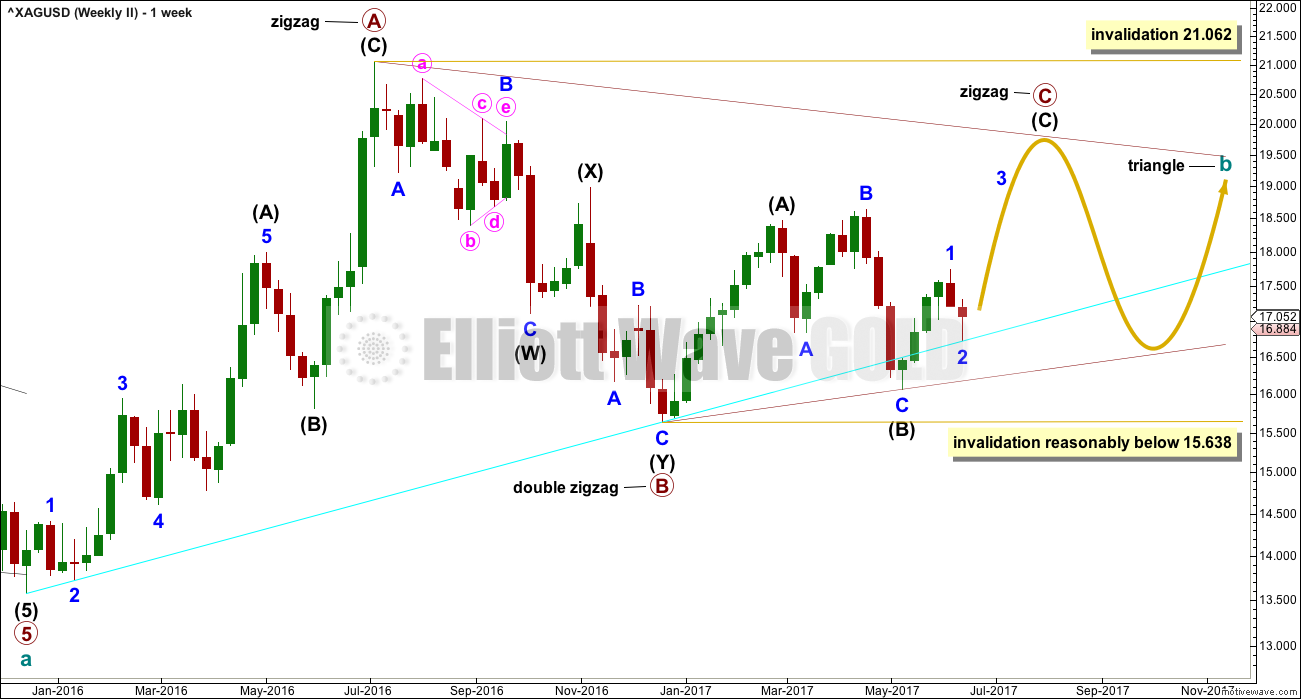
It is also possible that cycle wave b may be completing as a triangle. Mostly because combinations are more common than triangles is this a second wave count.
Within a triangle, only one of the sub-waves may be a more complicated multiple. Primary wave B subdivides as a double zigzag. Primary waves C, D and E may only be single threes.
Within a contracting or barrier triangle, primary wave C may not move beyond the end of primary wave A above 21.062.
To label primary wave C over at the last high of the 17th of April would see the A-C trend line too steeply sloped to have a normal look. It would be only a 0.55 length of primary wave B, which is unusually short for a triangle sub-wave. It would look more likely that primary wave C is not over.
Within a contracting triangle, primary wave D (nor any part of primary wave C) may not move beyond the end of primary wave B below 15.638.
Within a barrier triangle, primary wave D should end about the same point as primary wave B. As long as the B-D trend line remains essentially flat the triangle will remain valid. In practice, this means that primary wave D may move slightly below the end of primary wave B (this is the only Elliott wave rule which is not black and white).
The final wave of primary wave E may not move beyond the end of primary wave C. It would most likely fall short of the A-C trend line.
This second wave count expects a large consolidation to continue for months.
SECOND DAILY CHART
Click chart to enlarge.
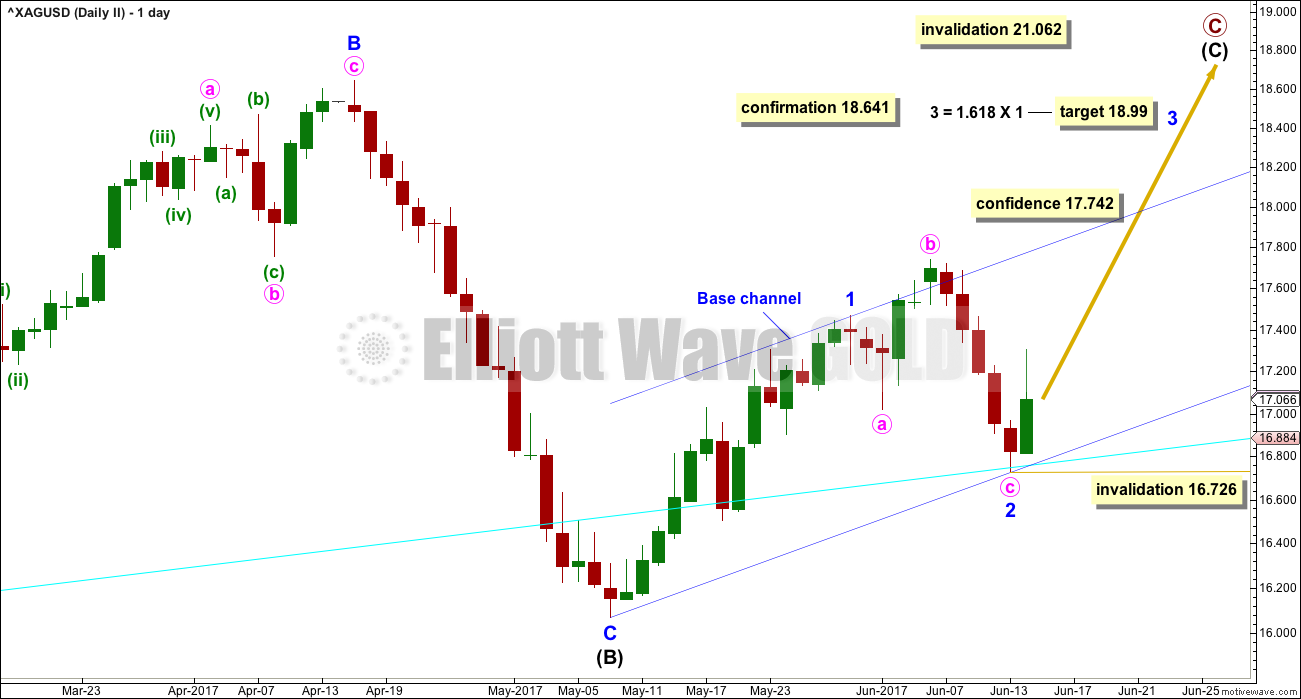
Primary wave C may be an incomplete zigzag.
A new high above 18.641 would at this stage invalidate the first wave count and provide some confirmation of this second wave count.
A new low reasonably below 15.638 would see this second wave count invalidated and the first wave count increase in probability.
It is difficult to see minor wave 1 as a complete impulse, where this upwards movement fits perfectly as a double zigzag for the first wave count. This problem has reduced the probability of this second wave count further.
Minor wave 2 may be a complete expanded flat. Within minor wave 3, no second wave correction may move beyond the start of its first wave below 16.726.
TECHNICAL ANALYSIS
WEEKLY CHART
Click chart to enlarge. Chart courtesy of StockCharts.com.
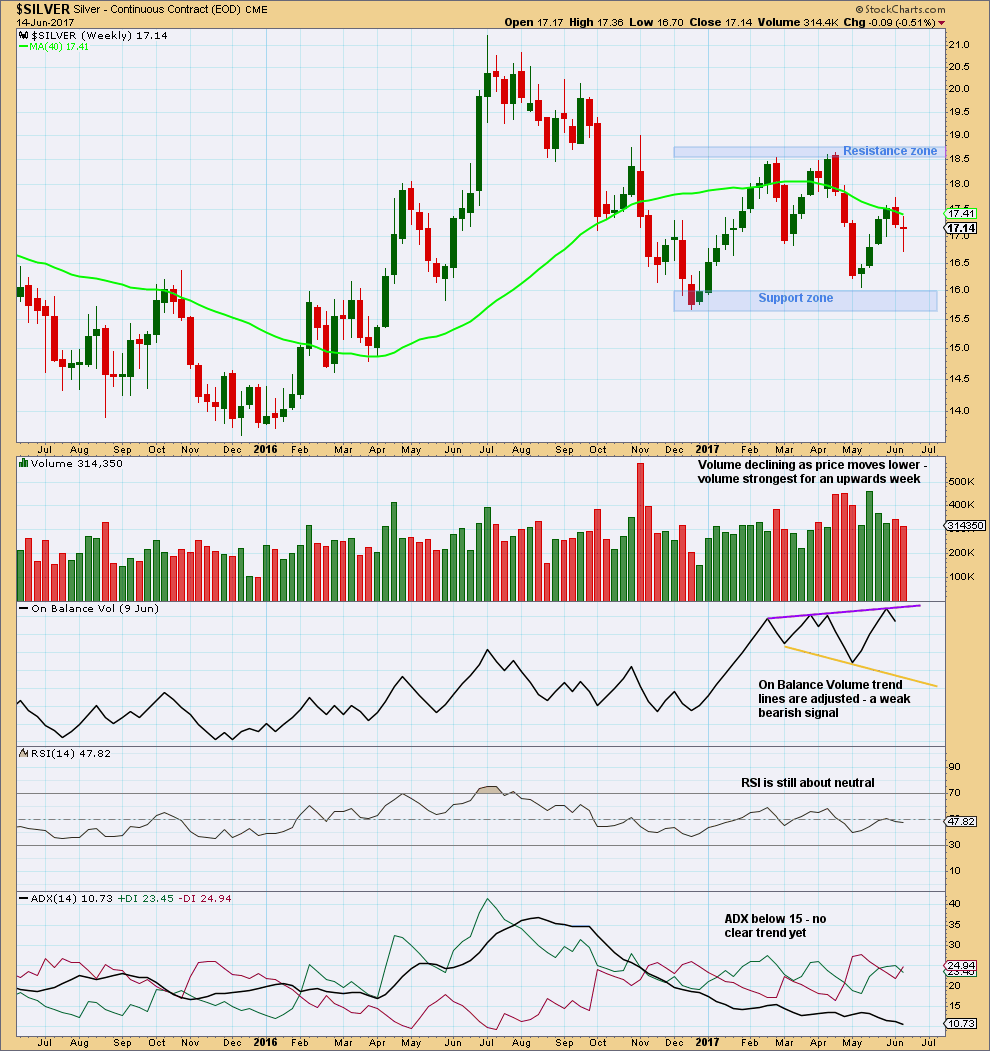
Volume is now strongest during an upwards week. This suggests an upwards breakout from the trading range is more likely than downwards.
Overall, Silver is now in a large consolidation at the weekly chart level. Support is about 16.05 – 15.70 and resistance is about 18.55 – 18.65. ADX agrees that price is consolidating.
A weak bearish signal from On Balance Volume suggests only that a downwards swing within the larger consolidation may be underway now.
DAILY CHART
Click chart to enlarge. Chart courtesy of StockCharts.com.
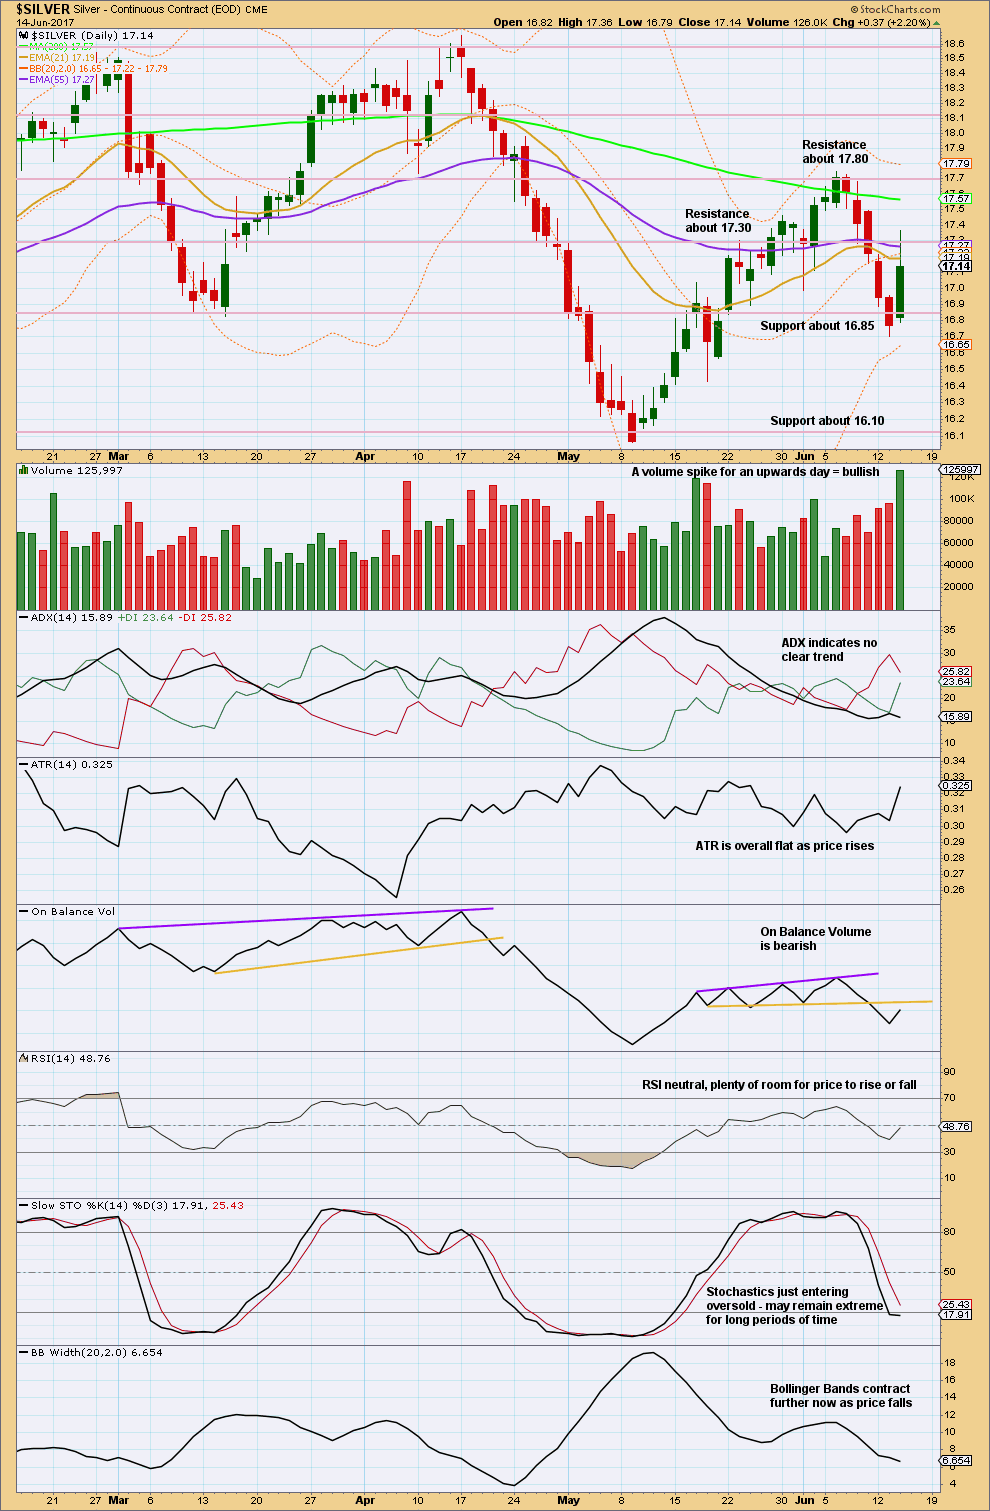
Give On Balance Volume reasonable weight. It supports the first Elliott wave count over the second.
After a period of flat ATR and contracting Bollinger Bands, expect range and volatility to return to the market.
This analysis is published @ 10:48 p.m. EST.