
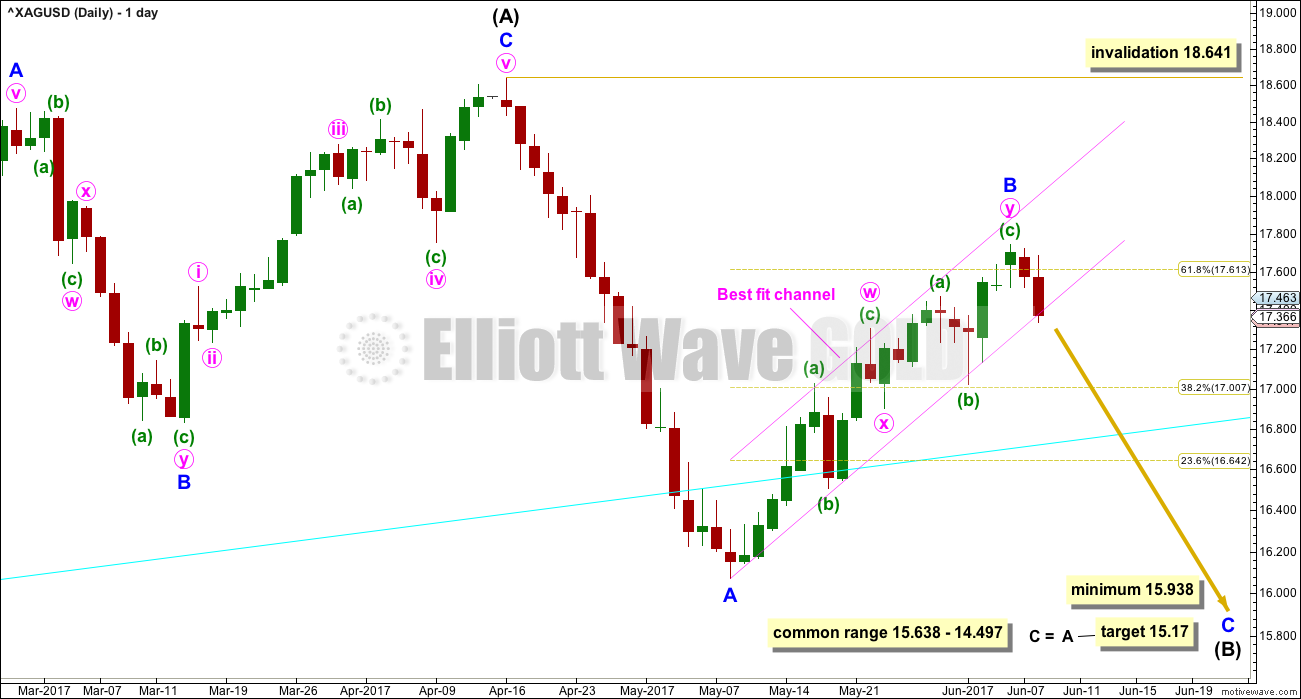
Again, price remained within the channel on the first daily chart. There is as yet no confirmation of a trend change.
Summary: Use the pink Elliott channel on the first daily chart. If price breaks below the channel, expect the next wave down has begun. Stops may be set just above the last swing high. The target would be at 15.17.
If upwards movement continues a little further, it may end close to the 0.618 Fibonacci ratio at 17.613.
New updates to this analysis are in bold.
Last monthly chart is here.
ELLIOTT WAVE COUNT
FIRST WEEKLY CHART
Click chart to enlarge.
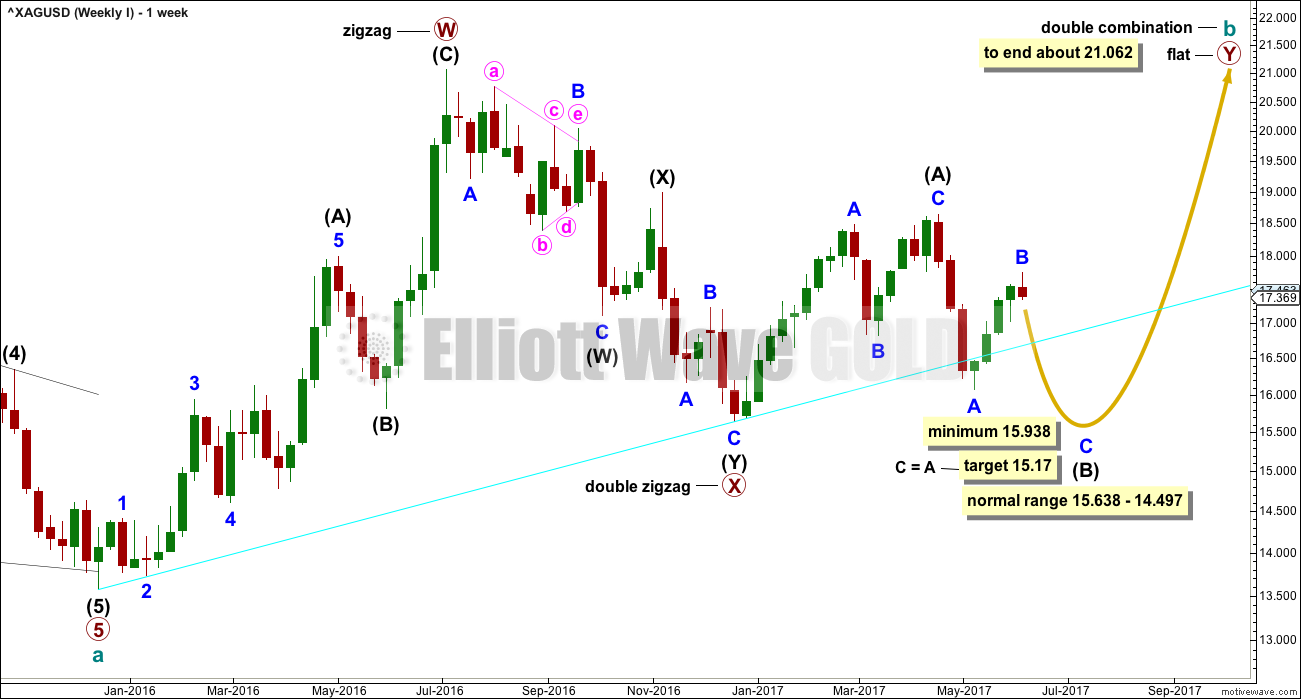
Cycle wave b may be completing as a double combination: zigzag – X – flat. The second structure, a flat correction for primary wave Y, may be underway.
Within a flat correction, intermediate wave (B) must retrace a minimum 0.9 length of intermediate wave (A) at 15.938. The common range for intermediate wave (B) is from 1 to 1.38 the length of intermediate wave (A). The target calculated this week would see intermediate wave (B) reach to within the common range and pass its minimum requirement. If minor wave B moves any higher, then the target for intermediate wave (B) must also move correspondingly higher.
Intermediate wave (B) may make a new price extreme beyond the start of intermediate wave (A), as in an expanded flat, which are very common structures.
The bigger picture for cycle wave b would expect primary wave Y to end about the same level as primary wave W about 21.062. The purpose of combinations is to take up time and move price sideways. To achieve this purpose the second structure in the double normally ends about the same level as the first.
The maximum number of corrective structures is three within combinations (and multiple zigzags). This maximum applies to sub-waves W, Y and Z. Within these structures, they may only be labelled as simple A-B-C corrections (or A-B-C-D-E in the case of triangles). They may not themselves be labeled multiples as that would increase the number of corrections within the structure beyond three and violate the rule.
X waves are joining structures and they are not counted in the maximum total of three (otherwise the maximum would be five). X waves may be any corrective structure, including multiples.
While the combination wave count at the weekly chart level does not currently work for Gold, it does still work for Silver. They do not have to complete the same structures for cycle wave b, and fairly often their structures are different.
FIRST DAILY CHART
Click chart to enlarge.
Minor wave B moved a little higher to reach just above the 0.618 Fibonacci ratio of minor wave A so far.
The pink channel is a best fit. When it is breached by a full daily candlestick below and not touching it, then it would provide confidence in a trend change. So far it is only slightly overshot, not breached. Price remains mostly contained within it.
Accept the possibility that price may yet continue higher while it remains contained within the channel.
SECOND WEEKLY CHART
Click chart to enlarge.
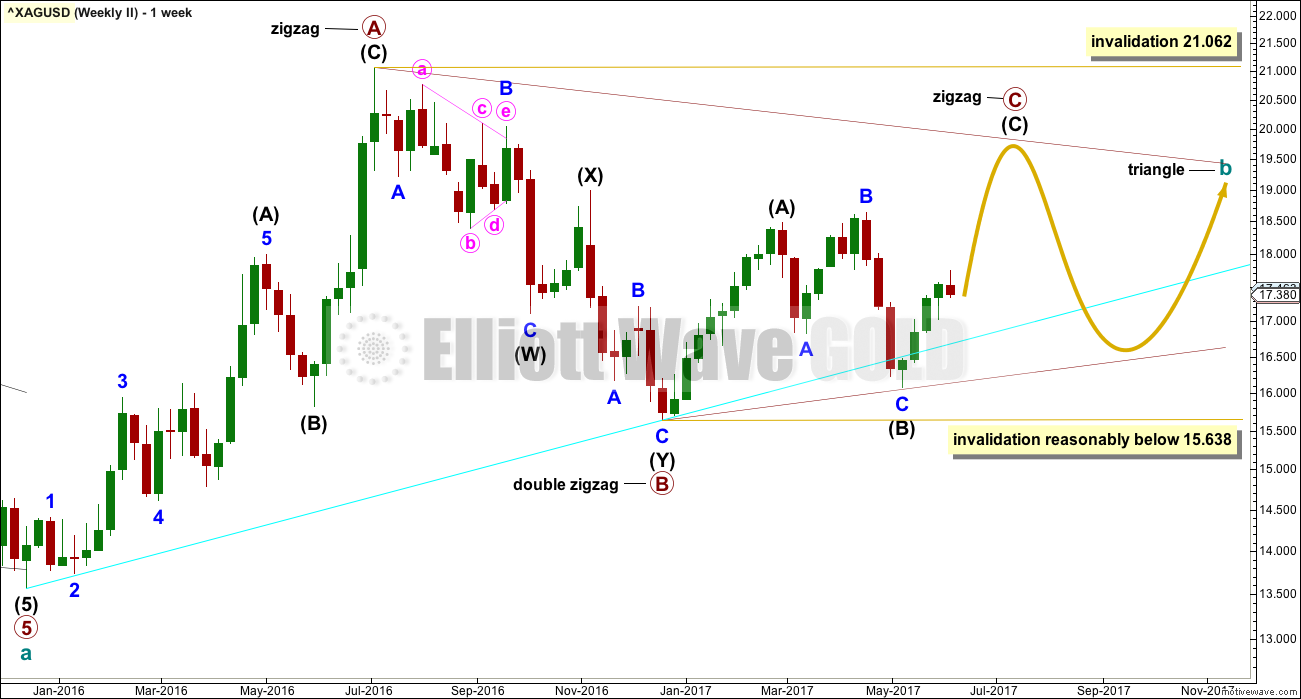
It is also possible that cycle wave b may be completing as a triangle. Only because combinations are more common than triangles is this a second wave count.
Within a triangle, only one of the sub-waves may be a more complicated multiple. Primary wave B subdivides as a double zigzag. Primary waves C, D and E may only be single threes.
Within a contracting or barrier triangle, primary wave C may not move beyond the end of primary wave A above 21.062.
To label primary wave C over at the last high of the 17th of April would see the A-C trend line too steeply sloped to have a normal look. It would be only a 0.55 length of primary wave B, which is unusually short for a triangle sub-wave. It would look more likely that primary wave C is not over.
Within a contracting triangle, primary wave D (nor any part of primary wave C) may not move beyond the end of primary wave B below 15.638.
Within a barrier triangle, primary wave D should end about the same point as primary wave B. As long as the B-D trend line remains essentially flat the triangle will remain valid. In practice, this means that primary wave D may move slightly below the end of primary wave B (this is the only Elliott wave rule which is not black and white).
The final wave of primary wave E may not move beyond the end of primary wave C. It would most likely fall short of the A-C trend line.
This second wave count expects a large consolidation to continue for months.
SECOND DAILY CHART
Click chart to enlarge.
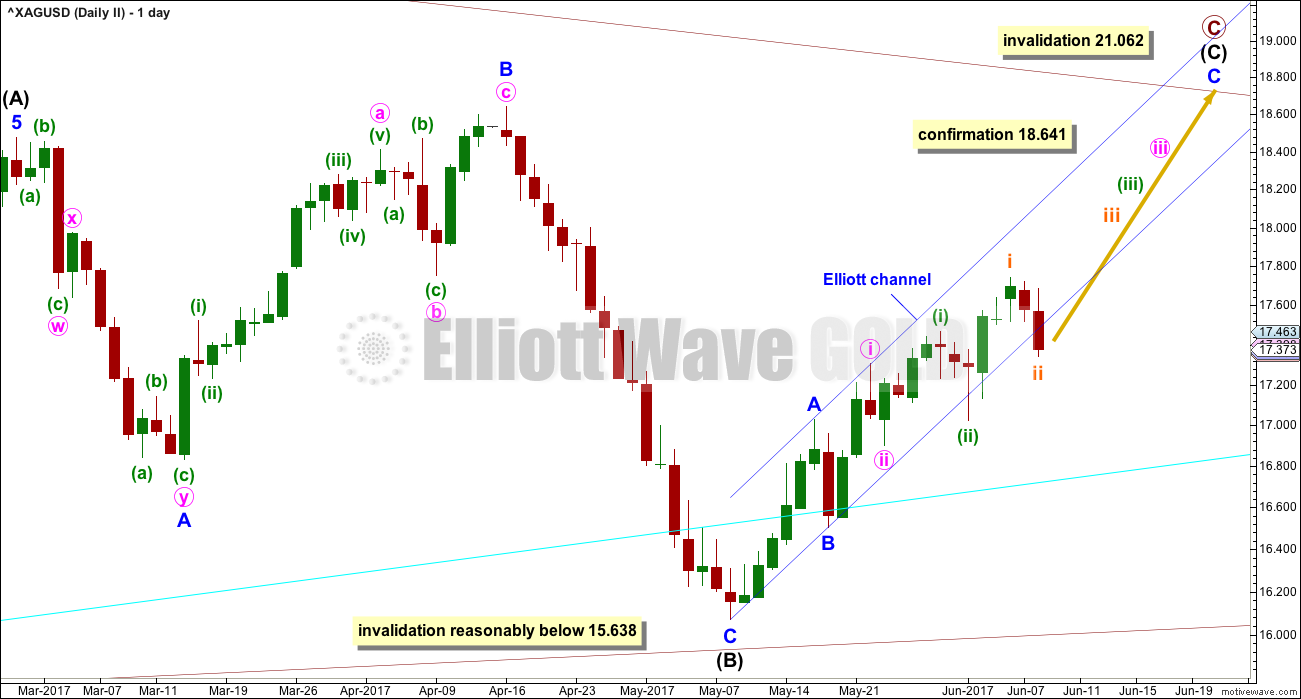
Primary wave C may be an incomplete zigzag.
A new high above 18.641 would at this stage invalidate the first wave count and provide some confirmation of this second wave count.
A new low reasonably below 15.638 would see this second wave count invalidated and the first wave count increase in probability.
At this stage, this wave count does not have as good a look for most recent movement as the first weekly chart. Here, the Elliott channel is slightly different to the best fit channel on the first daily chart. This Elliott channel is well overshot and does not look quite right. The wave count remains entirely technically valid though. Silver does not always complete Elliott wave structures which have the right look, so it is important to consider this idea.
If this wave count is correct, then there may be an imminent very strong upwards movement for Silver as the middle of a third wave takes off.
TECHNICAL ANALYSIS
WEEKLY CHART
Click chart to enlarge. Chart courtesy of StockCharts.com.
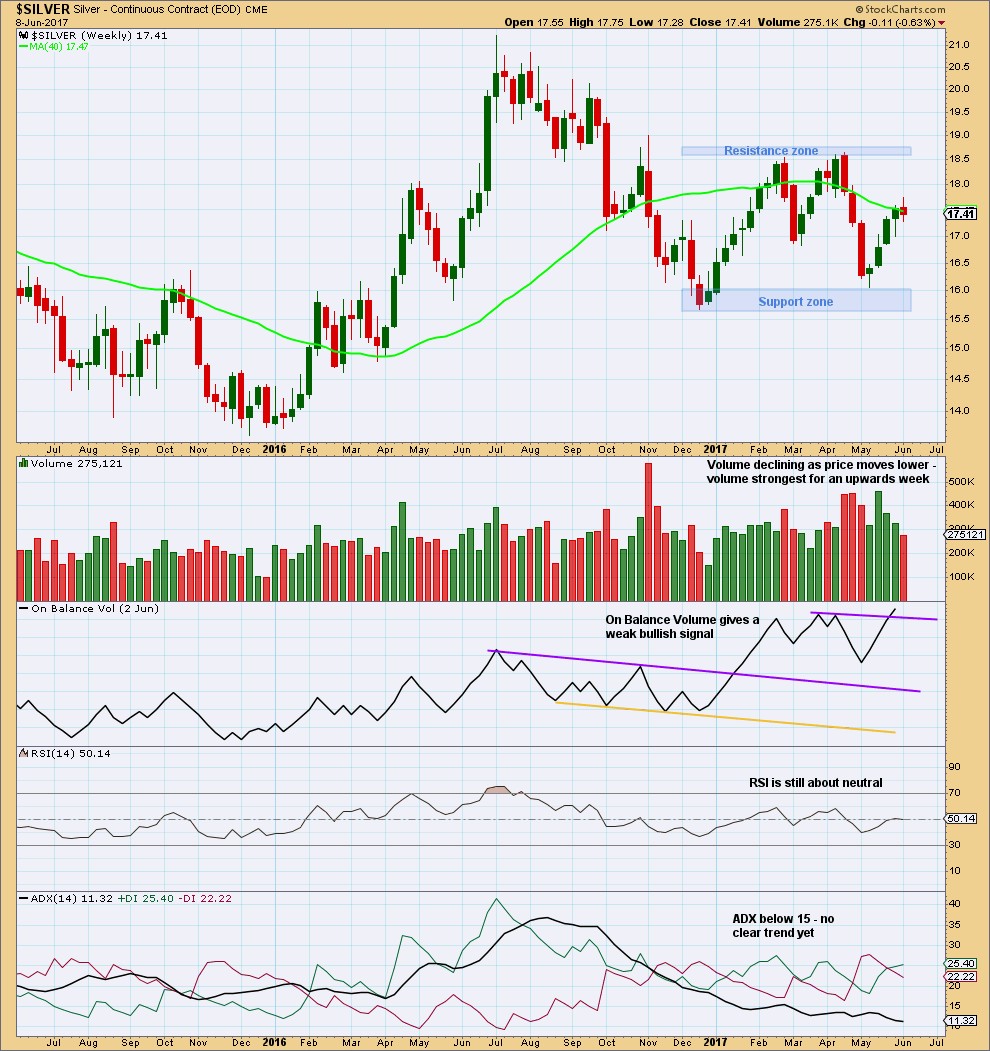
Volume is now strongest during an upwards week. This suggests an upwards breakout from the trading range is more likely than downwards.
Overall, Silver is now in a large consolidation at the weekly chart level. Support is about 16.05 – 15.70 and resistance is about 18.55 – 18.65. ADX agrees that price is consolidating.
The bullish signal from On Balance Volume is weak because the trend line that is breached has only been tested twice before and is not long held.
Declining volume as price moves higher should be given more weight in this instance. It looks like Silver is still range bound and upwards movement for now is weakening.
DAILY CHART
Click chart to enlarge. Chart courtesy of StockCharts.com.
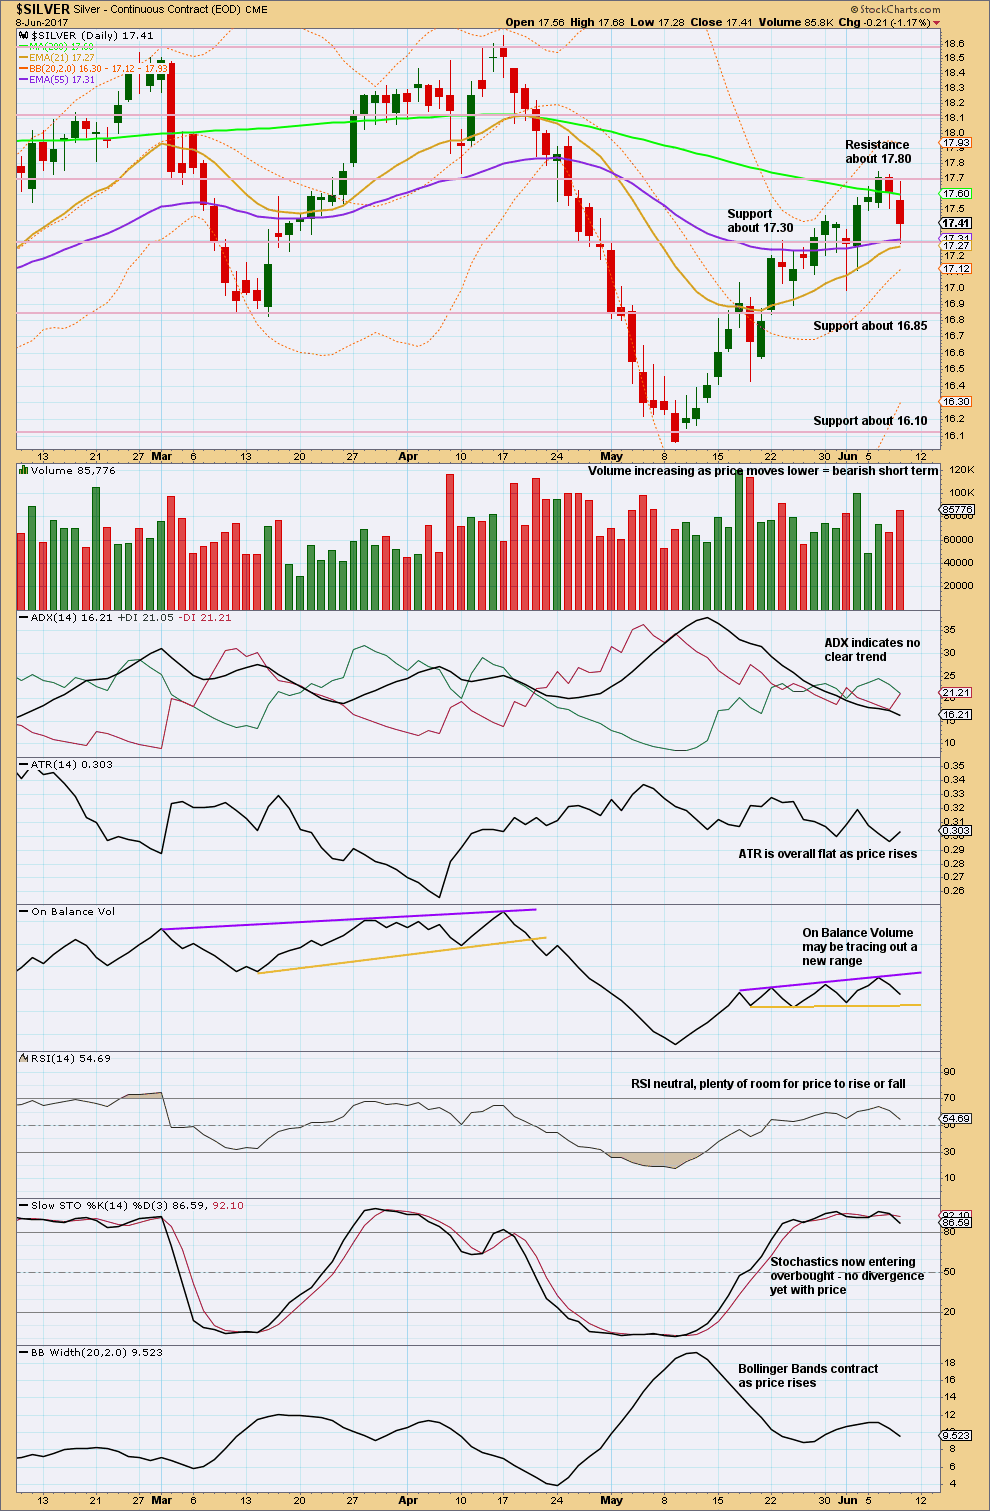
Upwards movement is very choppy and overlapping compared to prior downwards movement to the last major low on the 9th of May. Now there are two downwards days in a row that come with some increase in volume, which is bearish short term for Silver.
On Balance Volume is range bound. There is leeway in exactly how the yellow support line can be drawn, so for it to give a bearish signal any breach needs to be clear.
Bollinger Bands not expanding with price rising is bearish; a healthy trend normally comes with an increase in range and volatility.
This analysis is published @ 11:01 p.m. EST.