Yesterday’s hourly chart expected a bounce to about 1,218. The high for the session was 1,217.79.
Summary: The trend is still most likely down. In the short term, a bounce is either over here or may continue higher for another day. If price makes a new high by any amount at any time frame above 1,222.72, then expect the bounce to continue to about 1,232. Assume the trend remains down while price remains below 1,222.72, and expect the channel on the main hourly chart to offer resistance.
Profit target is now at 1,183 (measured rule) or 1,160 (Elliott wave).
Always use a stop and invest only 1-5% of equity on any one trade.
New updates to this analysis are in bold.
Last monthly charts and alternate weekly charts are here, video is here.
Grand SuperCycle analysis is here.
WEEKLY CHART
The Magee bear market trend line is added to the weekly charts. This cyan line is drawn from the all time high for Gold on the 6th of September, 2011, to the first major swing high within the following bear market on the 5th of October, 2012. This line should provide strong resistance.
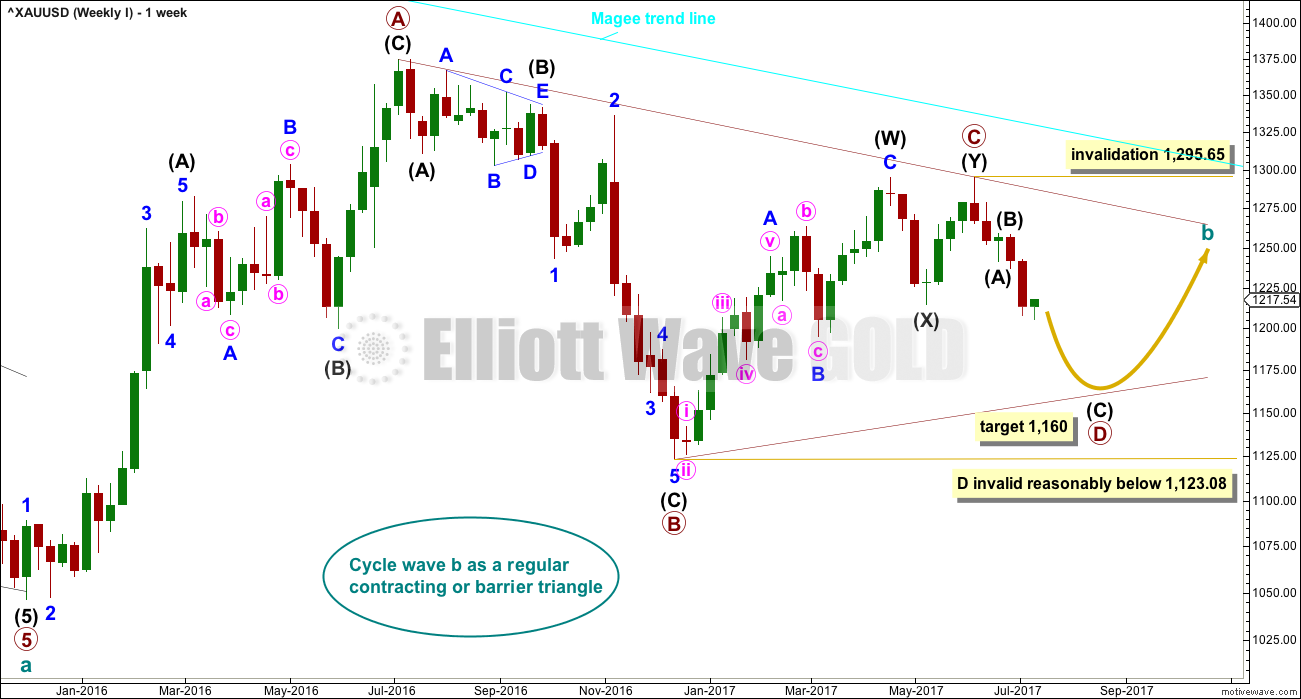
At this stage, a triangle still looks most likely and has the best fit for cycle wave b.
Within a triangle, one sub-wave should be a more complicated multiple, which may be primary wave C. Primary wave C may not move beyond the end of primary wave A above 1,374.91. This invalidation point is black and white.
At this stage, it looks like primary wave C is now complete at the hourly and daily chart level. A new low on Friday below 1,214.81 cannot be minor wave B within intermediate wave (Y) within primary wave C, so now primary wave C must be over.
Primary wave D of a contracting triangle may not move beyond the end of primary wave B below 1,123.08. Contracting triangles are the most common variety.
Primary wave D of a barrier triangle should end about the same level as primary wave B at 1,123.08, so that the B-D trend line remains essentially flat. This involves some subjectivity; price may move slightly below 1,123.08 and the triangle wave count may remain valid. This is the only Elliott wave rule which is not black and white.
Finally, primary wave E of a contracting or barrier triangle may not move beyond the end of primary wave C above 1,295.65. Primary wave E would most likely fall short of the A-C trend line. But if it does not end there, then it can slightly overshoot that trend line.
There are three alternate wave counts that have been published in the last historic analysis, which is linked to above. They are all very bullish. They will only be published on a daily basis if price shows them to be true with a new high now above 1,295.65.
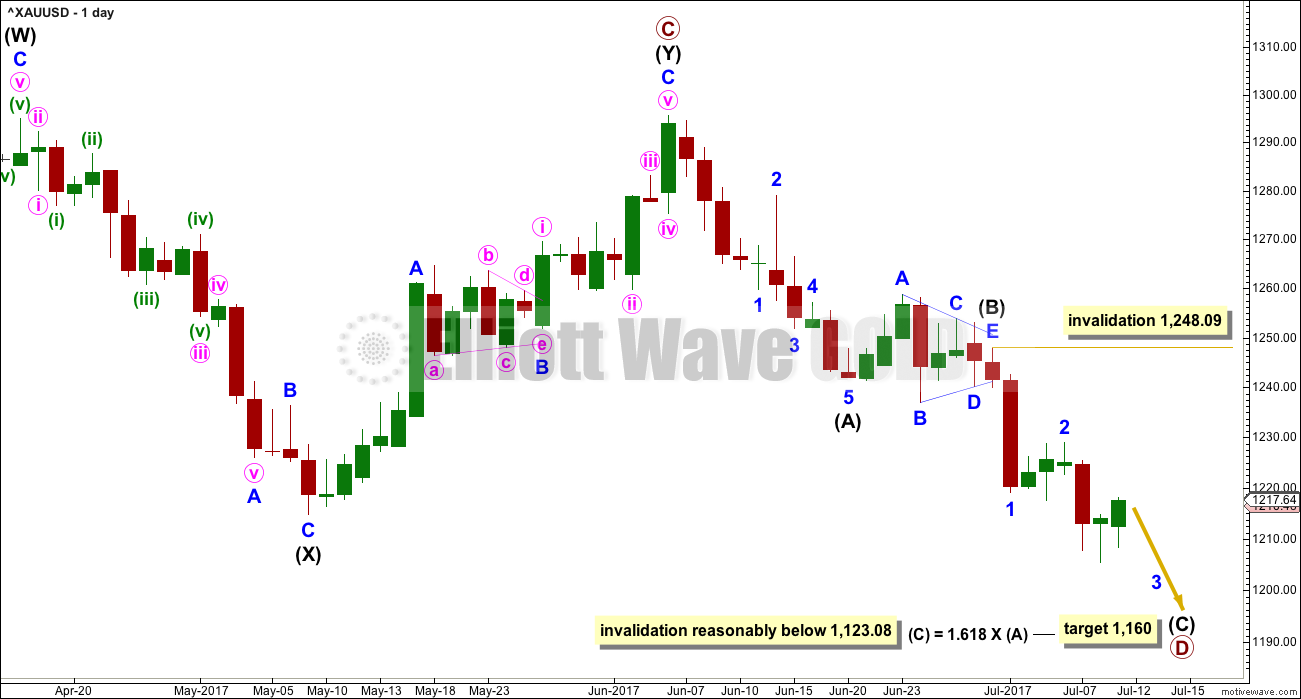
DAILY CHART
A new low below 1,214.81 could not be minor wave B within intermediate wave (Y) and has now provided strong confirmation that intermediate wave (Y) is over.
A common range for triangle sub-waves is from about 0.8 to 0.85 the prior sub-wave, this gives a range for primary wave D from 1,158 to 1,149. A Fibonacci ratio is used to calculate a target, which is just above this common range, for intermediate wave (C) now that intermediate waves (A) and (B) look to be complete. At this stage, to try and see the whole of primary wave D complete at Monday’s low does not look right. The B-D trend line would be too steep for a normal looking contracting Elliott wave triangle, and primary wave D would have been far too brief at only 5 weeks duration. For the wave count to have the right look and good proportions (as Gold almost always does), primary wave D should not be labelled over yet.
If primary wave C is correctly labelled as a double zigzag, then primary wave D must be a simple A-B-C structure and would most likely be a zigzag. With a triangle complete in the position labelled intermediate wave (B), the idea of a zigzag unfolding lower is strengthened. This may not be labelled a second wave as second waves do not subdivide as triangles. Triangles appear in positions of fourth waves, B waves, or within combinations.
Intermediate wave (A) lasted only ten days. Intermediate wave (B) has lasted eight days. As intermediate wave (C) is expected to be longer in length than intermediate wave (A), it may also be longer in duration and may last a Fibonacci thirteen days as the first expectation or a Fibonacci twenty one days as the next expectation. So far it has lasted only seven days.
Intermediate wave (C) must subdivide as a five wave motive structure, either an impulse or an ending diagonal. An impulse is much more likely; so let us assume that is the more likely structure until proven otherwise, or until some overlapping suggests a diagonal may be possible.
Within intermediate wave (C), minor waves 1 and 2 may now be complete. A new alternate today looks at the possibility that minor wave 2 may continue higher. Minor wave 2 may not move beyond the start of minor wave 1 above 1,248.09.
Primary wave A lasted 31 weeks, primary wave B lasted 23 weeks, and primary wave C may have been complete in 25 weeks.
Primary wave D should be expected to last at least 8 weeks (but most likely longer). The next Fibonacci ratio in the sequence would be a Fibonacci 13 and then 21.
HOURLY CHART
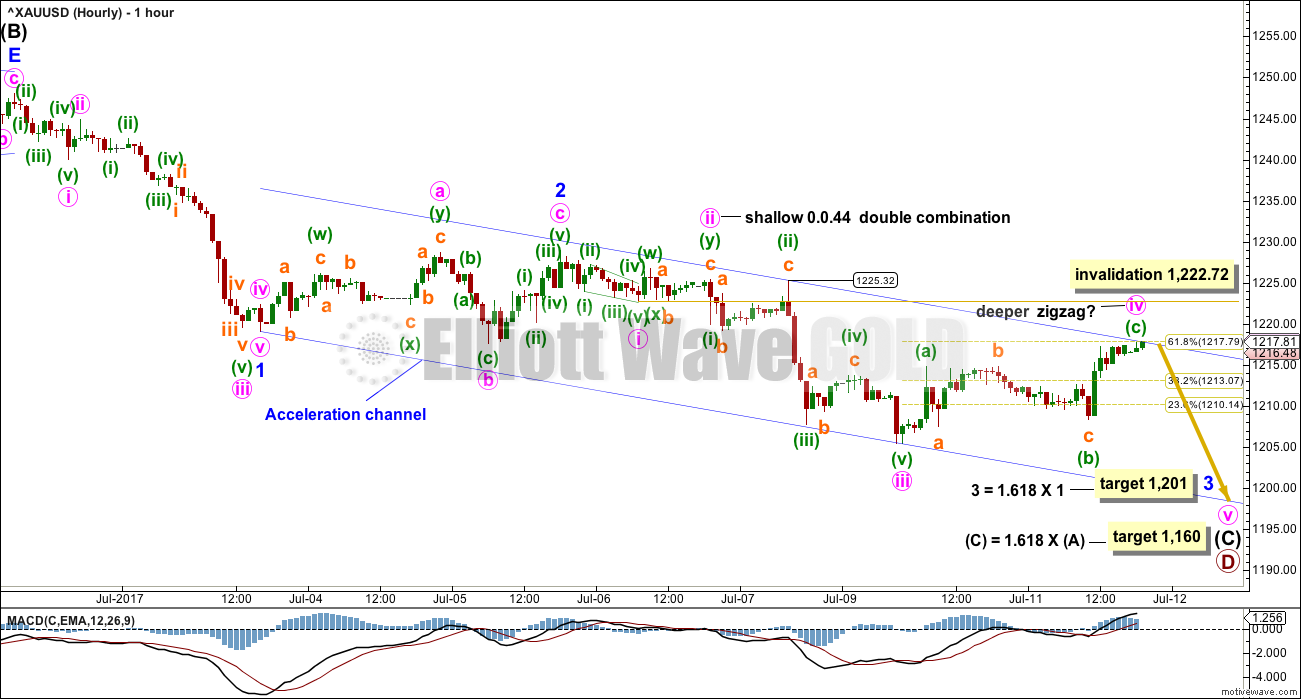
Minor wave 2 was over as a brief and shallow expanded flat correction.
Minor wave 3 may only subdivide as a simple impulse. It may be close to complete if the target is correct. At 1,201 minor wave 3 would reach 1.618 the length of minor wave 1.
When minor wave 3 is complete, then the invalidation point for minor wave 4 moves down to the end of minor wave 1 at 1,219.05.
So far, within the impulse of minor wave 3, minute wave iii now looks complete. There is no Fibonacci ratio between minute waves i and iii, making it more likely that minute wave v will exhibit a Fibonacci ratio to either. Within the completed impulse of minute wave iii, there is perfect alternation between the deep expanded flat correction of minuette wave (ii) and the shallow zigzag of minuette wave (iv).
Within the incomplete impulse of minor wave 3, minute waves ii and iv are exhibiting alternation in structure. Minute wave iv is deep, they also exhibit alternation in depth. Price is finding resistance at the upper edge of the acceleration channel, if the upper edge is pushed up ever so slightly to sit on the high labeled minuette wave (ii) within minute wave iii, at 1,225.32 (noted on the chart). If price moves above this channel, then this main hourly wave count would be in doubt.
Minute wave iv may not move into minute wave i price territory above 1,222.72. If price makes a new high by any amount at any time frame above this point, then this main hourly wave count would be invalidated and the alternate below should be used.
ALTERNATE HOURLY CHART
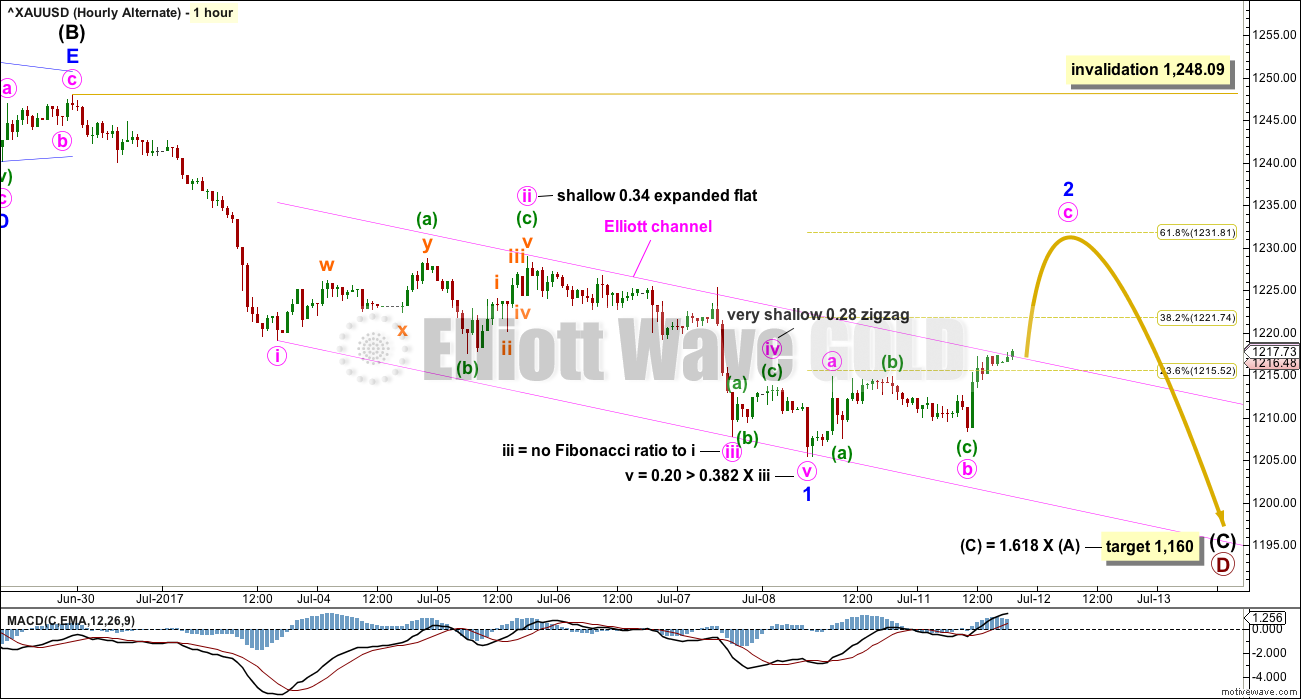
It is possible that only minor wave 1 within intermediate wave (C) is complete. Intermediate wave (C) would still be unfolding as an impulse, and would still be incomplete. The final target for primary wave D is the same.
If only minor wave 1 is complete, then this current bounce may be minor wave 2. A reasonable target would be the 0.618 Fibonacci ratio of minor wave 1 about 1,232, which coincides well with some prior resistance for the 6th of July at 1,229.50.
For this alternate wave count, the impulse of minute wave iii has a curved look to it. This is common for Gold’s third wave impulses. When Gold’s third waves unfold, very often they end with swift and strong fifth waves within them. Those strong fifth waves force the small fourth wave corrections within the impulse to be more brief and shallow than they would normally be. Because they are more brief, they do not show up on higher time frames whereas their counterpart second wave corrections do. This gives the whole impulse a curved look, typical of commodity behaviour.
Of more concern is the disproportion between minute waves ii and iv. Because minute wave v was not very swift and strong, and did not extend, it did not force minute wave iv to be more shallow than it may have otherwise been. Minute wave ii lasted 50 hours and minute wave iv lasted just 6 hours, so this must reduce the probability of this alternate wave count.
When the upper edge of the channel is placed in the high labelled minute wave ii, then it is now being breached as this analysis is prepared. This may be an early warning that this alternate wave count may be correct.
Minor wave 2 may not move beyond the start of minor wave 1 above 1,248.09.
TECHNICAL ANALYSIS
WEEKLY CHART
Click chart to enlarge. Chart courtesy of StockCharts.com.
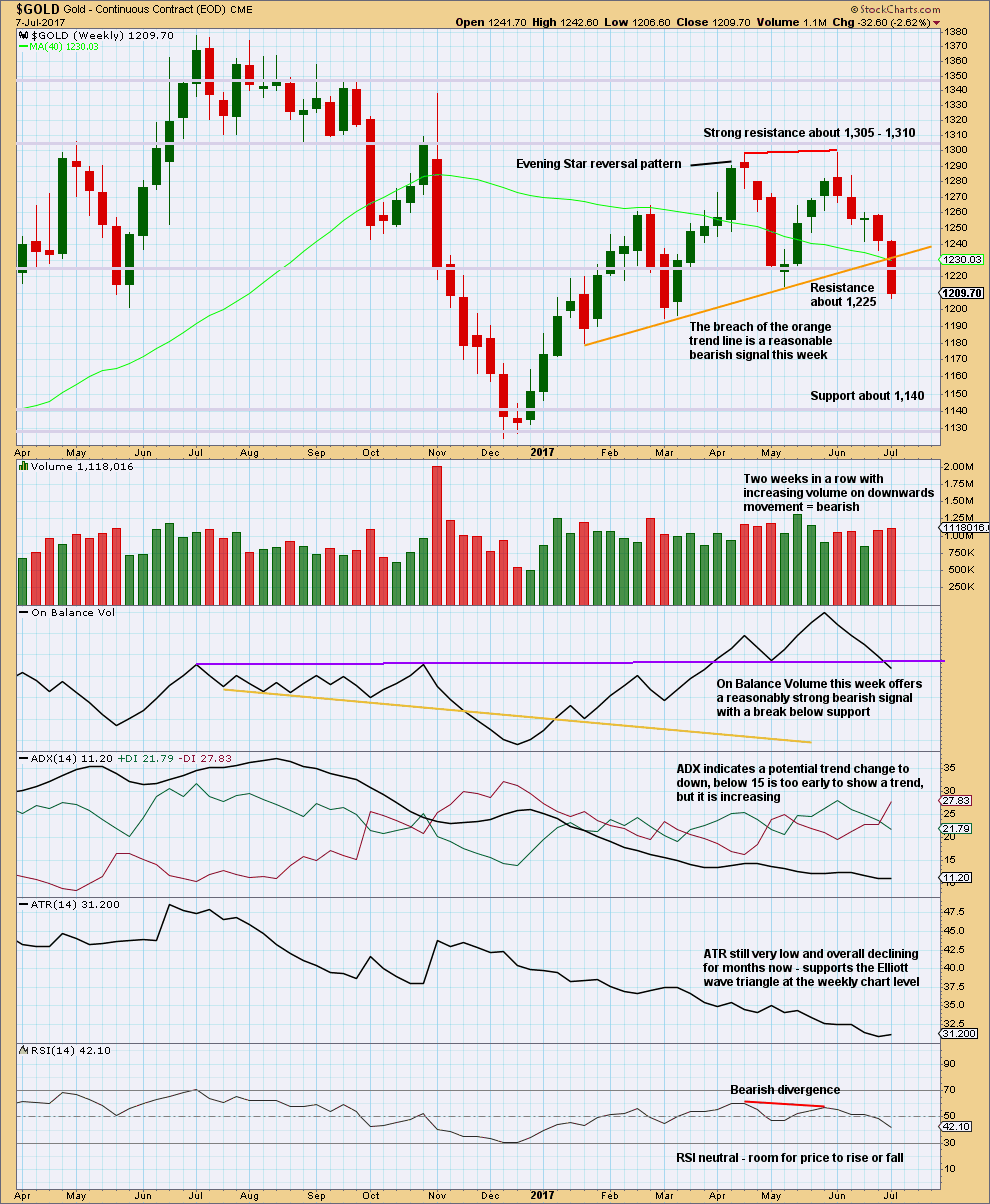
This chart offers strong support to the Elliott wave count.
The breach of the orange trend line by price is bearish. On Balance Volume gives a reasonable bearish signal, which should be given weight. Volume is bearish. ADX is slightly bearish. RSI is bearish.
Only ATR indicates weakness for the bigger picture (the Elliott wave triangle at the weekly chart level), but this does not preclude price from falling further here though.
DAILY CHART
Click chart to enlarge. Chart courtesy of StockCharts.com.
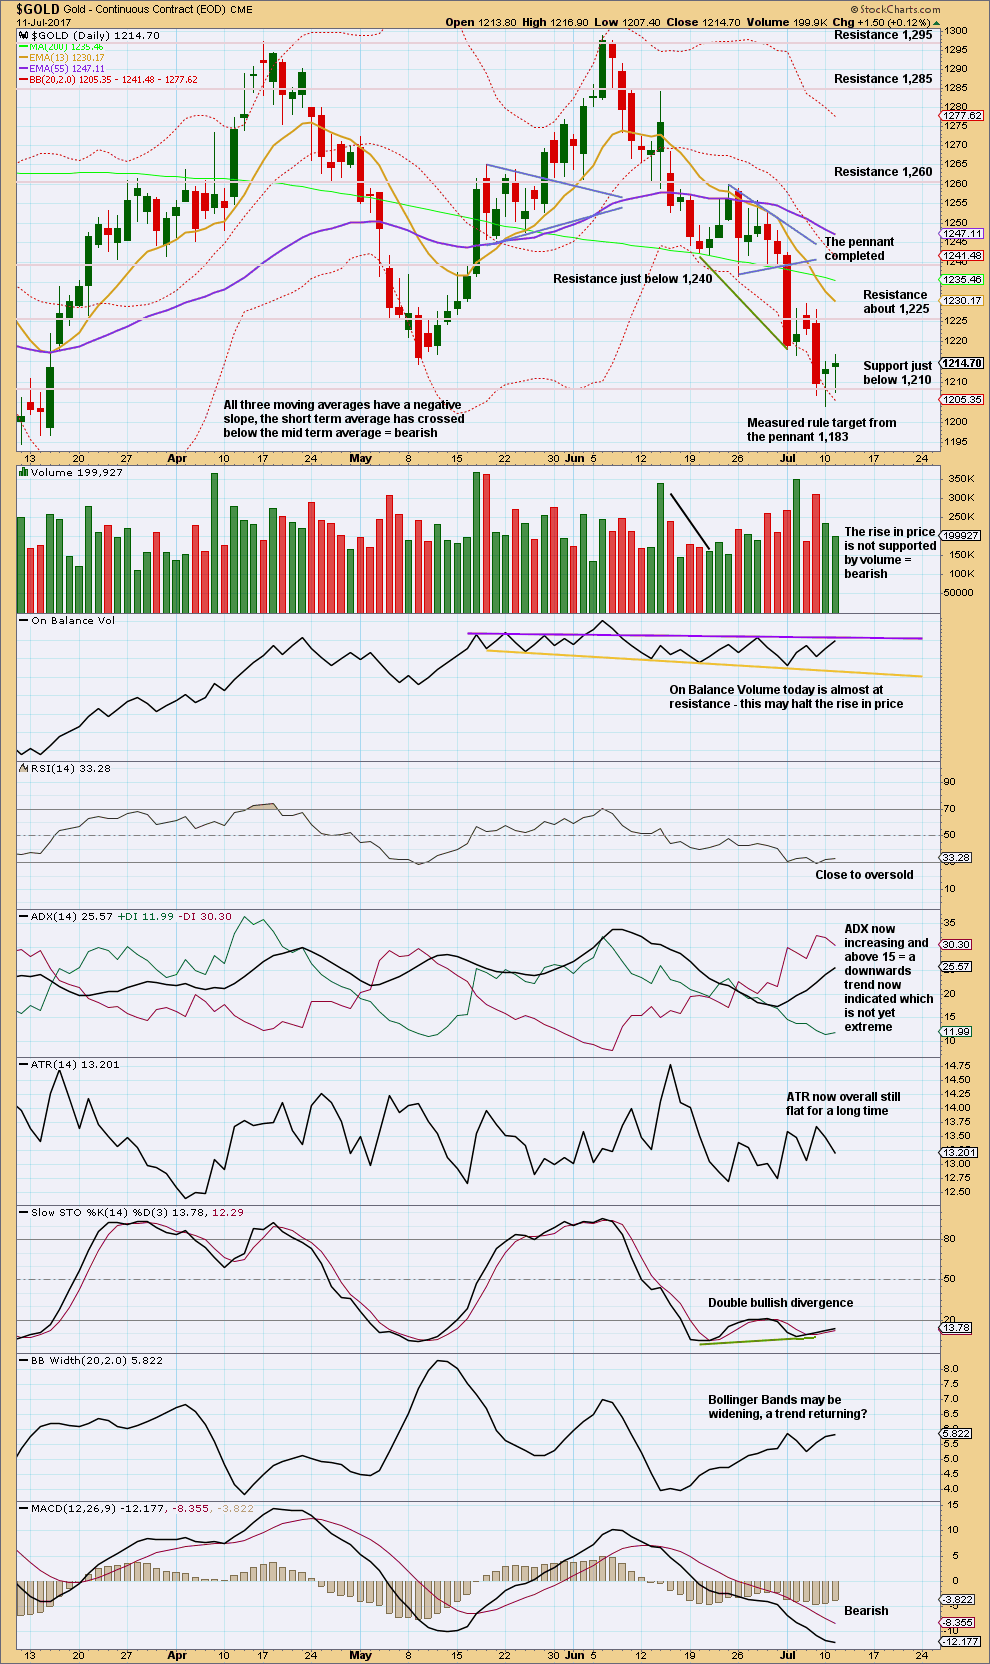
Long lower wicks on the last two daily candlesticks are looking bullish. I would expect this to be followed by more upwards movement.
Upwards movement does still look like a counter trend movement: candlestick bodies are small, volume is light and declining, and ATR is declining. But the candlestick wicks suggest the bounce is not over yet.
Candlestick wicks and Stochastics support the alternate hourly Elliott wave count.
However, On Balance Volume supports the main hourly Elliott wave count.
GDX
DAILY CHART
Click chart to enlarge. Chart courtesy of StockCharts.com.
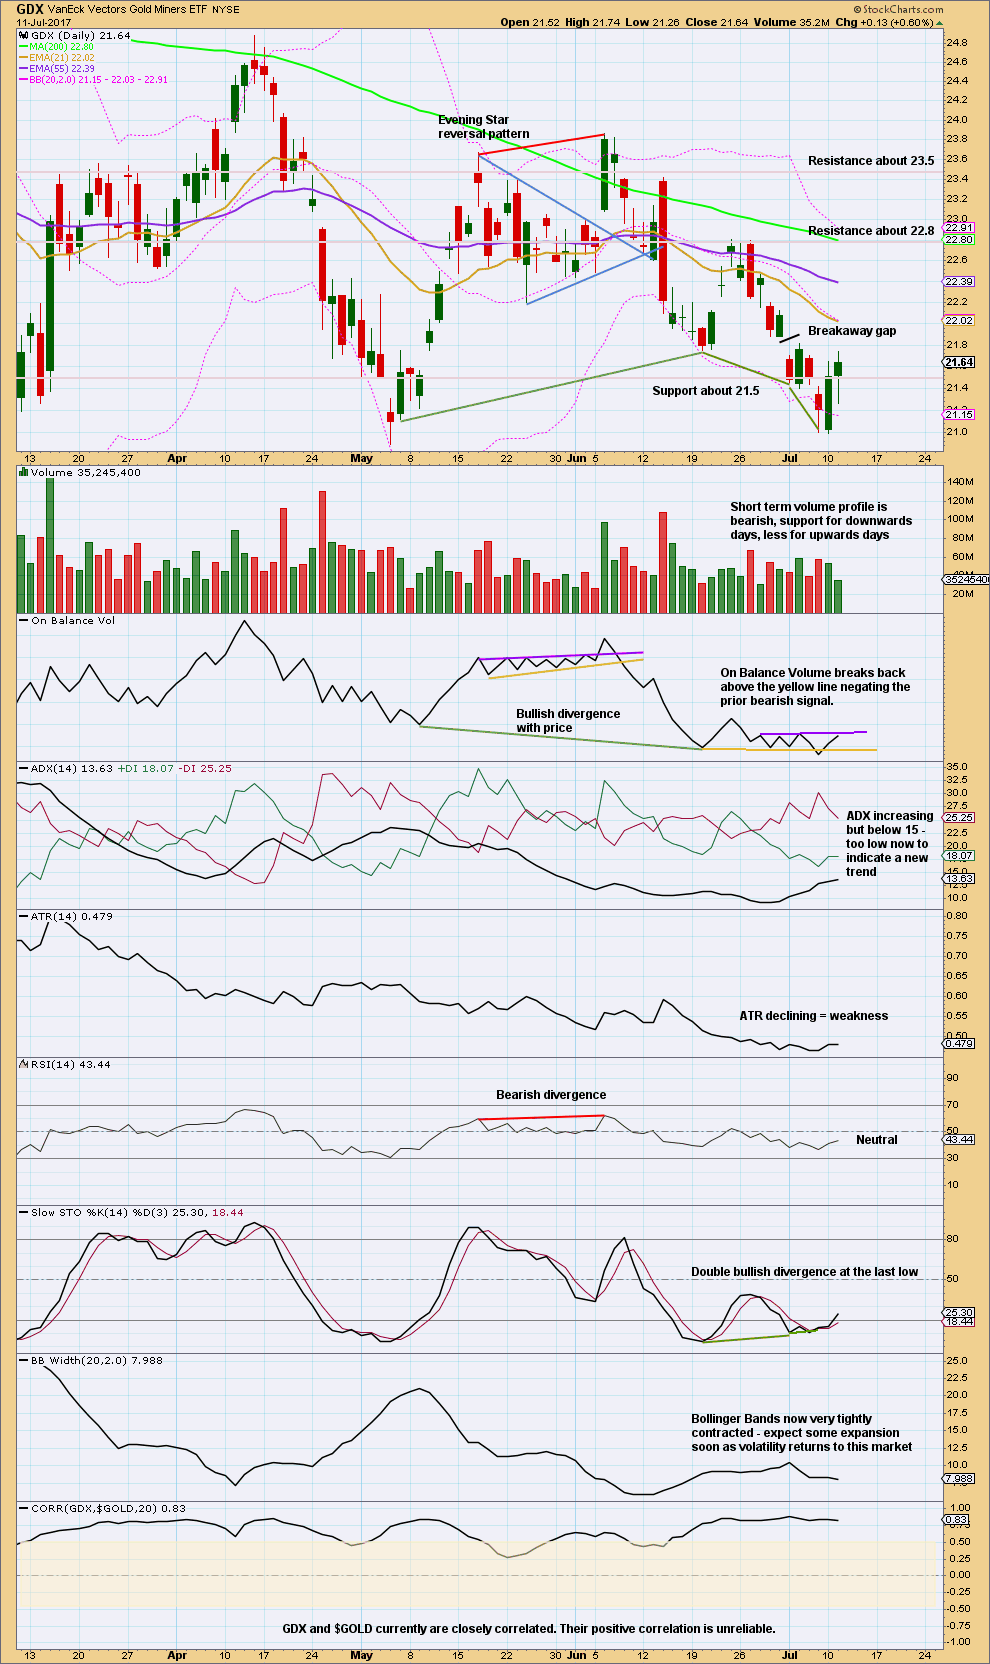
The last gap offers resistance at 21.88 if it is correctly labelled as a breakaway gap. Breakaway gaps should remain open.
The long lower wick on today’s candlestick is bullish; it looks like the bounce is not over. This upwards movement still looks like a counter trend bounce as it lacks support from volume.
A new resistance line is added today to On Balance Volume. This line has been tested three times, is not long, but it is almost horizontal. It offers some small technical significance, so the resistance line may halt the rise in price here. If it is breached, it would be a weak bullish signal.
This analysis is published @ 08:47 p.m. EST.

Looks like a cup an handle for oil. Now a move up to target?
Alan, can you please do an analysis on oil please. I’m having a hard time figuring out if this move up is done with, or we’re still going up more…
Please see oil comments thread…
Any other members input much welcome and appreciated 🙂
My chart would be exactly the same as yesterday for US Oil. No change from me. Still expecting the bounce to continue up to about 47.95.
Oil has one more C up for an abc corrective move I think. I have been back scaling into short positions after selling half at the last low.
Thanks everyone!
My apologies Ari. I was sleeping after the trading session. You know, day is night here in Singapore.
I agree with Lara’s target. Minimum rise will be 47.32 weekly bottom cloud boundary. There is a slight chance that the rise in price could get rejected there though. We are now in the C wave of a second wave. Price is slowly working its way up towards the price target. Once it reaches there, it will be a good shorting opportunity.
The main hourly wave count is invalidated by price, the alternate now has confidence. Now expect this bounce is very likely to end about 1,232, prior support should now be resistance.
From a classic TA POV this looks like a more leisurely curve back up to test resistance at prior support, before moving down and away.
We may have the perfect entry point for short positions coming up, maybe Friday. Be alert folks, or set orders. I’ll be setting one for about 1,229.
Stops above invalidation at 1,248.09 please. Adjust position size so you’re only risking 1-5% of equity with that stop in place.
Minor 2 looks like a double zigzag so far.
Thanks Lara. This chart is missing a few hourly candles to show today’s action, but you might have intended to just re-post the alternate.
Spot Gold finally triggered a buy signal from my perspective, albeit the earliest of signals. First target similar to yours, around 1235ish.
But Gold bulls are not out of the woods yet by any means. Lots of chart damage and resistance to overcome. And of course, the short term buy signal can also easily fail.
OMG I’m so sorry! Yes, wrong chart posted 🙁
And here I was feeling so pleased with myself that I posted a chart well before NY close for you all 🙁
NZDUSD has come up to touch that trend line folks. Anyone wanting to take a punt on the short side may like to jump in now. Stops just above the last swing high of the 30th of June please, invest only 1-5% of equity on this one trade. Manage risk, it’s the single most important aspect of trading.
USO has filled open gap from this morning…so far so good…
The run on short oil stops looks to have completed today. Picked up some cheap DRIP calls on this morning’s move up. A bit underwater on the last half of my USO 9.50 puts but hopefully that will change in the not-too-distant future… 🙂
Looks like stocks are the winner again, not gold…. at least so far
Gold likes Yellen’s statements so far. Let’s see if it has any legs
http://www.cnbc.com/2017/07/12/dovish-yellen-indicates-that-fed-may-not-need-to-hike-rates-much-more.html
Gold Daily Analysis
Data as at 6:00 am ET, July 12
=========================
Gold prices bounced higher than expected on Tuesday, breaching the channel resistance drawn by Lara when it reached 1220.46 very early this morning New York time. This could be the first sign of a possible reversal. A break above the region of the brown trendline (not shown), which was support turned resistance, will confirm the reversal. That the cloud is turning green adds fuel to this possibility. As such, bears would need to exercise some caution.
The 4-Hour Ichimoku Chart shows that gold prices remain below the kumo. The trend is still bearish. Although the tenkan-sen is still slightly below the kijun-sen, prices have risen above the two lines. The next target for a price rise will be the bottom cloud boundary at 1228.00. If prices manage to enter the cloud, it might reclaim the brown trendline resistance, followed by the 200 day SMA at 1235.46, and the top cloud boundary at 1238.05, before attacking the 50 day SMA at 1249.42 on the way up.
At the moment, we are not out of the woods yet. The downtrend could still continue, negating the valiant efforts of the bulls. A break below 1208.37, the beginning of Minuette Y, is all that is needed to negate the rally. The clear negativity of the 50 day SMA makes this mission simpler. But then, anything can happen. If you remember my report yesterday, I said it would take a miracle to get past 1220. Well, that miracle happened today. I would think that traders are treading water, waiting for Yellen’s testimony for more clues from the Fed regarding the upcoming future interest rate hikes, and especially the reduction quantum of the Fed balance sheet. The crowd sentiment reacting to Yellen’s testimony would be the short-term driver to direct the market. As Dreamer said, this market is getting difficult to analyse, and to trade.
On 6/30/17 it appears the dollar (DXY)
backtested the low ($95.46) on the breakout bar from bullish consolidation that occurred on October (monthly chart) of 2016.
This evening, so far, price reached a low of $95.53 on the hourly DXY.
It appears gold and oil are trading inverse to the dollar for the last night or so.
Either way $95.47 appears to be support for the dollar.
I’ve recorded and posted a video of the thinking process for developing today’s alternate here. For those members who are interested in it.
I’ve been waiting for Gold and GDX to throw us another curveball and this may be it. Starting to see some bullish signs, although signals are mixed.
GDX came within 2 cents of invalidating my hourly wave count. Bullish candles and bullish divergence are offset by bearish low volume for the last 2 up days.
If GDX follows through to the upside tomorrow, then the triangle on the weekly / daily chart may still be expanding and we may have just completed a leg down. Gold looks like it wants to move higher.
Bottom line – this is still a difficult market to analyze and trade.
https://www.tradingview.com/x/lVfVpBDI/
Just to follow up on Lara’s short nz dollar position, the commercials added another 4K plus to their short position and now have about a 6 to 1 short to long stand.
While it is true the commercials are covering their short positions and may be close to net positions held during the Jan 2016 low, there has not been a strong uptick in volume from the gold stocks during this slight move up. This is concerning. Also concerning is that the commercials covered their dollar shorts a few weeks back. This may coincide with a stock market rally and a further swoon or some back and forth with gold for a bit. I’d like to see the dollar short position increase on the commercial side in tandem with gold shorts being closed before gold has some real legs, imo.