
Last analysis expected a new low to 15.17 before a trend change. There was no new low, but there has been a bounce.
Summary: Upwards movement should continue to about 17.30 in the first instance. However, weakness in volume and range does not support the new upwards wave, so it is essential that stops are used and risk is managed if trading this to the long side.
New updates to this analysis are in bold.
Last monthly chart is here.
ELLIOTT WAVE COUNTS
FIRST WAVE COUNT
WEEKLY CHART
Click chart to enlarge.
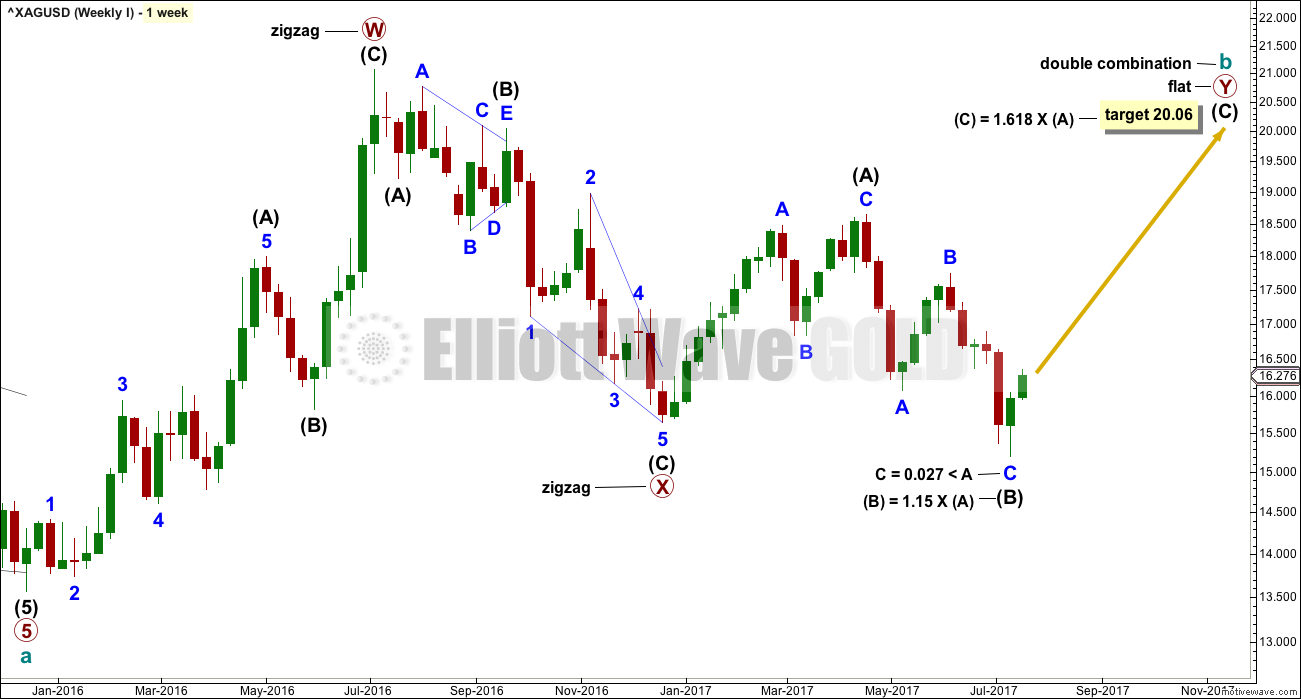
Cycle wave b may be completing as a double combination: zigzag – X – flat. The second structure, a flat correction for primary wave Y, may be underway.
Within a flat correction, intermediate wave (B) must retrace a minimum 0.9 length of intermediate wave (A) at 15.938. Intermediate wave (B) has met this minimum requirement; the rule for a flat correction is met. Intermediate wave (B) is longer than 1.05 times the length of intermediate wave (A) indicating this may be an expanded flat. Expanded flat corrections are the most common type. Normally their C waves are 1.618 or 2.618 the length of their A waves.
The target calculated would see primary wave Y to end close to same level as primary wave W about 21.062. The purpose of combinations is to take up time and move price sideways. To achieve this purpose the second structure in the double normally ends about the same level as the first.
While the combination wave count at the weekly chart level does not currently work for Gold, it does still work for Silver. They do not have to complete the same structures for cycle wave b, and fairly often their structures are different.
DAILY CHART
Click chart to enlarge.
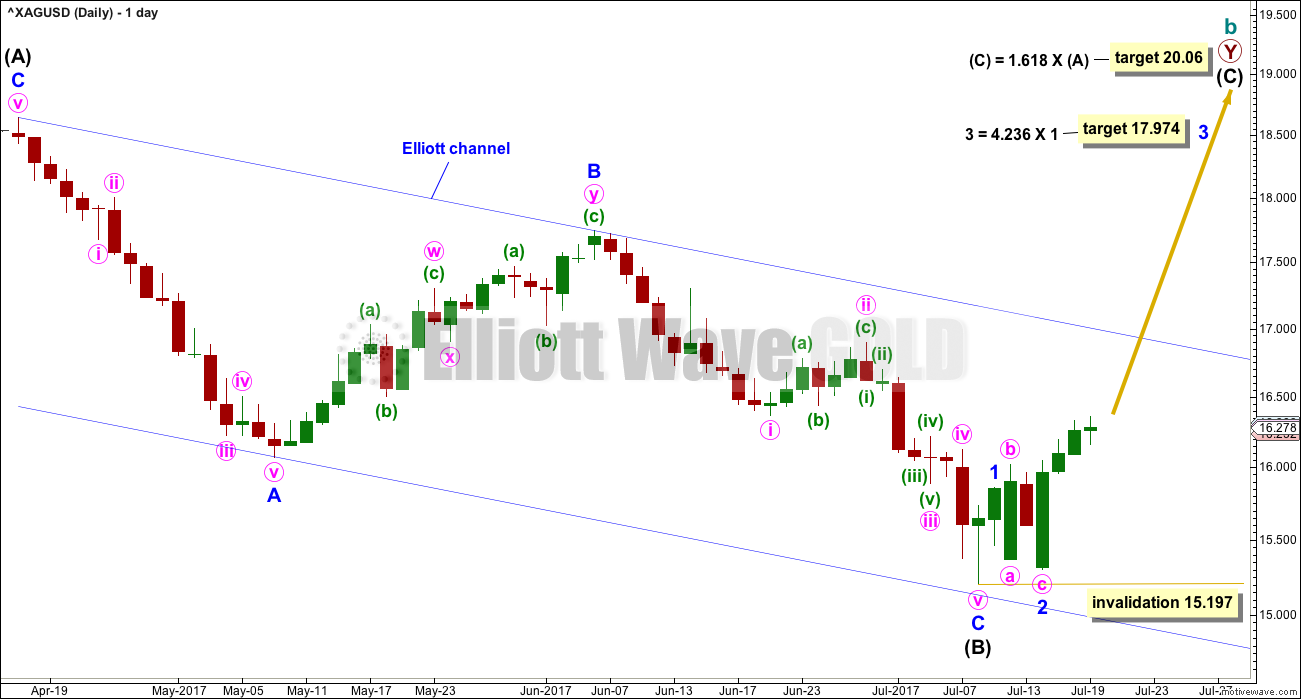
Intermediate wave (B) may now be a completed zigzag subdividing 5-3-5.
When the blue channel about intermediate wave (B) is breached by upwards movement, that shall add confidence in a trend change. Along the way up, the upper edge may provide some resistance.
SECOND WAVE COUNT
WEEKLY CHART
Click chart to enlarge.
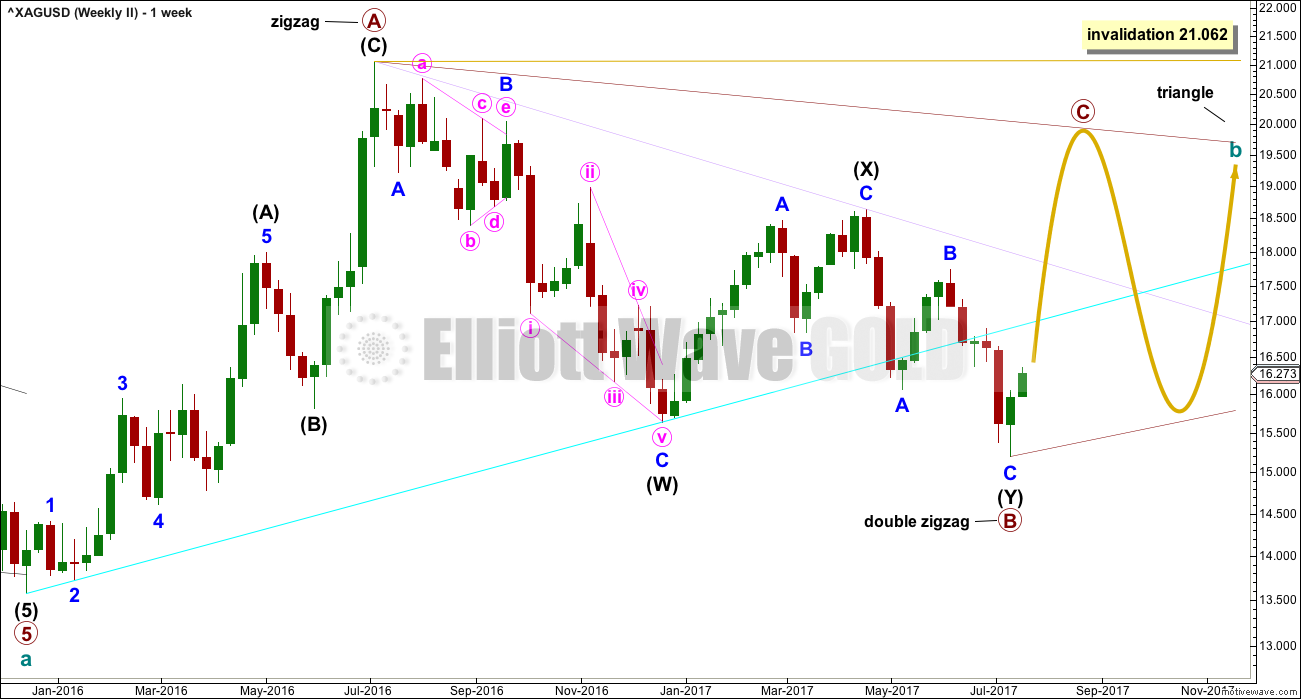
Within a triangle, one of the sub-waves must be a more complicated multiple, usually a multiple zigzag. This may be complete for primary wave B.
Primary wave C upwards should unfold as a single zigzag that may not move beyond the end of primary wave A above 21.062. The A-C trend line is adjusted this week to see primary wave C reach a more normal length in relation to primary wave B. Along the way up, price may find some resistance at the lilac trend line.
DAILY CHART
Click chart to enlarge.
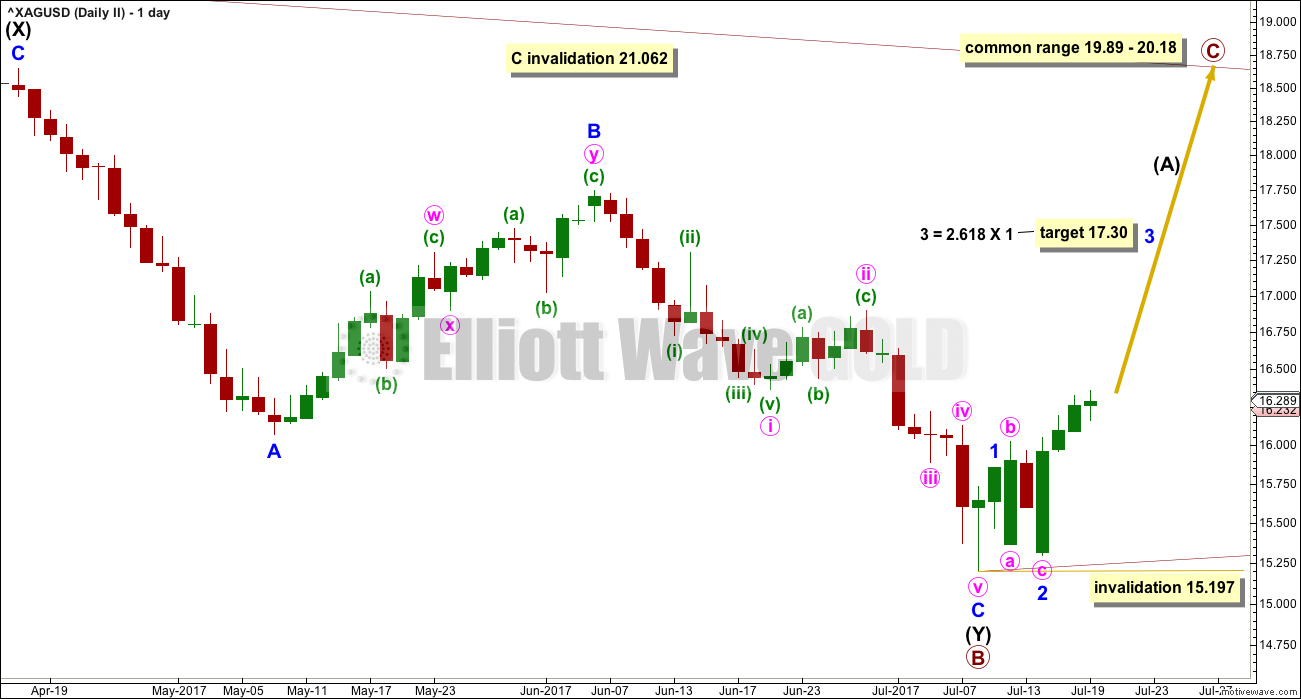
This wave count expects a shorter upwards wave than the first wave count.
TECHNICAL ANALYSIS
WEEKLY CHART
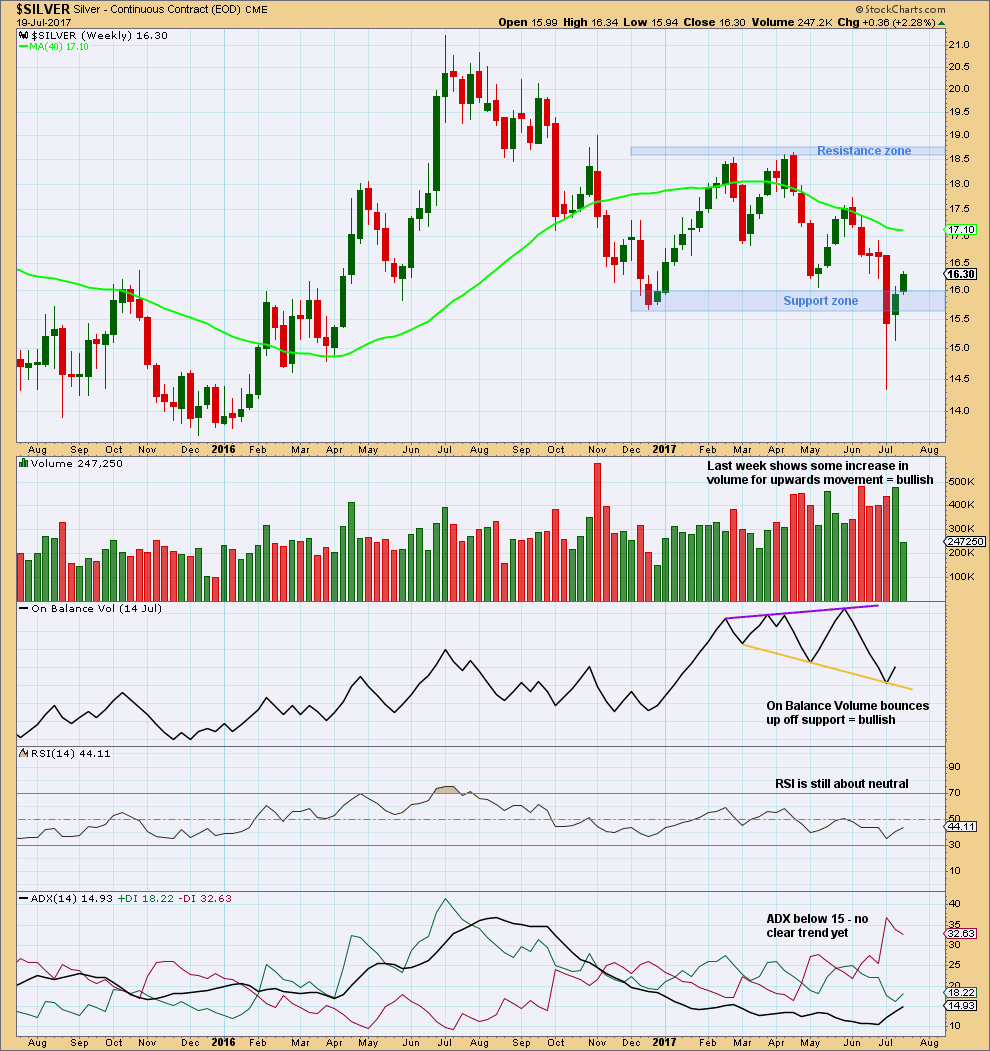
Click chart to enlarge. Chart courtesy of StockCharts.com.
After what looked like a downwards breakout out of the consolidation zone, price has quickly reversed and re-entered the zone.
Long lower wicks on the last two weekly candlesticks are bullish.
DAILY CHART
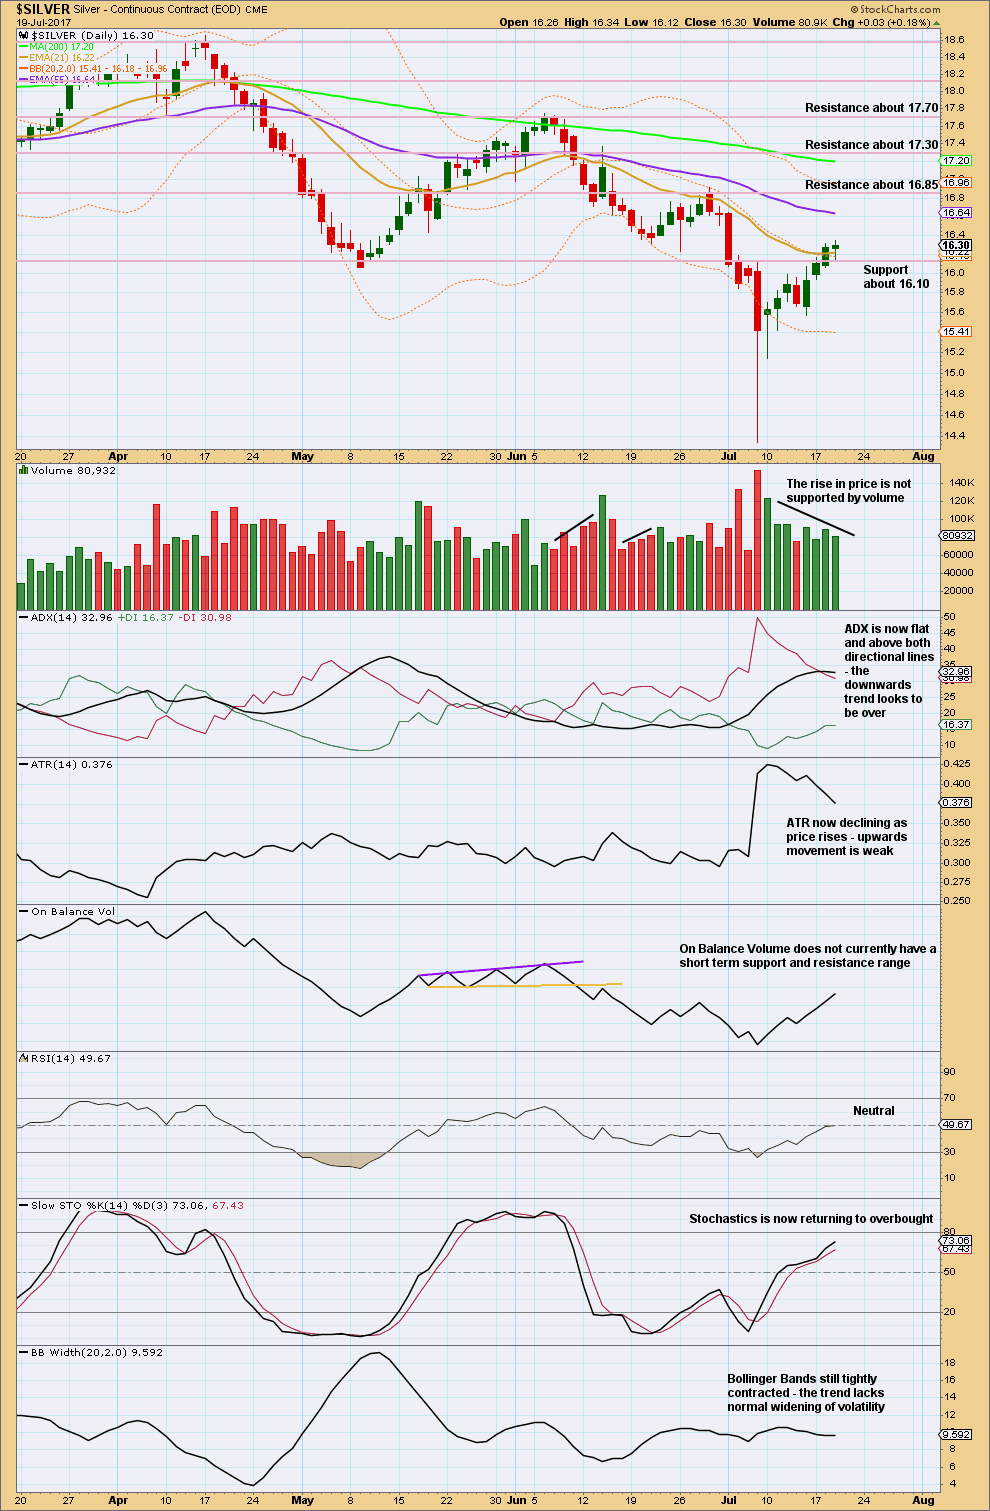
Click chart to enlarge. Chart courtesy of StockCharts.com.
Upwards movement lacks support from volume, and decreasing range and volatility. This movement looks weak.
Next resistance is about 16.85.
This analysis is published @ 10:03 p.m. EST.