Short positions were exited for a profit when price breached a channel. Now a deep bounce is underway exactly as expected.
Summary: The bounce looks incomplete. If price comes up to touch the pink base channel on the daily chart, then enter short there. Stops should be just above 52.00. Invest only 1-5% of equity on any one trade.
New updates to this analysis are in bold.
MONTHLY ELLIOTT WAVE COUNT
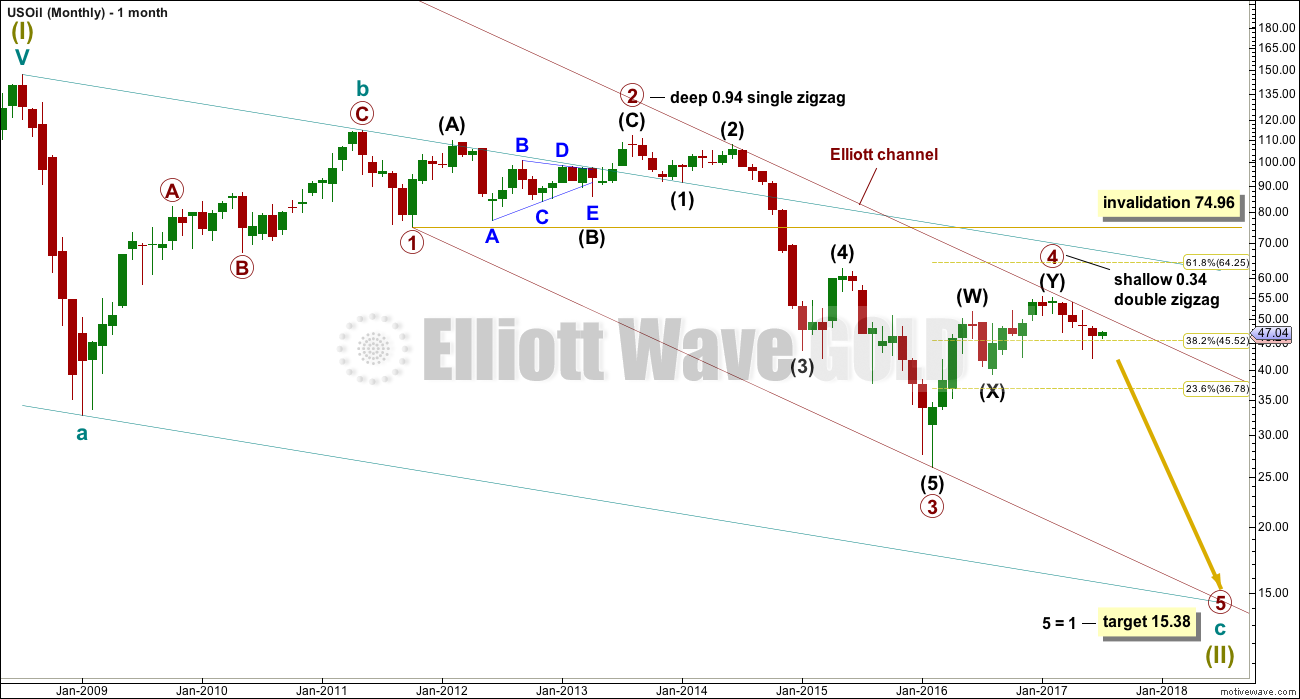
Within the bear market, cycle wave b is seen as ending in May 2011. Thereafter, a five wave structure downwards for cycle wave c begins.
Primary wave 1 is a short impulse lasting five months. Primary wave 2 is a very deep 0.94 zigzag lasting 22 months. Primary wave 3 is a complete impulse with no Fibonacci ratio to primary wave 1. It lasted 30 months.
The main wave count this week is changed to see primary wave 4 complete. I have been concerned for some time about the expected large breach of the maroon best fit channel on the monthly chart that would be required for primary wave 4 to continue as an expanded flat. The upper edge of this channel is providing very strong resistance. While price remains below it, my conclusion is that it looks best if primary wave 4 is over.
There is alternation in depth with primary wave 2 very deep and primary wave 4 shallow. There is inadequate alternation in structure, both are of the zigzag family, but there is some alternation within structure. Primary wave 2 is a single zigzag and the triangle for intermediate wave (B) gives it a sideways look. Primary wave 4 is a sharper and quicker double zigzag.
If it continues as per the alternate, then primary wave 4 may not move into primary wave 1 price territory above 74.96.
This change to the wave count this week makes no difference to expected direction nor to short term targets. It makes a material difference though to the final target.
WEEKLY ELLIOTT WAVE COUNT
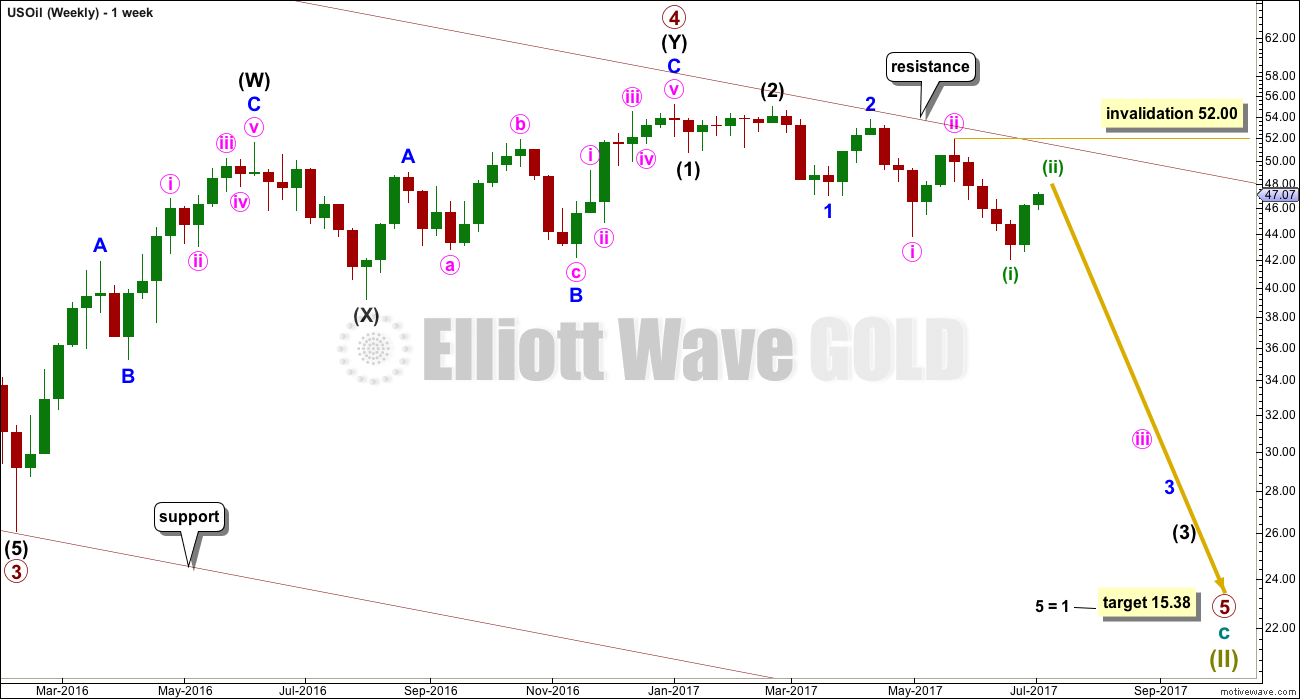
Primary wave 5 looks like it may beginning very typically with a series of overlapping first and second waves. The third wave within it looks to be extending. It should be expected that within one or more of these third waves that their fifth waves may be very strong and sharp, ending with selling climaxes typical of commodities.
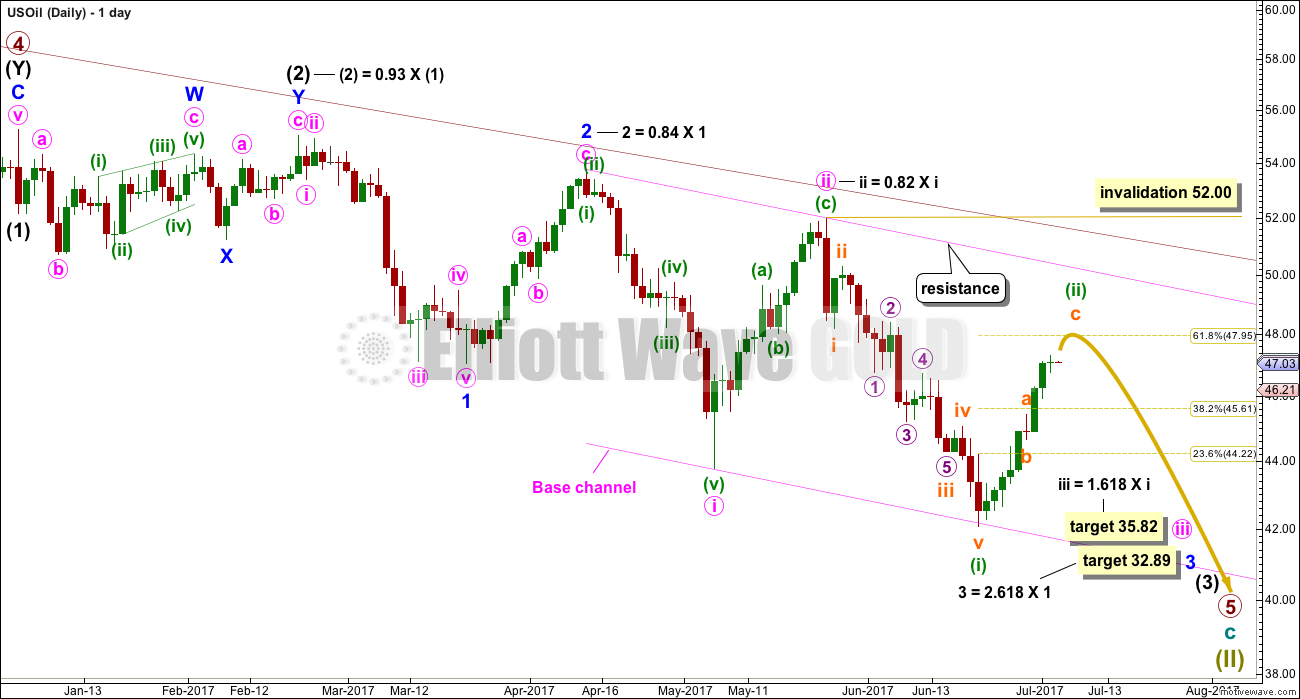
If minuette wave (ii) is another very deep correction, then it should find final very strong resistance at the upper edge of the maroon channel which is copied over from the monthly chart.
Minuette wave (ii) may not move beyond the start of minuette wave (i) above 52.00.
DAILY ELLIOTT WAVE COUNT
Primary wave 5 must subdivide as a five wave motive structure, either an impulse or an ending diagonal. With the overlapping of first and second waves so far, it looks very much like the more common impulse may be unfolding.
My only concern today is labelling within minuette wave (ii). It may be that subminuette wave a is incomplete. Here, subminuette wave b looks to be remarkably brief.
Minuette wave (ii) looks to be still incomplete. Expect it to end at the 0.618 Fibonacci ratio, at minimum, or quite likely deeper than that. It may come up to find resistance and end at the upper edge of the pink base channel. If price does come up to touch that trend line, members are advised to enter short there, with a stop just above 52.00. Invest only 1-5% of equity on any one trade.
Members are advised to continue to exert patience over the next week or so while we wait for minuette wave (ii) to show us that it is over. Any update on a short entry will be posted in comments here on US Oil analysis.
ALTERNATE WEEKLY ELLIOTT WAVE COUNT
This wave count has been the main wave count up until this week. It is now relegated to a less likely alternate.
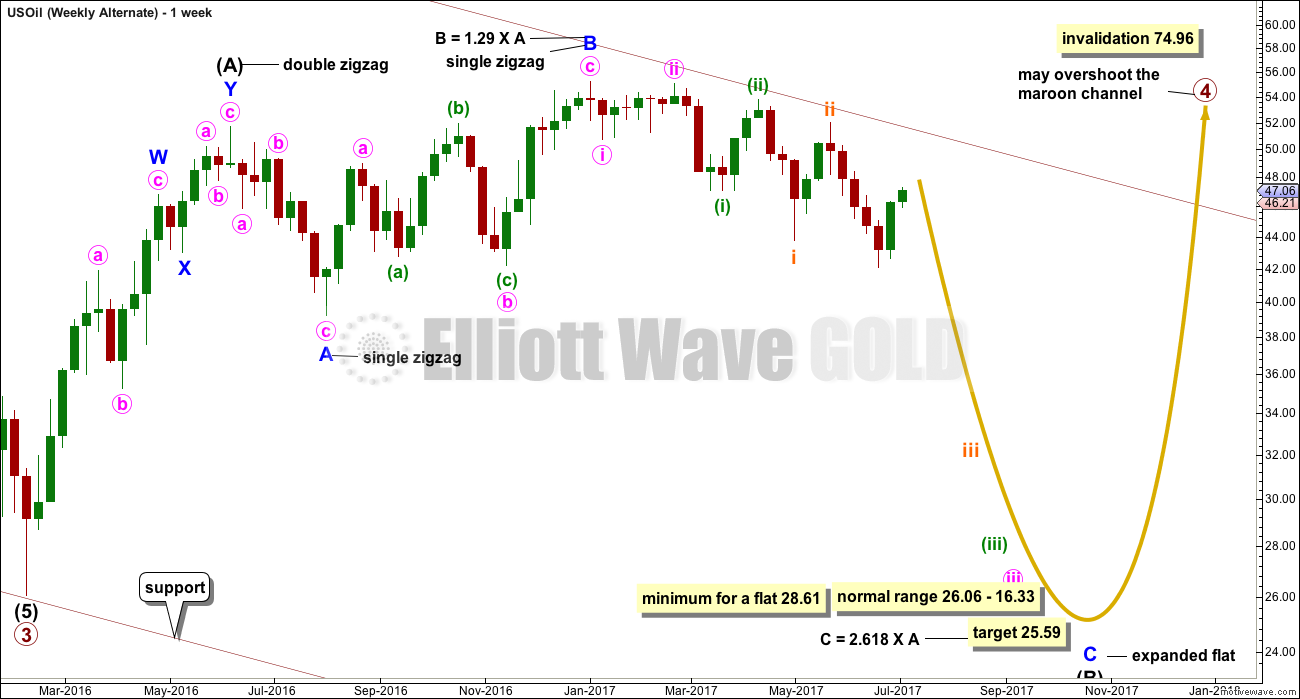
The whole structure of primary wave 4 is seen here in more detail.
The first wave labelled intermediate wave (A) is seen as a double zigzag, which is classified as a three.
Intermediate wave (B) is also a three. This means primary wave 4 is most likely unfolding as a flat correction if my analysis of intermediate wave (A) is correct. Flats are very common structures.
Intermediate wave (B) began with a zigzag downwards. This indicates it too is unfolding most likely as a flat correction.
Within intermediate wave (B), the zigzag upwards for minor wave B is a 1.29 correction of minor wave A. This indicates intermediate wave (B) may be unfolding as an expanded flat, the most common type.
The normal range for intermediate wave (B) within a flat correction for primary wave 4 is from 1 to 1.38 the length of intermediate wave (A) giving a range from 26.06 to 16.33.
Primary wave 4 may not move into primary wave 1 price territory above 74.96.
Within the larger expanded flat correction of primary wave 4, intermediate wave (B) must retrace a minimum 0.9 length of intermediate wave (A) at 28.61 or below.
DAILY ELLIOTT WAVE COUNT
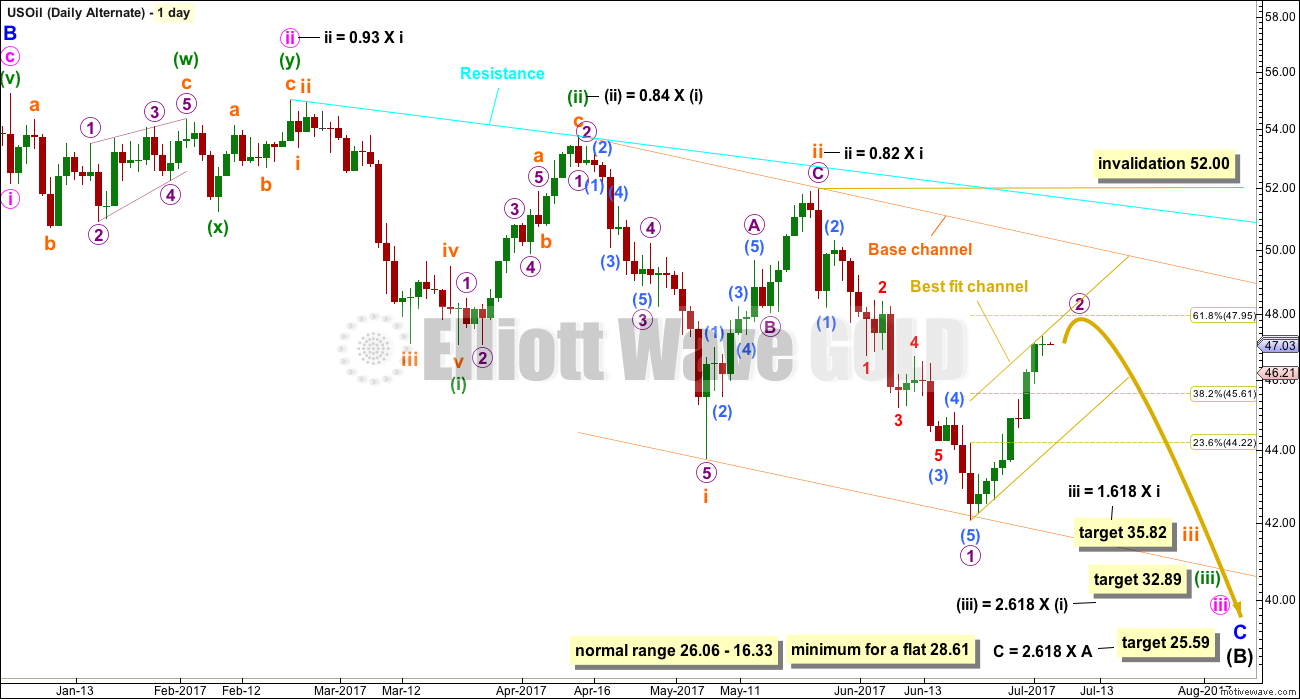
Minor wave C downwards must subdivide as a five wave structure.
So far now there would be four overlapping first and second waves within this wave count.
When third waves extend, as this one is, they necessarily begin with a series of overlapping first and second waves. Third wave extensions are extended in both price and time, and they show lower degree corrections within them on higher time frames. This one so far looks like a normal start to a third wave.
TECHNICAL ANALYSIS
DAILY CHART
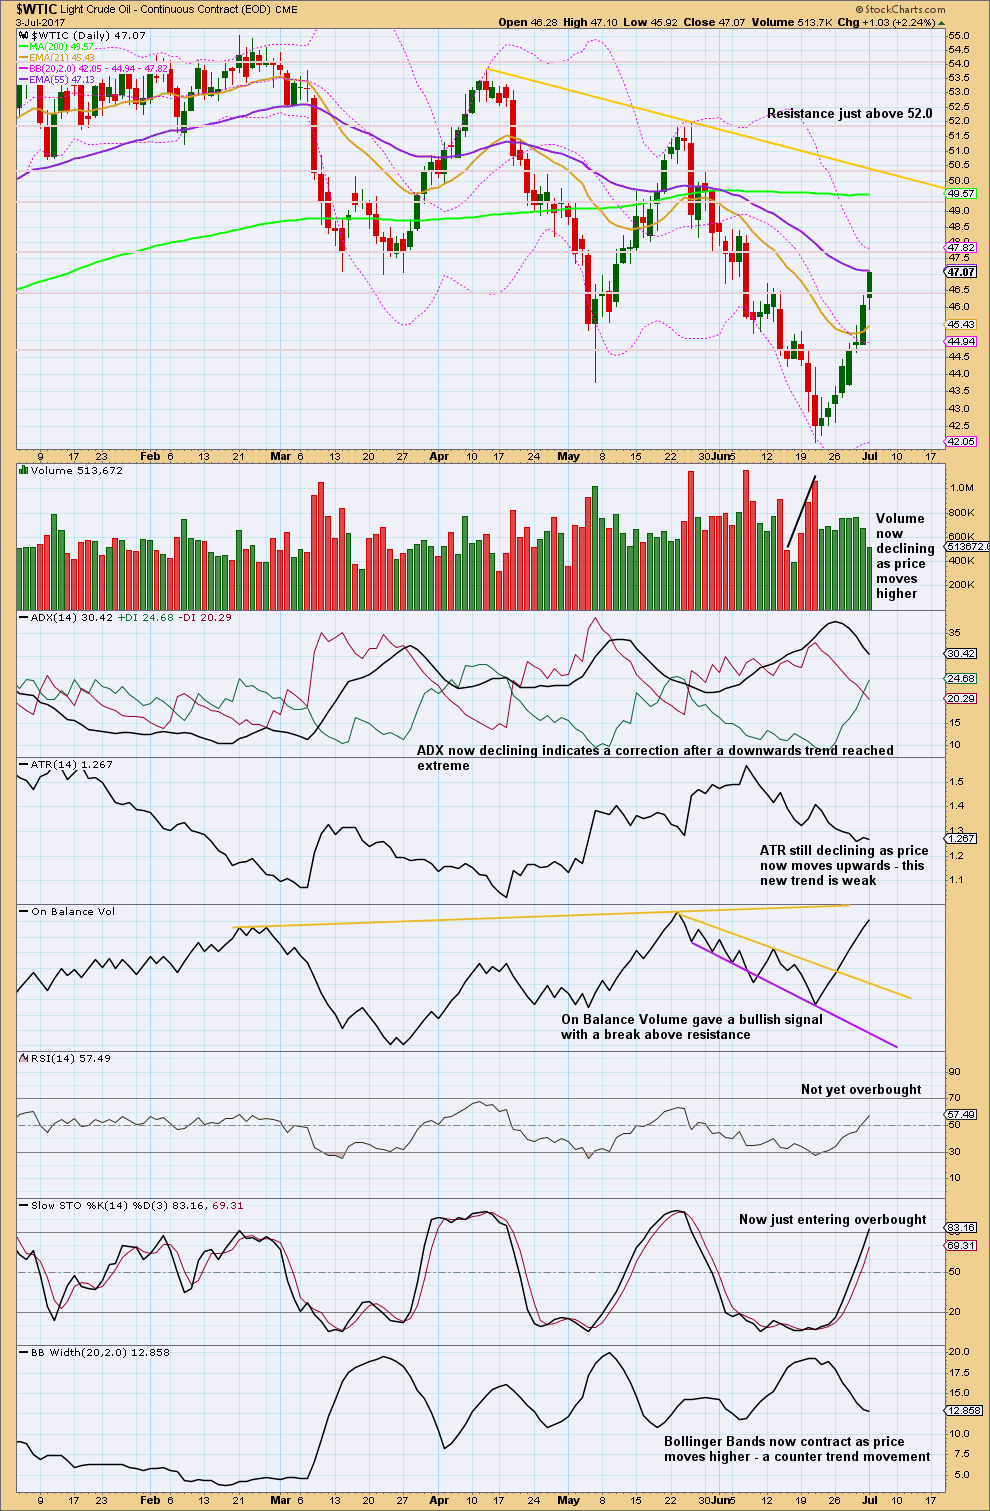
Click chart to enlarge. Chart courtesy of StockCharts.com.
A resistance line is changed this week to show possible resistance for this bounce.
So far price has been making a series of lower lows and lower highs since the high in February 2017. This is the definition of downwards movement. The corrections are extreme.
Although volume is declining as price rises that does not mean the bounce must end here. Price can continue to drift higher on light volume for another week or two.
A new resistance line is added this week to On Balance Volume. There is some distance to go before it is reached.
Stochastics can remain extreme for a reasonable period of time, even during a counter trend bounce. Just because Stochastics is now entering overbought does not mean the bounce must end here.
ADX, ATR and Bollinger Bands all agree that upwards movement for price looks like a counter trend bounce.
VOLATILITY INDEX
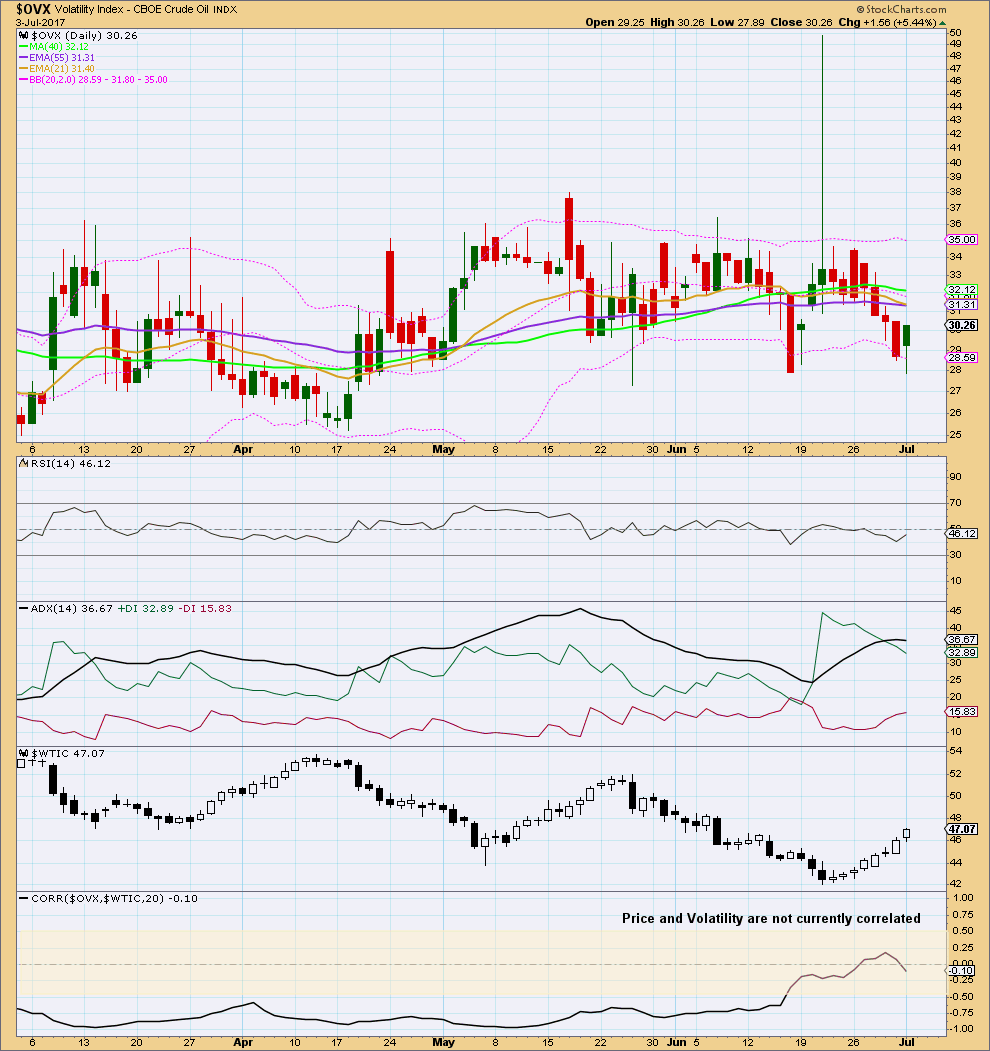
Click chart to enlarge. Chart courtesy of StockCharts.com.
Normally, volatility should decline as price rises and volatility should increase as price falls. Divergence from this normal can provide a bullish or bearish signal for Oil. However, it is noted that this signal occurs both in minor and major lows and it cannot be used to distinguish between them.
At this time, volatility and price do not have a negative correlation. Volatility cannot be used at this time to signal if a low is in place or not.
This analysis is published @ 07:32 p.m. EST.

This comment was posted in Gold, and is reproduced below.
==============================================
Oil is currently undergoing a pullback in subminuette 2, targeting 45.50 – 46.00. I have exited at today’s low and is waiting for the pullback to end before going in again. Subminuette 3 should be a $6 to $7 drop.
When trading with leveraged ETFs, and I use SCO, it pays to take money off the table whenever possible. These creatures are a darling when the trend is right, but a scourge when it is not.
Hi Alan…what r your thoughts here?
I think oil is currently in the 4th wave triangle of the C wave. Once the triangle ends, the 5th wave will complete the upward correction, and we can short once again.
US Oil Ichimoku Update
Data as at market close, July 6
=========================
Oil price rallied strongly for 8 consecutive days from a low of 42.05 to a high of 47.32 on Wednesday. The market then quickly tumbled to a low of 44.51 before rising to a second high at 46.53 yesterday following the EIA oil inventory release. Oil price had dropped ever since.
The price rise to the high of 46.53 broke the 46.17 kijun-sen resistance, but failed to test yesterday’s 50 day SMA at 47.07. After falling back below 46.17, resistance turned support, which incidentally failed, I placed a small short on US Oil.
I am planning to add on to my position when price drops below:
(1) 44.92, tenkan-sen support; and
(2) 44.51. Yesterday’s high at 46.53, together with Wednesday’s high at 47.32, form a double top. The lowest point between the two highs was 44.51. Classic double top analysis calls for a confirmation of a further drop below that low.
My bridge playing days have taught me that when everything appears to be going my way, that is the time to look out for pitfalls. So, what are the dangers? Yesterday’s candlestick is something like a harami. It smacks of indecision. Price may yet rise again today. The danger signals are a break of the kijun-sen at 45.88 followed by the 50 day SMA at 46.99. I’ll use 45.88 as the stop for yesterday’s trade.
However, it sometimes pays to be optimistic. The cloud is turning menacingly red soon so there’s no doubt that prices will drop further in the future. A sustained price rise could only happen, I think, if a full-blown war erupts.
Thanks for sharing Alan. This is really good stuff.
Thanks Vince. The pleasure’s mine. Glad you like it.
Volume strongly supported the strong downwards day of 5th July. This does not look like a B wave. B waves should be weak. While it could still be wave B within an ongoing zigzag, I’m leaning towards the zigzag being over now.
Stochastics just reached overbought with this bounce. No divergence. It could remain overbought for a while.
But this is a lower degree second wave. So corrections may not be as deep as prior second waves.
A small yellow best fit channel is drawn about minuette (ii). It’s now being overshot by downwards movement. It looks like it may be breached.
Now, if it is then I’d be reasonably confident of entering short with a stop just above the high of the 4th of July.
I’m confident enough here to enter short now myself, albeit I’m reducing my risk to less than 3% of equity. I could be wrong and I want the loss contained and manageable.
Thanks Lara. A timely update, I must say. I am of the same opinion.
Lara and Alan, Oil is already down 2%. I am considering shorting the Oil – Is it reasonable to expect that Oil will at least test the last low of 42?
Yes. I would say a test, rebound, followed by a drop.
The reason for my response is based on the double top.
Highest point = average (46.53, 47.32) = 46.925
Lowest point = 44.51
Drop value = (46.925 – 44.51) = 2.415
Drop target = 44.51 – 2.415 = 42.095
Thank you Alan. Just curious- are you in the US?
Kyong. I’m in Singapore. So, technically, I’m a night trader. Hee hee.
Judging from your last name, would you be in Korea? Or maybe the US?
Wow! I am a Korean living in US. Again, thank you for your support.
DRIP on the move. Interestingly enough USO also up today.
Thank you Alan and Dreamer for the information below. Looks like somewhere between 46.17 and 47 is a good spot to add/start short position… let’s see what happens.
I’m going to guess we’ll get a spike immediately after the EIA data release with a reversal afterward…
I’ll 2nd that!
Thanks, Alan and Dreamer!
Your work is much appreciated.
I guess it worked just as I had hoped 🙂
The correction up looks like a 3-3-5 wave structure, so hopefully that was it and we’re on our way down…
And we have very nice upper wick and a red candle today also…
US Oil Ichimoku Analysis
Data as at market close, July 5
=========================
Oil price rallied for 8 consecutive days from 42.05 to a high of 47.32 on Wednesday. The market then quickly tumbled to a low of 44.51. After the market close, prices quickly recovered and had been trading sideways ever since.
The question is: has 47.32 been all there is to minuette 2 in the Main Count (micro 2 in the Alternate)? Or is the second wave an ABC, with 47.32 being only the A wave and the drop towards 44.51 being the B wave?
Now, 47.32 is a wee bit larger than the 0.50 retrace from 42.05 towards the previous high of 52.00. At mid-price, it is difficult to determine the future movement. Of course, if price does break above 47.32, then the ABC scenario is correct. And, if price breaks down below 42.05, then the second wave is already over.
What is the likelihood of each possibility? If prices rise further, resistance will be in the form of 46.17 kijun-sen resistance, followed by the 50 day SMA at 47.07. Only if these two are cleared could prices retest yesterday’s high of 47.32, and if this is also overcome, then the bottom cloud resistance near 48.80 should be the final stop. The cloud is turning menacingly red soon so there’s no doubt that prices will find great difficulty in breaking above the cloud. On the other hand, a down move has only got tenkan-sen support at 44.79 to overcome. The 5-day RSI would have risen slightly above the 50.18 value at market close, indicating a rebound off the 50-mark, a mildly bullish sign. The MACD histogram is turning slightly down, taking the opposite view.
On balance, I think that the easier path for oil to follow is down. To be on the safe side, I would be waiting to see if oil can break above the three resistance barriers to determine an entry point: 46.17, 47.07, and 47.32. Rejection from any one of these increases the chances of a top being in place. This short trade is extremely lucrative, with an eventual target of 25.59 (Alternate Count), and better yet, 15.40 for the Main Count. I’m sure many of us are eagerly waiting to pounce on this short. A little patience is perhaps the best insurance against any miscue.
It looks like SC has volume now for July 5 and it’s very high for a down day. This may mean that Minuette 2 is complete. Oil is now correcting back up, but this could end today or tomorrow, likely somewhere above 46. This could be a good place to start or add to shorts or you could wait for more guidance from Lara. Good luck!
Imo 2 looks over, and I have gone short. But is 2 too short?
As I had expected, something was going to raise the oil price after the big drop today, and sure enough API reported a big inventory draw… oil up now about 1.4% after hours.
The question now is: is minuette (ii) complete, and now we’re in another 1/2 wave down and up; or this upcoming rise in price is subminuette c of minuette (ii)?
Luckily, I have Lara, Dreamer, and Alan on my side to secifer this situation 🙂
Unluckily StockCharts have no updated data yet for US Oil 🙁
As soon as they do, I’ll post some analysis here for today’s move.
What an amazing day in Crude Short Country:) Cashed in on my shorts (ETN Down x12) today, but could acquire new ones tomorrow, if this continues. Thanks, Lara, for giving us confidence in the down trend, when most people out there thought it was a “real” come back for oil on its way to $60 – and not just a deep bounce. EW at its best!
Glad you’re happy. That’s my goal. Happy members and lots of profits.
While the downwards move looked really good and strong, it’s since bounced up strongly too. The reaction is swift.
Wait for some analysis of todays move before assuming the next downwards wave has begun.
It could be wave B. Or it could be the next big wave down.
Thanks, will do!
The strength of this downwards move looks like minuette (ii) may have been over more quickly than I expected. When StockCharts have data finalised I’ll post an updated chart. Lets see what volume, On Balance Volume and the rest have to say.
Wow, $15 oil would be amazing and with this new count we may get there pretty quick!
That’s going to put a lot of pressure on world finances with so many countries depending on oil revenue and I would assume a huge stock correction. 📉
Today’s sharp drop in oil may just be subminuette b in the making. When Minuette 2 is complete, the move down may be very strong.
Add to oil historical since the count changed?
What do you think? Is 2 over yet?
I’m going with subminuette b for now
I sure hope it is subminuette b Dreamer. I openened 1/3 of my short position on Monday… hope this goes back up to open the rest.
Copper also having a nice move down today 🙂
Good idea, thanks Dreamer. Will add to historical category too.
Well, Venezuela is already a mess. And more poverty in the Middle Eastern countries that have oil isn’t going to be exactly stabilising in an already unstable area.
This is not going to look pretty 🙁