Another red daily candlestick has printed as expected, but price continues to move sideways and not lower.
Summary: Assume the trend remains the same until proven otherwise. Assume the larger bear market remains intact while price remains below the bear market trend line.
If the Magee trend line is breached by one or two full daily candlesticks above it, then the alternate wave count would be preferred. On Balance Volume today warns the alternate may be correct.
New updates to this analysis are in bold.
Last monthly charts for the main wave count are here, another monthly alternate is here, and video is here.
Grand SuperCycle analysis is here.
MAIN ELLIOTT WAVE COUNT
WEEKLY CHART
The Magee bear market trend line is added to the weekly charts. This cyan line is drawn from the all time high for Gold on the 6th of September, 2011, to the first major swing high within the following bear market on the 5th of October, 2012. This line should provide strong resistance.
To use this trend line in the way Magee describes, we should assume that price will find resistance at the line if it gets back up there. If the line is breached (by at least one or two full daily candlesticks above it), it will be signalling a major trend change from bear to bull. At that point the alternate Elliott wave count should be preferred.
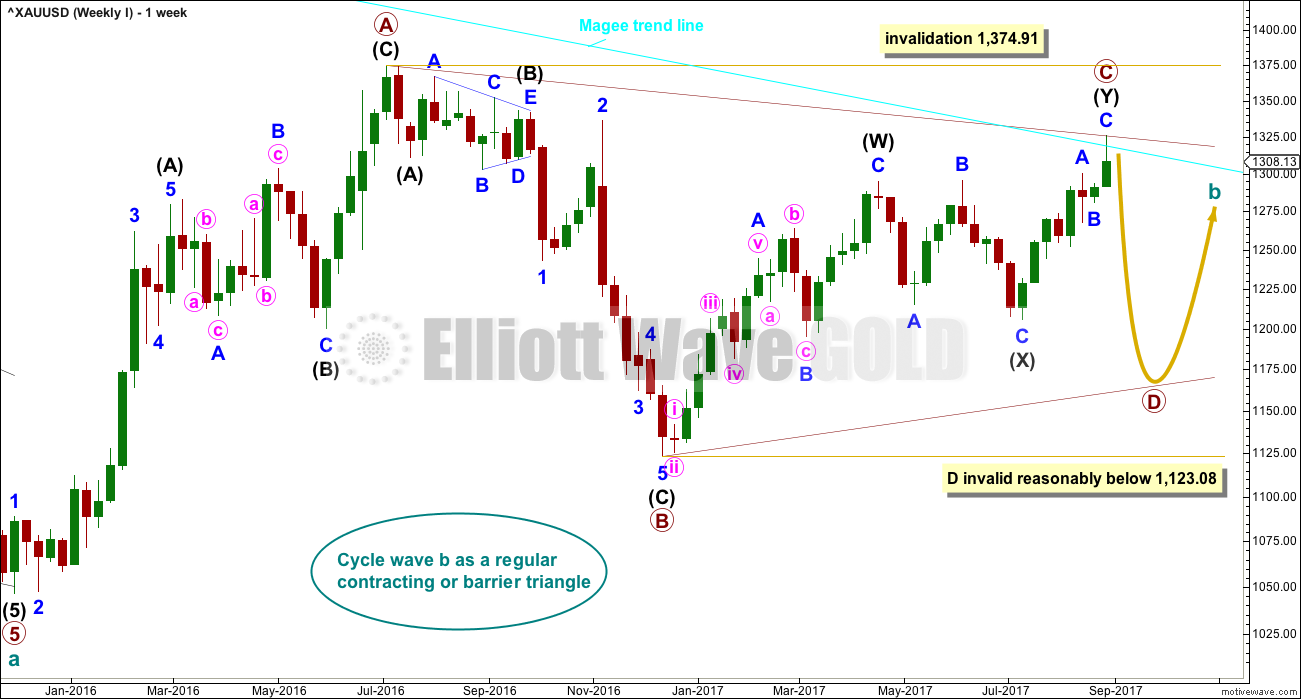
At this stage, a triangle still looks possible and has the best fit for cycle wave b. It has strong support now from declining ATR and MACD hovering about zero.
Within a triangle, one sub-wave should be a more complicated multiple, which may be primary wave C. This is the most common sub-wave of the triangle to subdivide into a multiple.
Intermediate wave (Y) now looks like a developing zigzag at the weekly chart level, and minor wave B within it shows up with one red weekly candlestick.
Primary wave C may have ended at the Magee trend line. At this stage, price has closed back well below the line, so the overshoot is acceptable. For the line to be breached one or two full daily candlesticks need to close above the line and not be touching the line.
Note: The Magee trend line is sitting slightly differently on the main daily chart to the weekly charts. The weekly charts show a small overshoot, but the daily chart shows price exactly touched the line. The line is drawn from exactly the same price points and all charts are on a semi-log scale. The difference is in how Motive Wave formats the primary chart.
Primary wave D of a contracting triangle may not move beyond the end of primary wave B below 1,123.08. Contracting triangles are the most common variety.
Primary wave D of a barrier triangle should end about the same level as primary wave B at 1,123.08, so that the B-D trend line remains essentially flat. This involves some subjectivity; price may move slightly below 1,123.08 and the triangle wave count may remain valid. This is the only Elliott wave rule which is not black and white.
Finally, primary wave E of a contracting or barrier triangle may not move beyond the end of primary wave C above 1,295.65. Primary wave E would most likely fall short of the A-C trend line. But if it does not end there, then it can slightly overshoot that trend line.
Primary wave A lasted 31 weeks, primary wave B lasted 23 weeks, and primary wave C may now have completed its 36th week. A double zigzag may be expected to be longer lasting than single zigzags within a triangle, and so this continuation of primary wave C is entirely acceptable and leaves the wave count with the right look at this time frame.
DAILY CHART
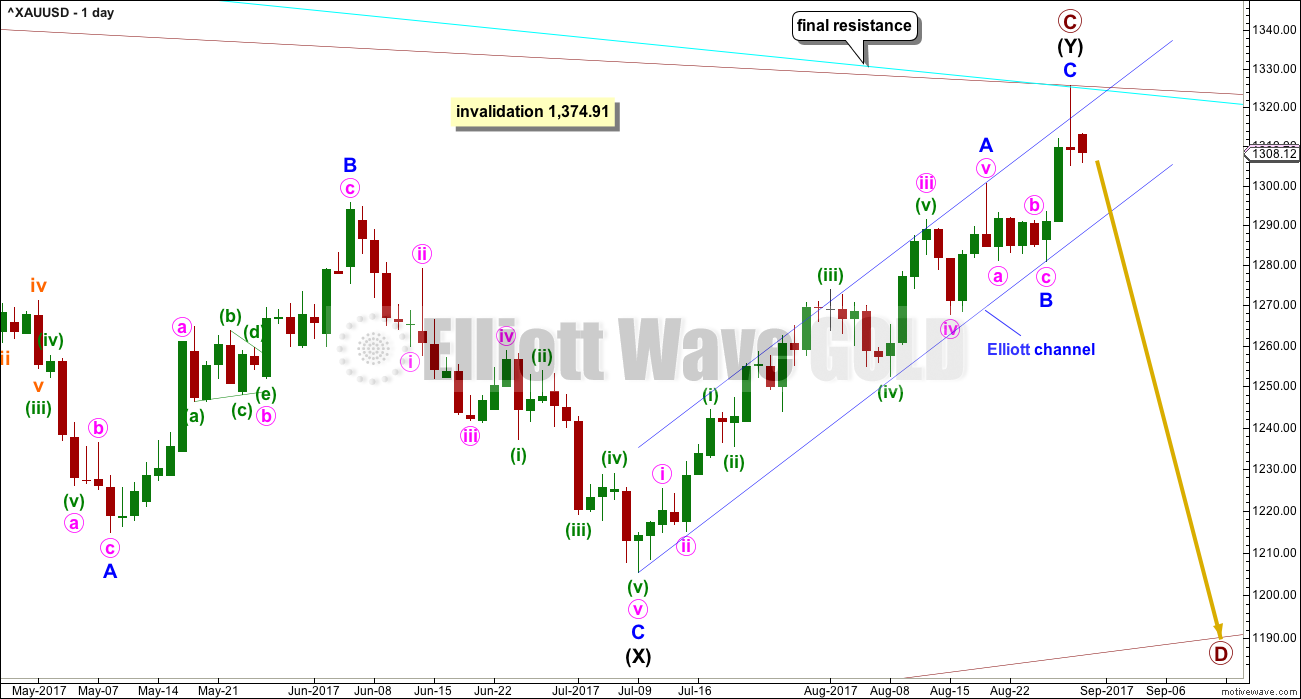
The cyan Magee trend line should offer very strong resistance. This wave count does not expect it to be breached.
On this daily chart, drawn on a semi-log scale, price has exactly touched the trend line and reacted downwards from there. While price remains below the Magee trend line but within the dark blue Elliott channel, both wave counts will be valid and it will be uncertain what direction may be next.
A breach of the blue Elliott channel by downwards movement would see this main wave count further increase in probability. That would indicate a trend change.
Intermediate wave (Y) may now be a complete zigzag. Minor wave C within it may now be a complete five wave impulse.
This wave count now requires a trend change.
HOURLY CHART
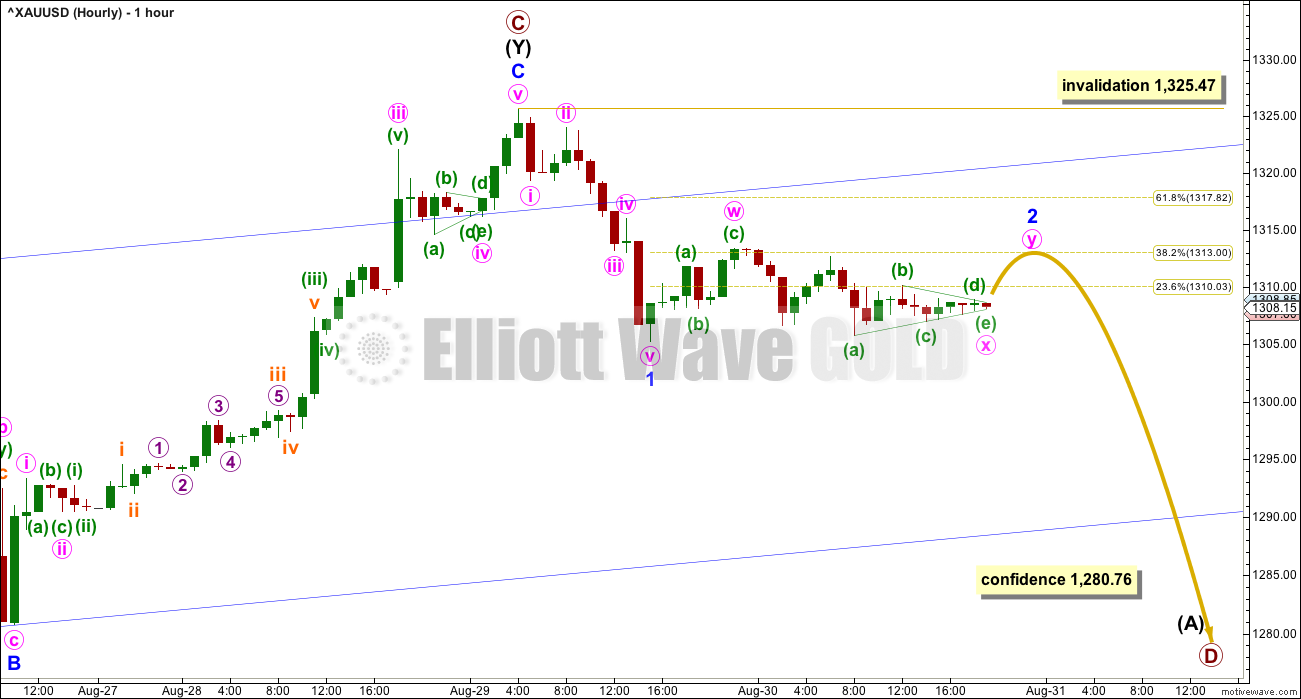
If primary wave C is over and primary wave D downwards is now beginning, then a clear five down should develop first at the hourly chart level, then at the daily chart level.
A five down may be complete at the hourly chart level, and minute wave iv is more brief than minute wave ii. This is acceptable. Gold often exhibits impulses which have a curved look when its fourth wave is quicker than its second wave.
Minor wave 2 may not move beyond the start of minor wave 1 above 1,325.47.
Minor wave 2 may be unfolding as a shallow combination. It may yet morph into a flat or double zigzag. If a double zigzag, then it may end closer to the 0.618 Fibonacci ratio than the 0.382 Fibonacci ratio. For now the expectation will be for a double combination to end close to the 0.382 Fibonacci ratio.
A new low below the lower edge of the dark blue channel would add substantial confidence to this main wave count. A new low below 1,280.76 would add further confidence.
ALTERNATE ELLIOTT WAVE COUNT
WEEKLY CHART
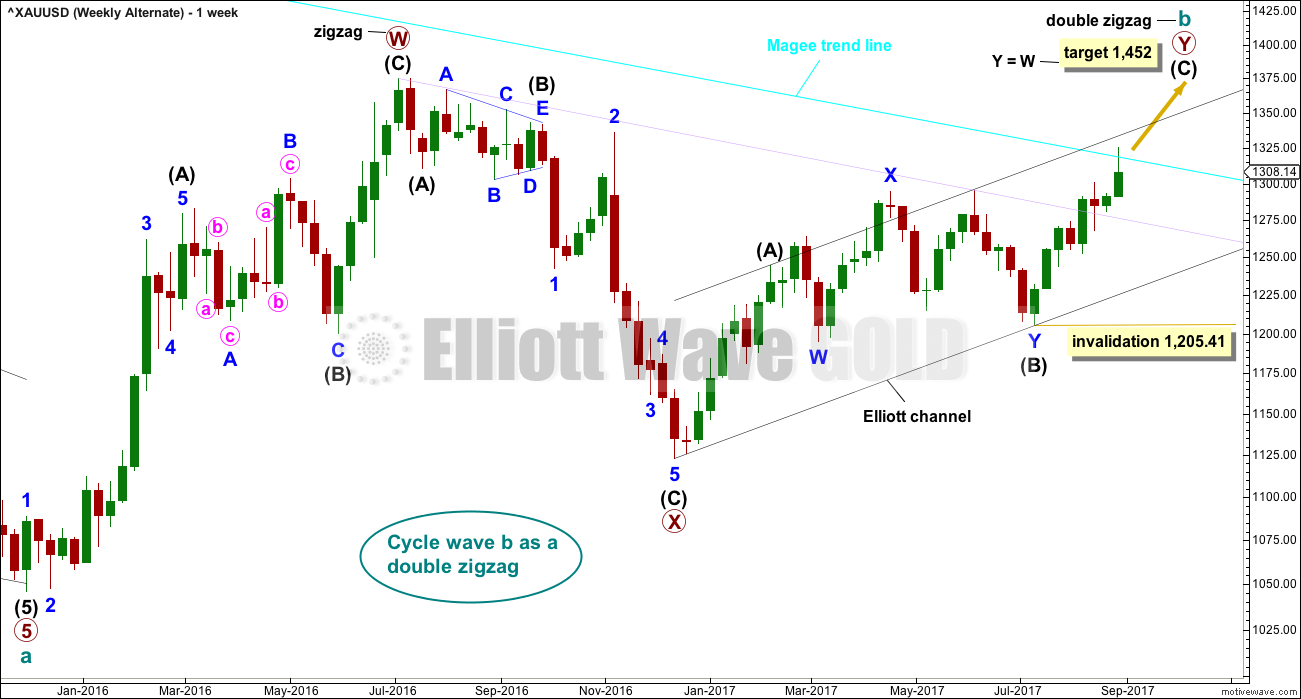
There are more than 23 possible corrective structures that B waves may take, and although cycle wave b fits best at this stage as a triangle (main wave count), it may still be another structure. This wave count looks at the possibility that it may be a double zigzag.
If cycle wave b is a double zigzag, then current upwards movement may be part of the second zigzag in the double, labelled primary wave Y.
The target remains the same.
Along the way up, some resistance should be expected at the cyan Magee trend line. Because this wave count requires price to break above the Magee trend line, it must be judged to have a lower probability for this reason. This trend line is tested multiple times and goes back to 2011. It is reasonable to expect price to find resistance there, until proven otherwise.
Within intermediate wave (C), no second wave correction may move beyond the start of its first wave below 1,205.41.
DAILY CHART
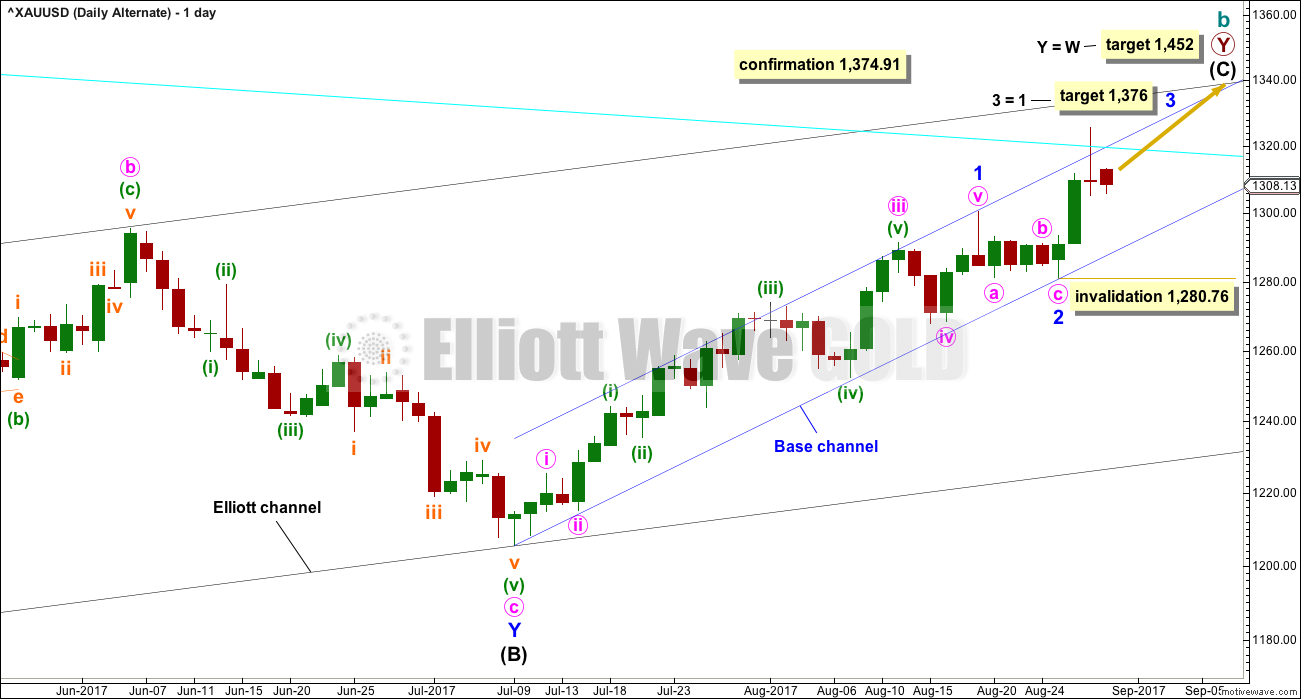
Intermediate wave (C) may be unfolding as an impulse.
Within the impulse, minor waves 1 and 2 would now be complete.
Minor wave 2 may have ended at Friday’s low. However, it is unusual for second wave corrections to be this shallow.
With minor wave 1 a very long extension, the Fibonacci ratio of equality is used for a target for minor wave 3 now.
Within minor wave 3, no second wave correction may move beyond its start below 1,280.76.
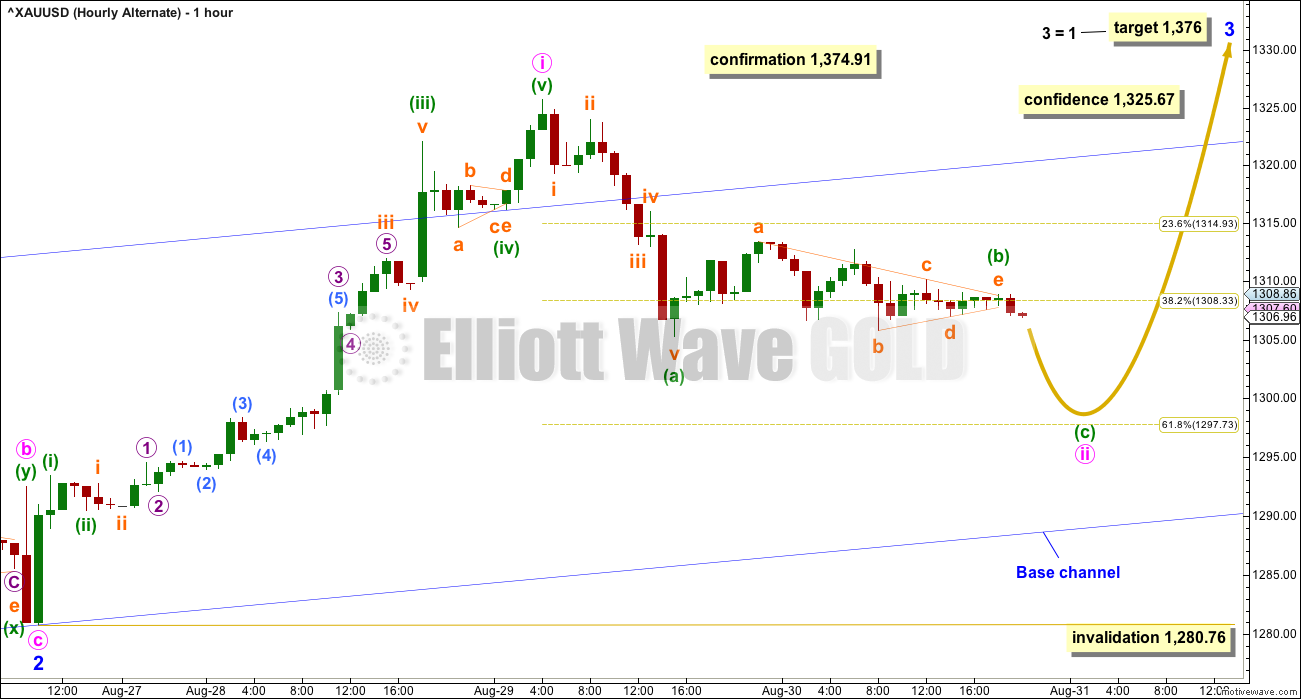
HOURLY CHART
Minor wave 3 has now moved above the end of minor wave 1, but not yet far enough above it to allow room for minor wave 4 to unfold and remain above minor wave 1 price territory.
Minor wave 3 may only subdivide as an impulse.
Minute wave ii may be continuing lower. At this time, it looks like a triangle may be completing which may be minuette wave (b) within a zigzag. Minute wave ii may end close to the 0.618 Fibonacci ratio of minute wave i about 1,298.
This wave count expects to see a further increase in upwards momentum, and upwards movement for a third wave should have support from increasing volume.
TECHNICAL ANALYSIS
WEEKLY CHART
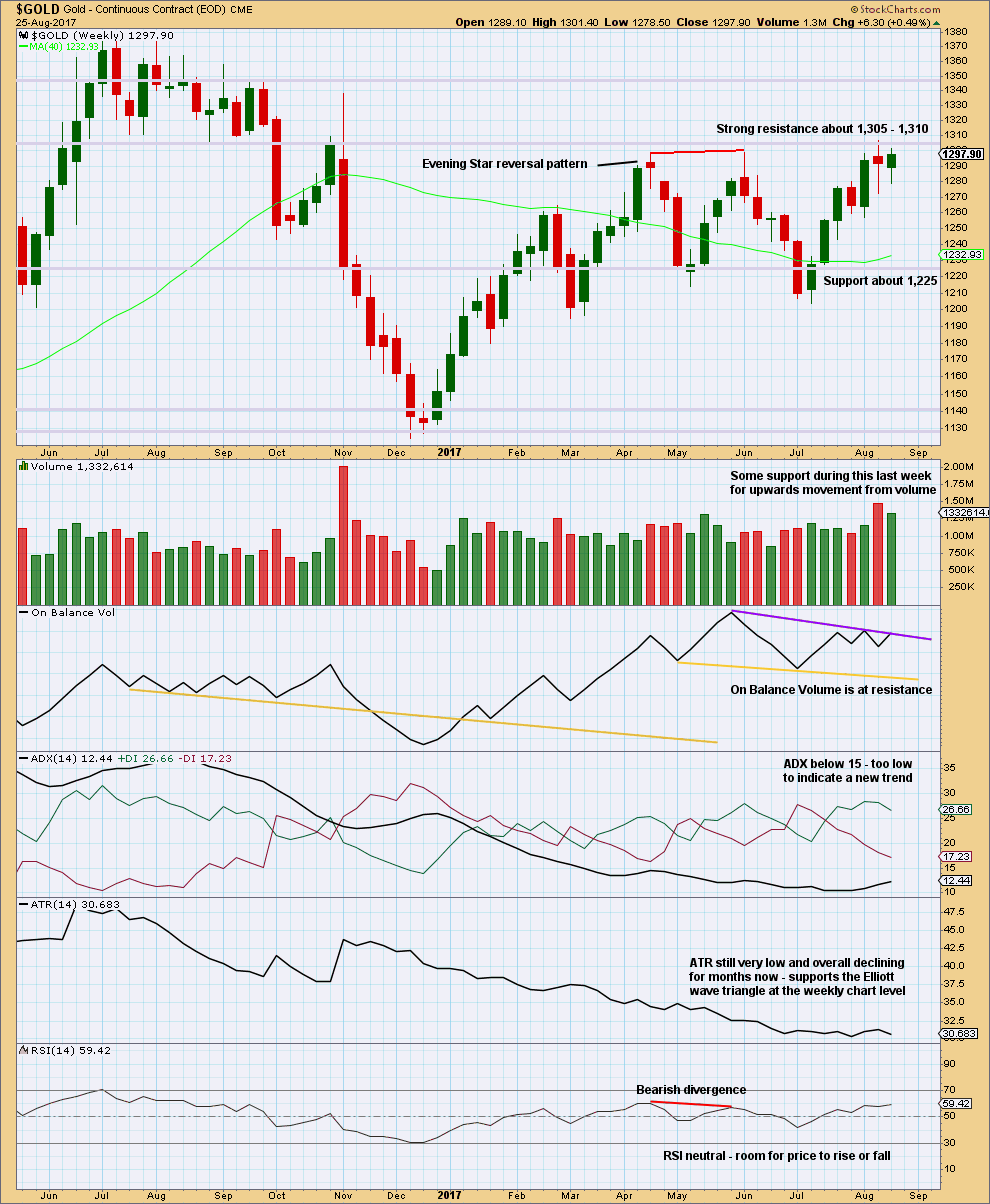
Click chart to enlarge. Chart courtesy of StockCharts.com.
Resistance about 1,305 – 1,310 continues to hold. Each time resistance is tested, and holds, it is strengthened.
Volume is slightly bullish. The long lower wicks on the last two weekly candlesticks is bullish.
The resistance line for On Balance Volume has only been tested twice and is not long held, so it does not offer good technical significance. It offers some weak resistance. If it is breached, that would be a weak bullish signal.
DAILY CHART
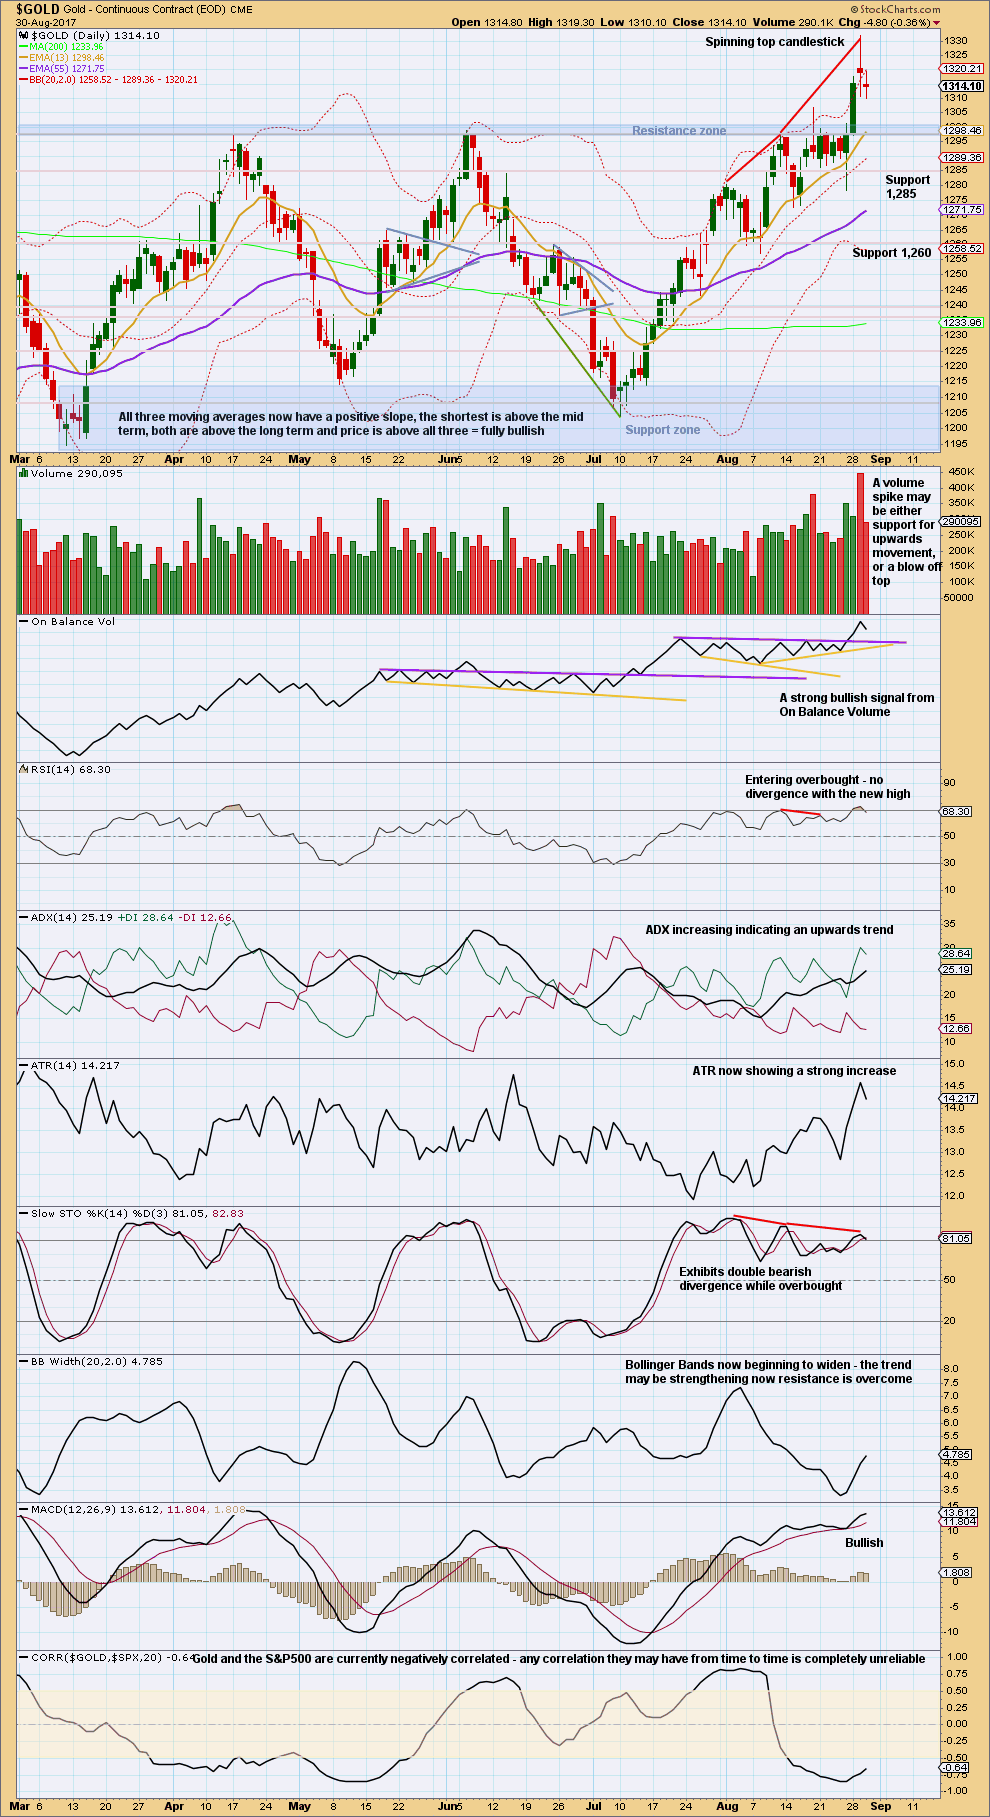
Click chart to enlarge. Chart courtesy of StockCharts.com.
It is impossible to tell if yesterday’s volume spike is a blowoff top or support for a continuing upwards trend. It is my judgement based upon experience with this market that it may more likely be a blowoff top, because volume today was stronger than any other day over the last six months. We have to go back to the 9th November, 2016, to see a day with stronger volume, and that day marked a trend change.
Price moved lower today. A small doji completed representing indecision and a balance of bulls and bears. Volume does not support the downwards movement here in price.
There is an upwards trend which has support from volume and rising ATR. The trend is not yet extreme, but RSI is close to overbought still. It may remain extreme for a small time during a bull trend for Gold and Stochastics may remain extreme for a longer time.
The upwards trend can certainly continue. This chart is more bullish than bearish. Today, it looks like the small doji is a pause within the upwards trend.
GDX
DAILY CHART
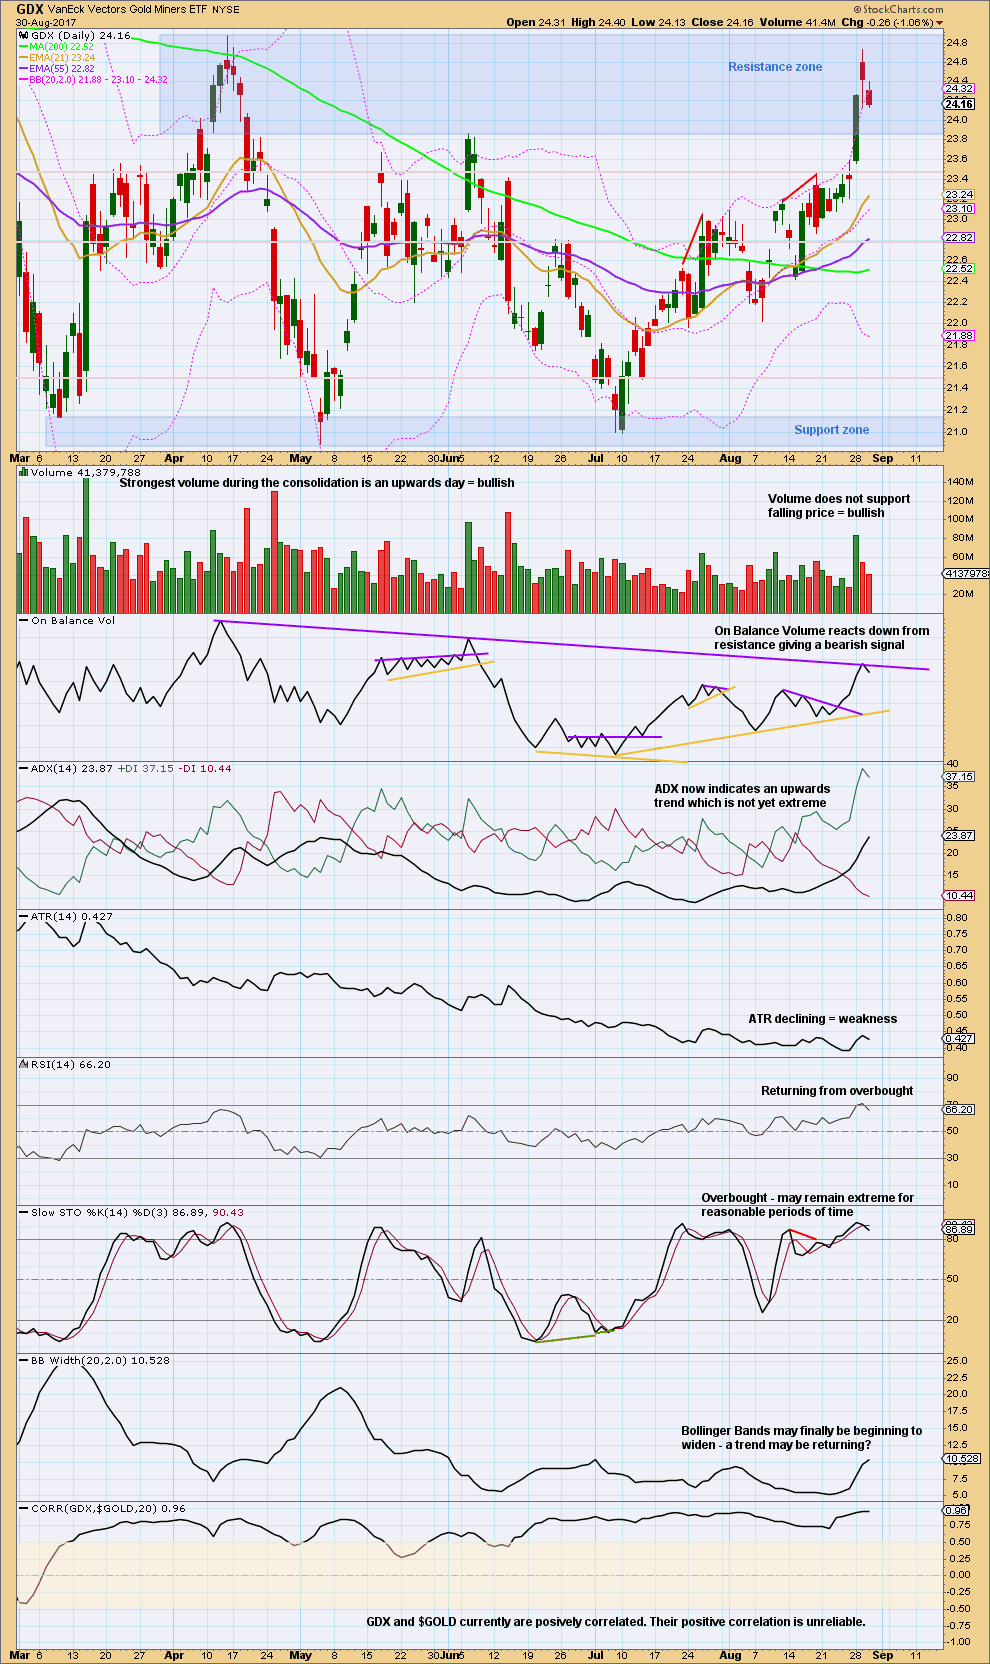
Click chart to enlarge. Chart courtesy of StockCharts.com.
There is an upwards trend and still room for it to continue. The only cause for concern at this time is the trend lacks support from any increase in ATR, so the trend looks weak.
With price in a resistance zone, RSI and Stochastics at or close to overbought, and On Balance Volume reacting downwards today, it looks like a small pullback is underway within an upwards trend for GDX.
This technical analysis for both Gold and GDX offers more support to the alternate Elliott wave count for Gold.
Published @ 08:04 p.m. EST.

Main hourly updated:
I’m going to rely heavily on classic TA today, particularly volume.
An expanded flat fits neatly for minor 2, a very deep correction. The first second wave in a new trend is usually very deep, so this fits normal behaviour.
If volume is light I’ll still favour this main wave count.
For the alternate count recent movement has a better fit. Hourly chart updated.
I’m very concerned that price may be closing above the Magee trend line today.
If volume supports this rise then I may tentatively favour the alternate count. But if volume is light as D GO below suggests, then it wouldn’t be a solid third wave.
Volume for gold stocks were light. Sometimes that can be a clue. We will see tomorrow after the jobs report
Volume in the gold stocks is anemic for a major breakout. The commercials have been shorting heavy and probably added another 30 k short tomgold hedges. If this jobs report is big then it is going to hit the gold market hard. If not maybe we finally start seeing some volume but very perplexing. Today the volume seems more like end of month window dressing.
b wave up, followed by c wave down to complete wave ii before resuming up for alternate??
I really wait an upade about the trend it looks up for me
Minute 2 is likely already complete.
You’re on the ALT then Dreamer right?
Yes
Question for the board
I see Monday is a US holiday, markets closed.
Gold will be trading yes?
thanks
Yes. But it’ll probably be very quiet.
Nice. Gold price beginning to ride atop the weekly upper band with 5dma supporting. Raised SL to 1304 from 1297 on the long taken earlier today. Lets see if price can challenge a break above 1314-1317.
Gold price has come a long way since making the 1205 low clocking higher lows/higher highs 1250/1292; 1267/1300; 1276/1325 and now 1298 to where? Tricky stuff! lol
Aggressively raised stop to 1314 and may raise it. Lets see how much more Gold price has and if it will give me TP 1321+; price should look to dip soon with 4-hourly & daily RSI heading for 70. GL all and have a fine day. Tomorrow is another day.
Lara. A question. Why the recent change of labelling which moved the finish higher for the impulse labelled a or 1 from the $1205 low ? Is it something to do with breach of trendlines? I think there must be a small lesson there>
if I left wave B or 2 lower down, on the low for 8th August, then the following movement has too much overlapping within it to fit as either an impulse or an ending diagonal for wave C
it could fit as a series of 1-2, 1-2 waves for the start of a third wave (alternate) but the duration of the correction which ended on the 25th August is too great for a lower degree second wave…. it just didn’t look right
does that make sense? if it’s clear as mud I can do a quick video to explain
because yeah, there’s a lesson in there
yes that makes sense thanks, things ay well change with overnight price
I will see what your next analysis is.
The Main Count is correct if we consider Minor 2 to be a quick double zigzag ending at 1313.40. Subsequent movement forms part of Minor 3.
What do you of the structure of movement down since 1313.4. Does it look impulsive? I liked the look of the quick triangle breakdown which would favor the alternate.
And so do I. If you had followed my past posts, you’ll be aware that I am inclined more towards the bullish side of the story.
Looking for one more leg down to new low.
just went down to 1297 area. Does this mean we are looking at ALT hourly chart?
I think so. Looking for end of second wave early today and then rally up. Got the job claim numbers at 8:30 est which could be catalyst for turn. My max downside target is 1295/1296 if we have not hit the bottom already.
1295 for me too
With ADX up, 50dma crossed above the 100dma and hourly RSI tagging below 30, hard to say which wave count is in play…. I fancy staying long on this with a deep stop loss at 1280. Time will tell! GL.
Prefer to stay Bullish Gold which is showing reluctance to retrace to 50%-61.8% (1303/1298) of 1280.76/1325.67. Uneasy posturing lol. Will look to go long on a break below 1306 for target 1314-1317-1321+ notwithstanding the positioning of the upper bands. SL 1297. Lets see if this works lol…. 🙂