
Upwards movement continued at the start of the week towards the target. After almost reaching the target on the second Elliott wave count, and finding resistance at its channel, Silver has turned down.
Summary: A pullback may have begun for Silver. If the blue Elliott channel on the daily charts is breached, expect it may be a new downwards wave and not just a shorter pullback. First support at the lower edge of the channel, which is about 16.390, needs to be breached.
New updates to this analysis are in bold.
Last monthly chart is here.
ELLIOTT WAVE COUNTS
FIRST WAVE COUNT
WEEKLY CHART
Click chart to enlarge.
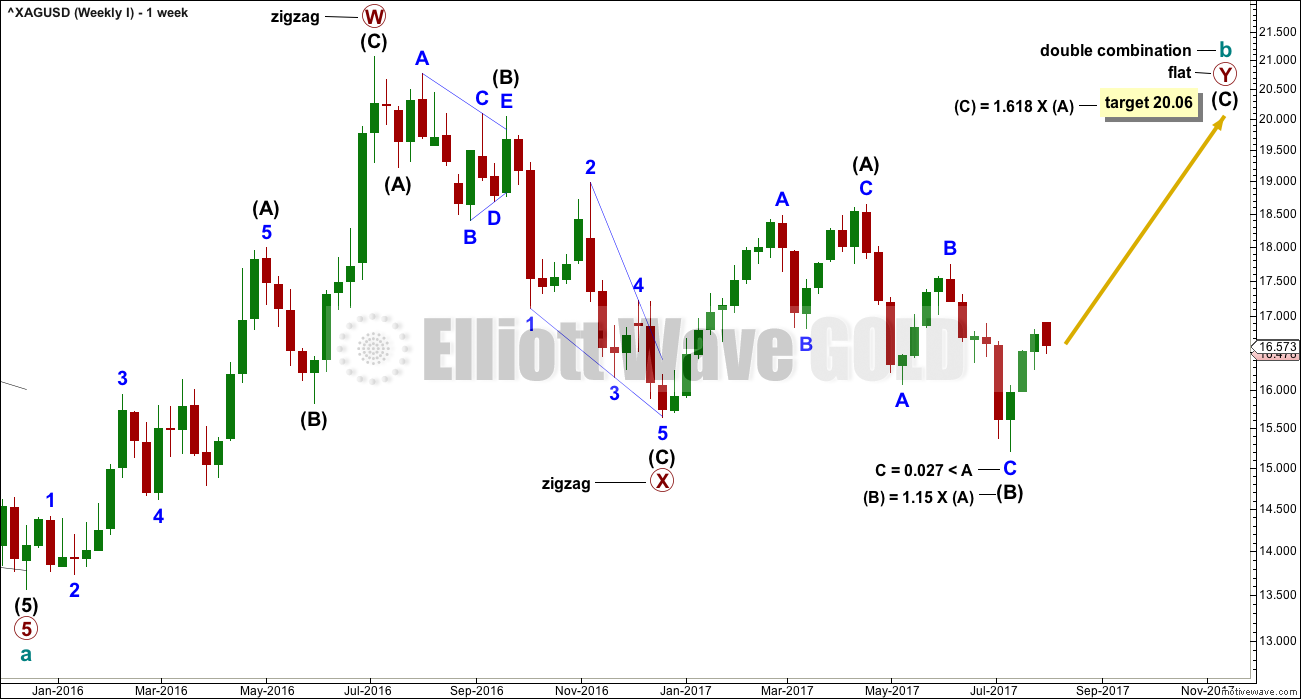
Cycle wave b may be completing as a double combination: zigzag – X – flat. The second structure, a flat correction for primary wave Y, may be underway.
Within a flat correction, intermediate wave (B) must retrace a minimum 0.9 length of intermediate wave (A) at 15.938. Intermediate wave (B) has met this minimum requirement; the rule for a flat correction is met. Intermediate wave (B) is longer than 1.05 times the length of intermediate wave (A) indicating this may be an expanded flat. Expanded flat corrections are the most common type. Normally their C waves are 1.618 or 2.618 the length of their A waves.
The target calculated would see primary wave Y to end close to same level as primary wave W about 21.062. The purpose of combinations is to take up time and move price sideways. To achieve this purpose the second structure in the double normally ends about the same level as the first.
While the combination wave count at the weekly chart level does not currently work for Gold, it does still work for Silver. They do not have to complete the same structures for cycle wave b, and fairly often their structures are different.
DAILY CHART
Click chart to enlarge.
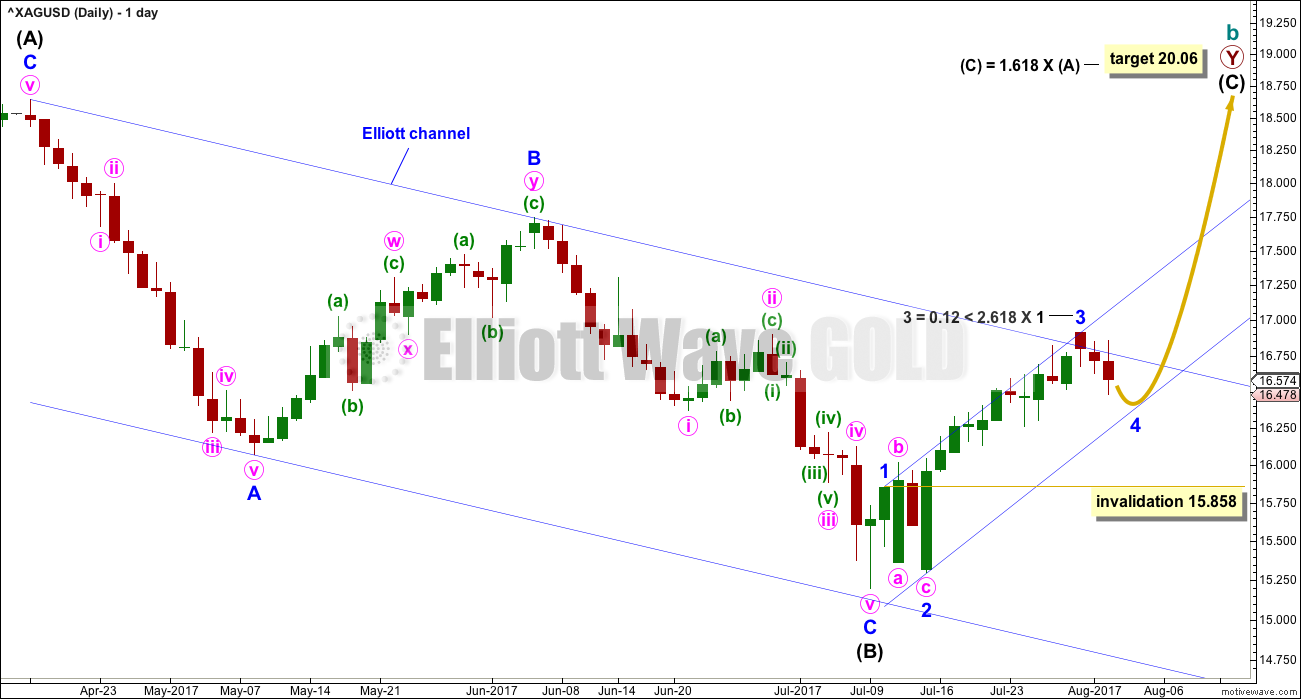
When the blue channel about intermediate wave (B) is breached by upwards movement, that shall add confidence in a trend change. Along the way up, the upper edge may provide some resistance. This may be where minor wave 3 has ended.
Minor wave 4 should now find support at the lower edge of the smaller blue upwards sloping channel.
Minor wave 4 may not move into minor wave 1 price territory below 15.858.
SECOND WAVE COUNT
WEEKLY CHART
Click chart to enlarge.
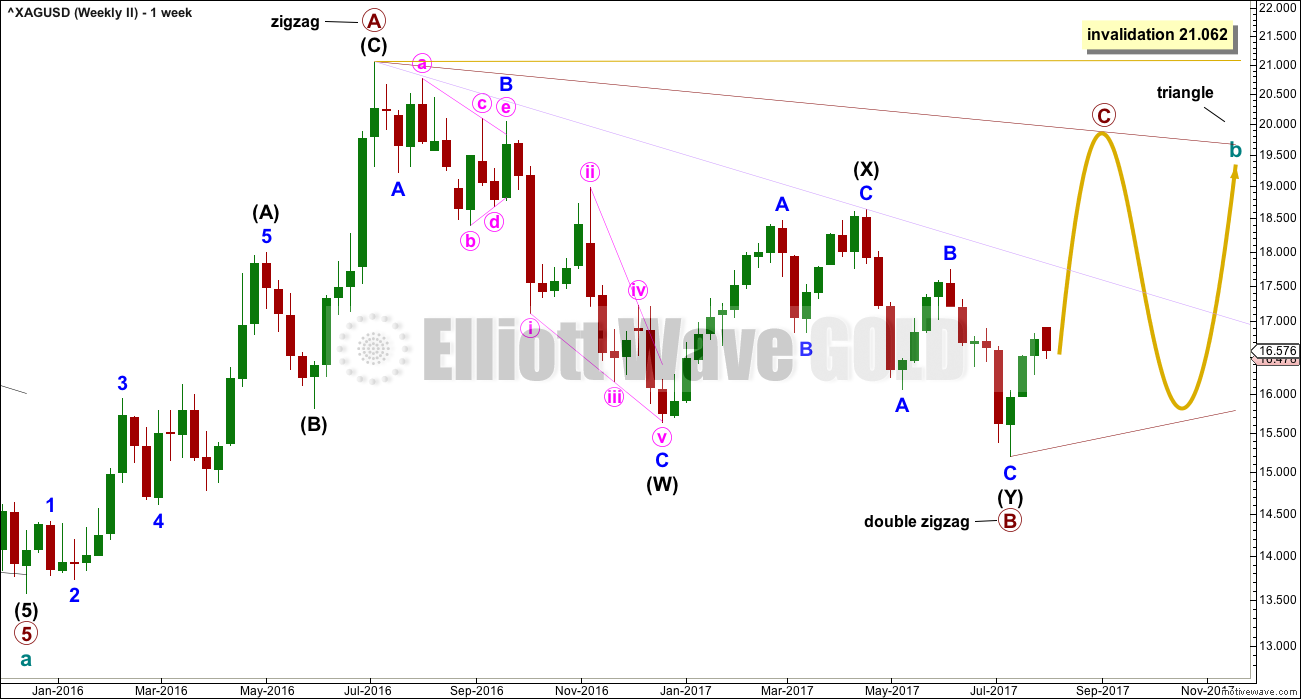
Within a triangle, one of the sub-waves must be a more complicated multiple, usually a multiple zigzag. This may be complete for primary wave B.
Primary wave C upwards should unfold as a single zigzag that may not move beyond the end of primary wave A above 21.062. The A-C trend line is adjusted to see primary wave C reach a more normal length in relation to primary wave B. Along the way up, price may find some resistance at the lilac trend line.
Primary wave C must subdivide as a three wave zigzag, so within it there should be a big pullback for intermediate wave (B).
DAILY CHART
Click chart to enlarge.
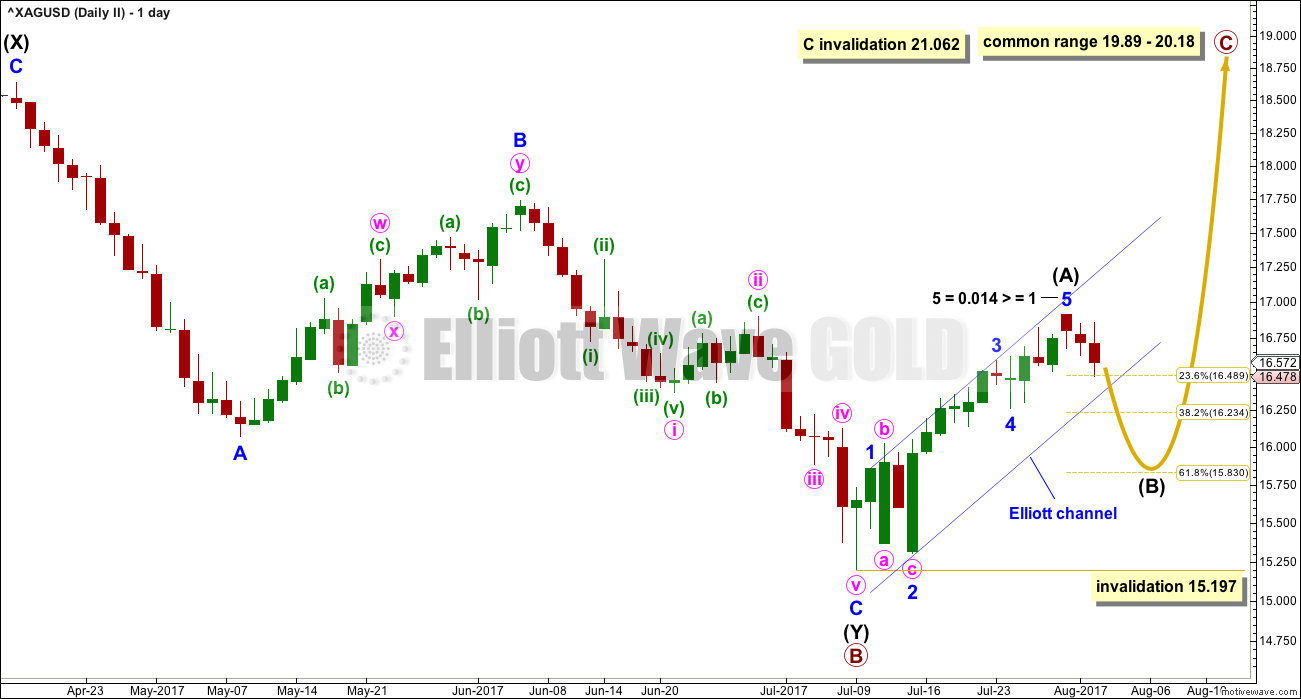
This wave count expects a shorter upwards wave than the first wave count.
When price breaks below the lower edge of the blue Elliott channel, that shall add confidence to the idea that intermediate wave (A) is complete and intermediate wave (B) is underway.
Intermediate wave (B) may not move beyond the start of intermediate wave (A) below 15.197.
TECHNICAL ANALYSIS
WEEKLY CHART
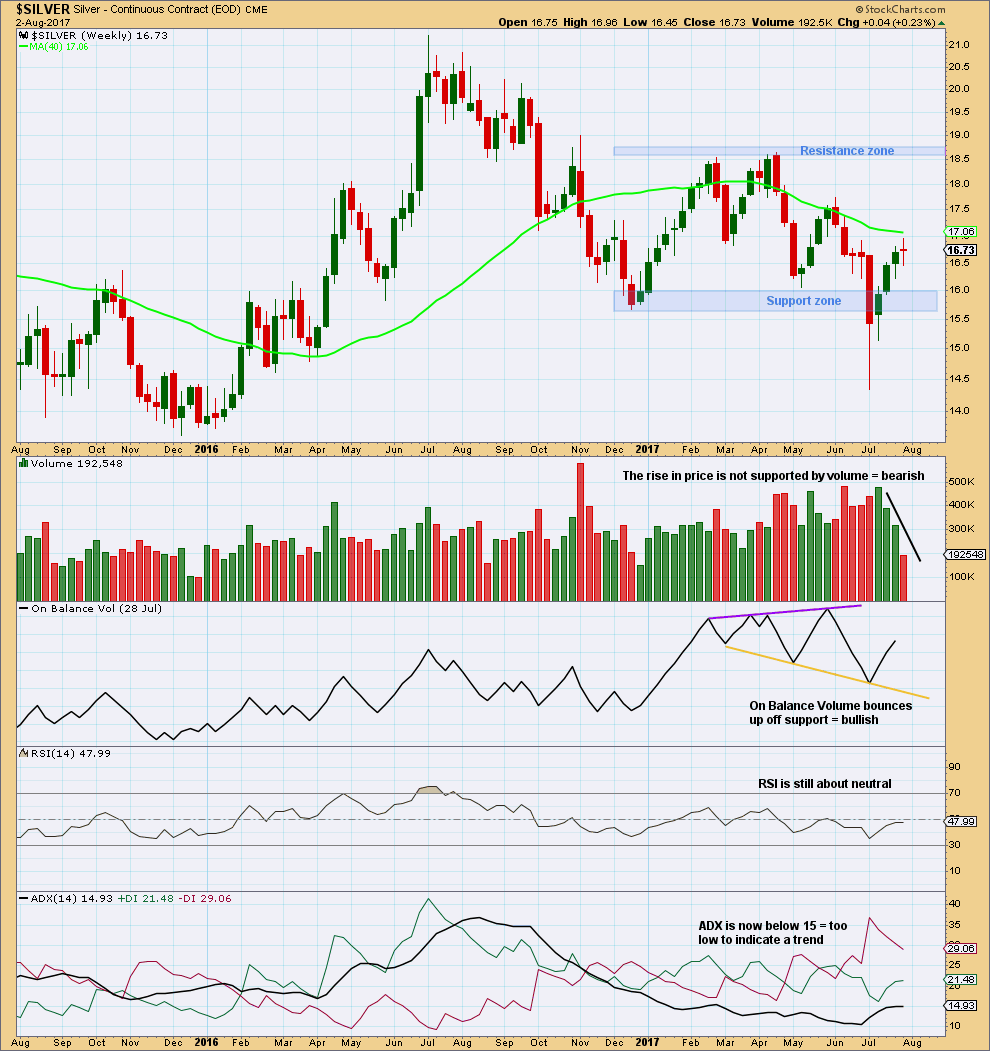
Click chart to enlarge. Chart courtesy of StockCharts.com.
RSI indicates there is plenty of room for price to rise or fall.
During the consolidation, it is a downwards week which has strongest volume suggesting a downwards breakout may be more likely.
In the short term, this upwards movement of the last four weeks looks very weak.
DAILY CHART
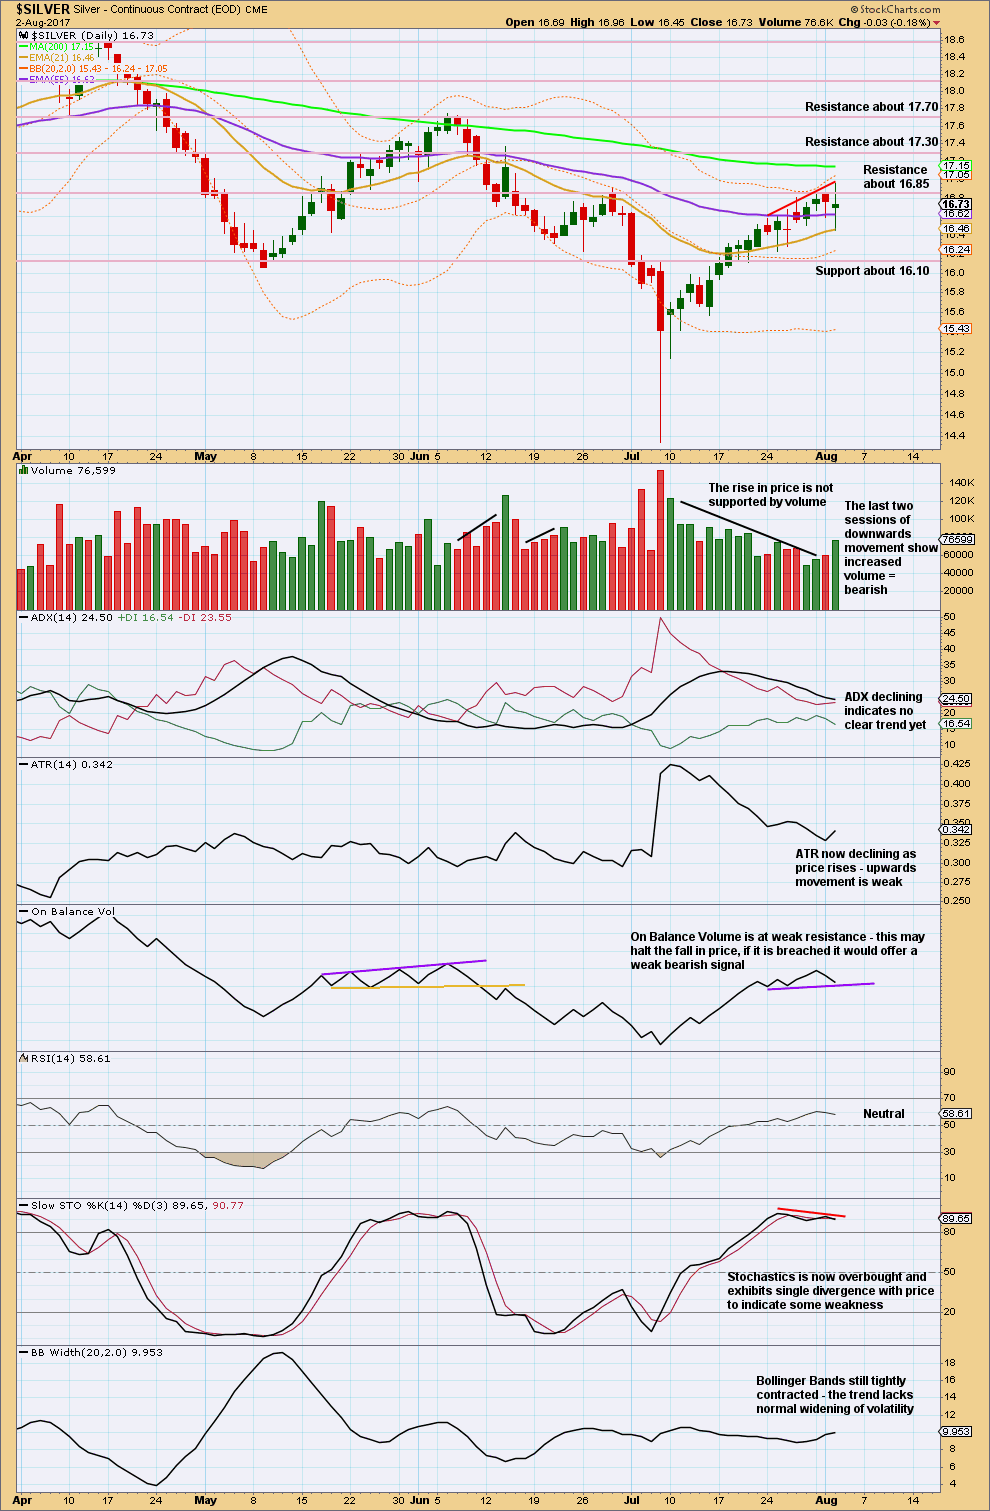
Click chart to enlarge. Chart courtesy of StockCharts.com.
Today’s spinning top candlestick puts the trend from up to neutral.
Overall, there is now some bearishness in this chart to support the idea of a trend change or pullback here or very soon.
Published @ 09:55 p.m. EST.