
A break below support from On Balance Volume indicated more downwards movement. After that bearish signal that is what has happened.
Summary: Downwards movement has support from classic technical analysis. The target is at either 16.347 or as low as 15.799 – 15.649.
New updates to this analysis are in bold.
Last monthly chart is here.
ELLIOTT WAVE COUNTS
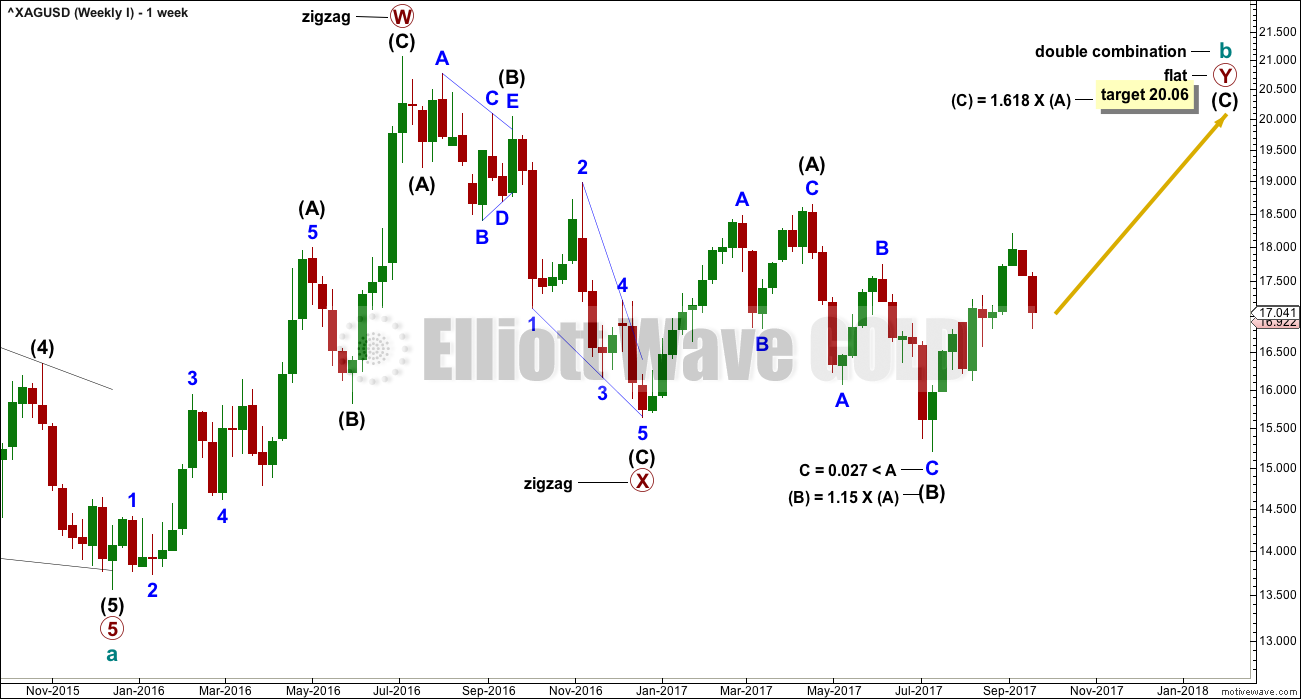
FIRST WAVE COUNT
WEEKLY CHART
Click chart to enlarge.
Cycle wave b may be completing as a double combination: zigzag – X – flat. The second structure, a flat correction for primary wave Y, may be underway.
Within a flat correction, intermediate wave (B) must retrace a minimum 0.9 length of intermediate wave (A) at 15.938. Intermediate wave (B) has met this minimum requirement; the rule for a flat correction is met. Intermediate wave (B) is longer than 1.05 times the length of intermediate wave (A) indicating this may be an expanded flat. Expanded flat corrections are the most common type. Normally their C waves are 1.618 or 2.618 the length of their A waves.
The target calculated would see primary wave Y to end close to same level as primary wave W about 21.062. The purpose of combinations is to take up time and move price sideways. To achieve this purpose the second structure in the double normally ends about the same level as the first.
While the combination wave count at the weekly chart level does not currently work for Gold, it does still work for Silver. They do not have to complete the same structures for cycle wave b, and fairly often their structures are different.
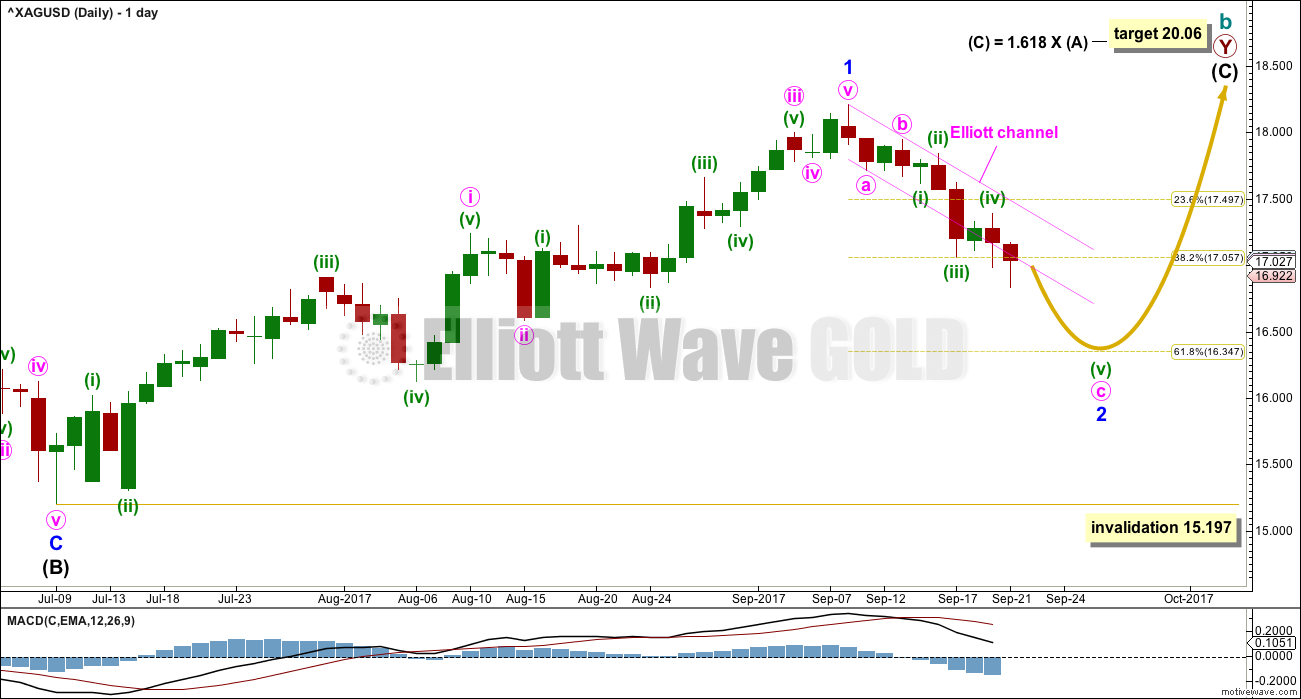
DAILY CHART
Click chart to enlarge.
For this first wave count, upwards movement for intermediate wave (C) must subdivide as a five wave structure. It may be unfolding as an impulse.
The labelling of upwards movement in last week’s analysis was invalidated. Now downwards movement is too large in size to be considered a correction within the last upwards wave; it now looks like a new wave of at least the same degree.
Within the impulse of intermediate wave (C), it may be that only minor wave 1 was over at the last high and now minor wave 2 may be unfolding. Minor wave 2 may not move beyond the start of minor wave 1 below 15.197.
The most likely point for minor wave 2 to end may be the 0.618 Fibonacci ratio of minor wave 1 at 16.347.
Minor wave 1 lasted 44 days. Minor wave 2 so far has lasted 9 days. It would be likely to continue further, so that it has better proportion to minor wave 1. A Fibonacci 21 or 34 days may be expected at this stage.
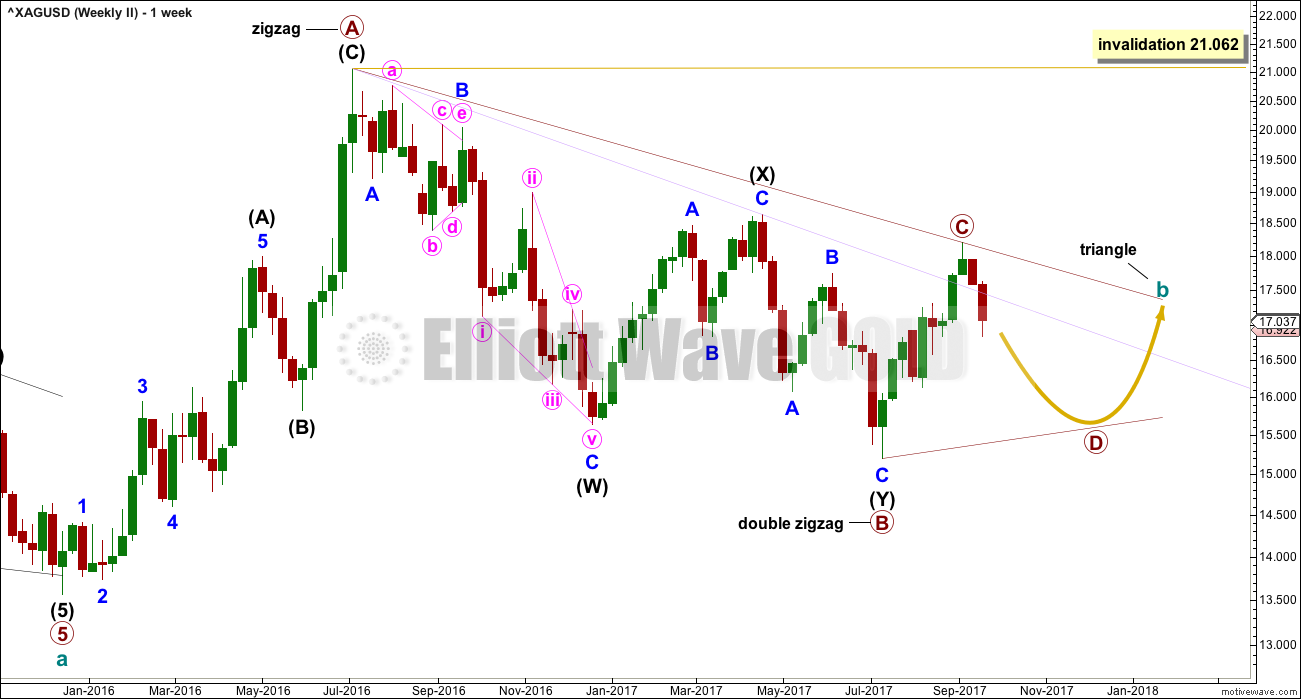
SECOND WAVE COUNT
WEEKLY CHART
Click chart to enlarge.
Within a triangle, one of the sub-waves must be a more complicated multiple, usually a multiple zigzag. This may be complete for primary wave B.
Primary wave C upwards may now be complete. The upper A-C trend line does have a fairly steep slope though, so it must be accepted that primary wave C may not be over and may continue higher. If it does, it may not move beyond the end of primary wave A above 21.062.
Primary wave C must subdivide as a three wave zigzag.
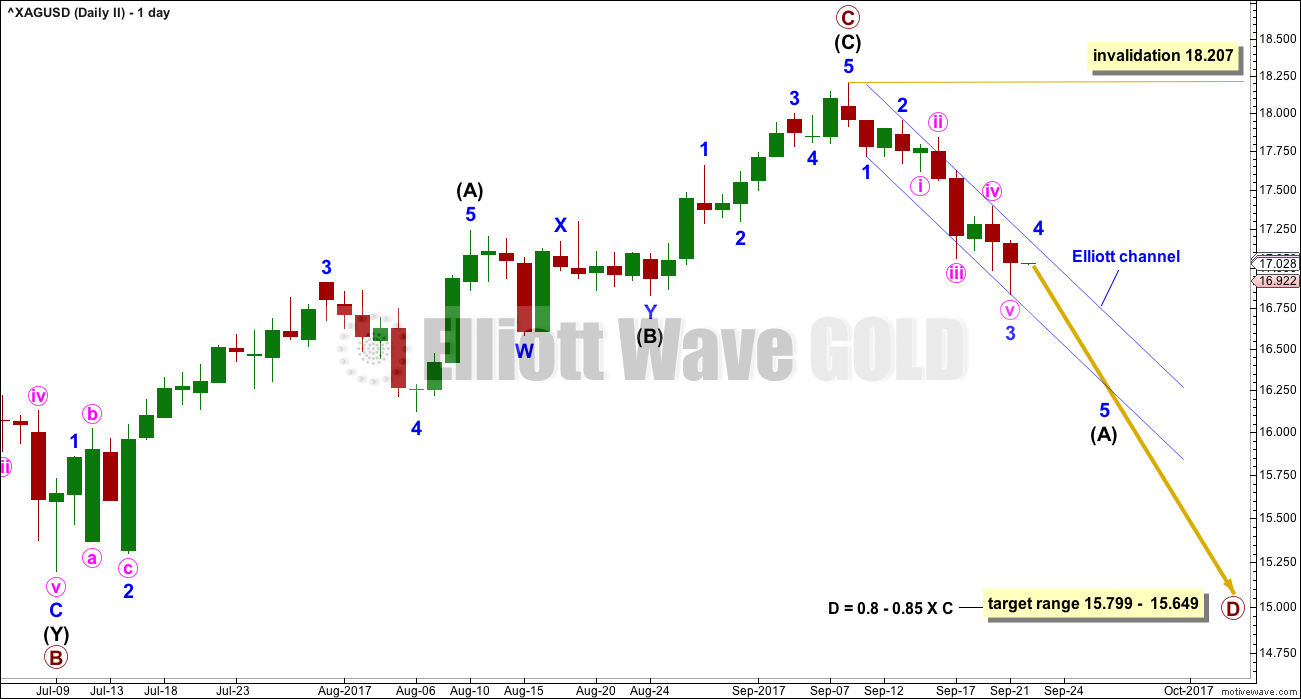
DAILY CHART
Click chart to enlarge.
Primary wave C now looks complete and primary wave D downwards looks to have begun for this wave count. Primary wave D downwards must subdivide as a zigzag, which subdivides 5-3-5.
Within primary wave D, intermediate wave (A) looks to be unfolding as an impulse. Within intermediate wave (A), minor waves 1 through to 3 may be complete. Downwards movement fits well within the Elliott channel with a small overshoot for the middle of the third wave, which is very common.
Along the way down, upwards corrections may find resistance at the upper edge of the channel.
When intermediate wave (A) is complete, then a multi week bounce or consolidation may be expected for intermediate wave (B). Intermediate wave (B) may not move beyond the start of intermediate wave (A) above 18.207.
No target can yet be calculated for minor wave 5 because minor wave 4 within intermediate wave (A) is incomplete. Only when minor wave 4 is over will the start of minor wave 5 be known. Minor wave 5 would most likely be about even in length with minor wave 1, which was 0.490. If it is longer, then the next Fibonacci relationship would be 1.618 the length of minor wave 1 at 0.793.
TECHNICAL ANALYSIS
WEEKLY CHART
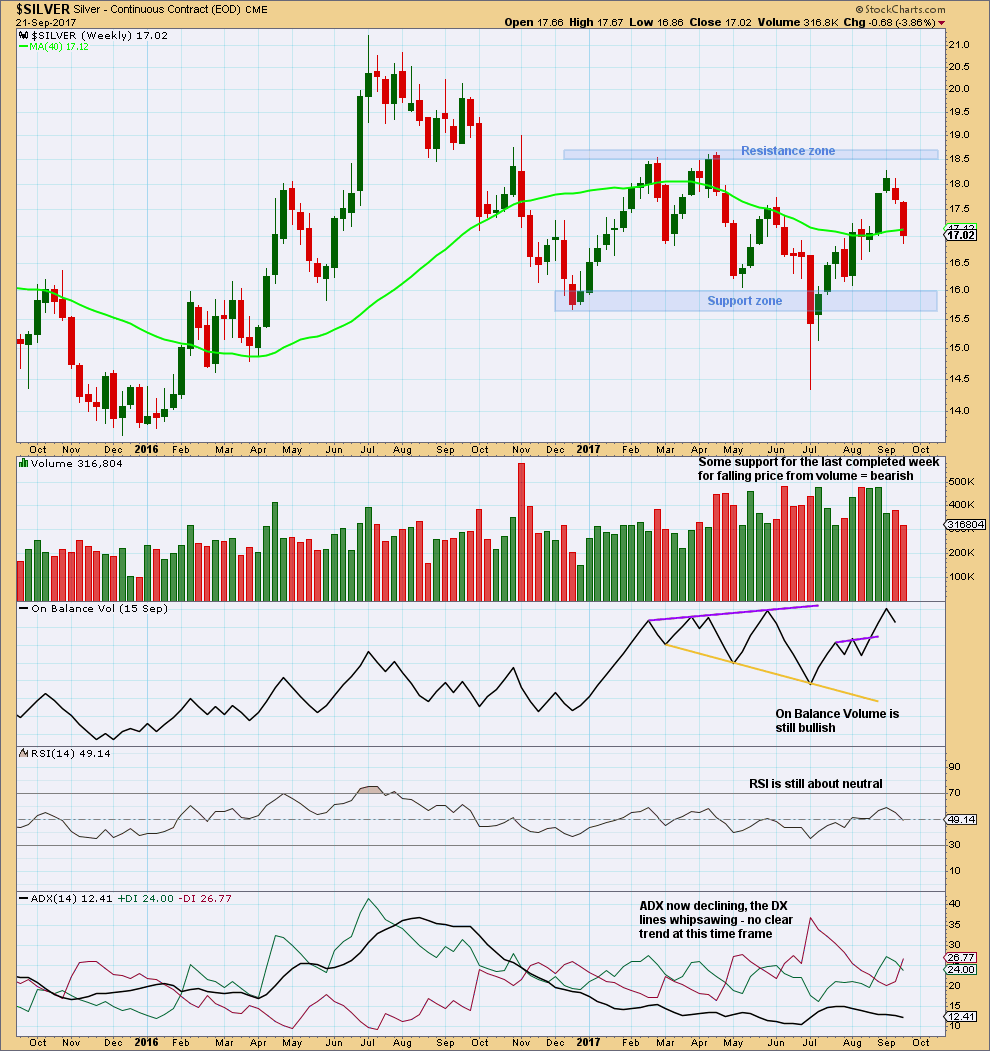
Click chart to enlarge. Chart courtesy of StockCharts.com.
Price is still within a large consolidation zone. Volume remains relatively strong. So far, within the consolidation, it is only now one downwards week that has strongest volume suggesting a downwards breakout eventually is more likely than upwards. However, the difference is very slight between this week and the next strongest week which was an upwards week, so the signal is not a clear one.
The current week is incomplete, so no conclusions may be drawn from volume for this week.
Support is some distance away. There is room for price to fall further here.
DAILY CHART
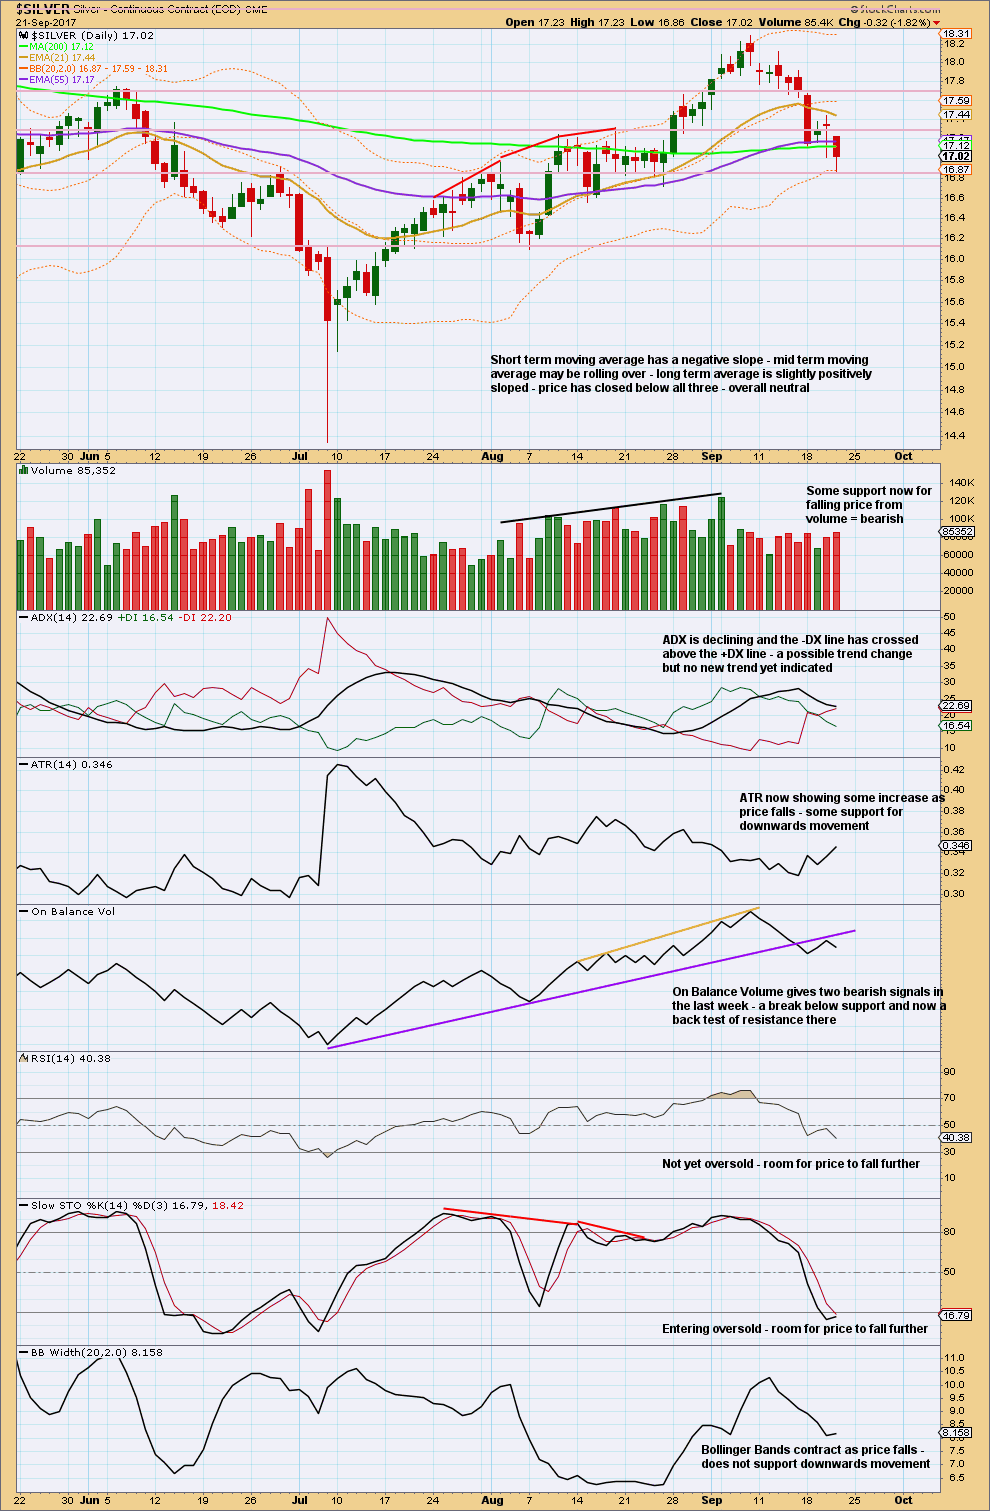
Click chart to enlarge. Chart courtesy of StockCharts.com.
Volume and On Balance Volume are bearish. Expect price to keep falling until it finds support and Stochastics is oversold then exhibits divergence with price. With Stochastics only now just entering oversold and exhibiting no divergence, there is room for price to keep falling here.
Published @ 12:41 a.m. EST on 22nd September, 2017.