
Price continues to find resistance at the wide channel on the monthly and weekly charts.
Summary: Expect a new strong wave down has begun. Target 34.34. Stops may be set just above the invalidation point at 50.22. Invest only 1-5% of equity on any one trade.
In the short term, if price moves back up into the base channel on the daily chart, then look for another deep bounce to 49.30. While resistance holds at the lower edge of that channel, the main wave count should be used.
Look out for Oil to start falling strongly any day now.
The bigger picture for Oil is still bearish and has support from volume analysis.
New updates to this analysis are in bold.
MONTHLY ELLIOTT WAVE COUNT
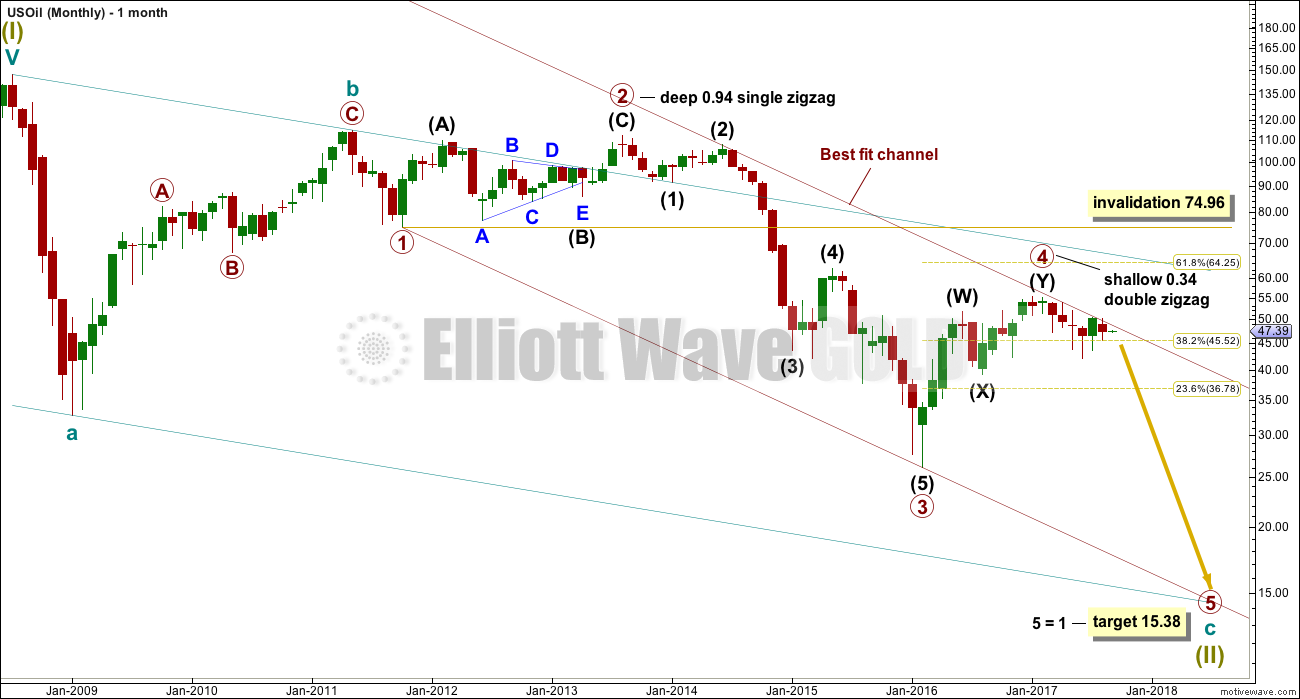
Click chart to enlarge.
Within the bear market, cycle wave b is seen as ending in May 2011. Thereafter, a five wave structure downwards for cycle wave c begins.
Primary wave 1 is a short impulse lasting five months. Primary wave 2 is a very deep 0.94 zigzag lasting 22 months. Primary wave 3 is a complete impulse with no Fibonacci ratio to primary wave 1. It lasted 30 months.
There is alternation in depth with primary wave 2 very deep and primary wave 4 shallow. There is inadequate alternation in structure, both are of the zigzag family, but there is some alternation within structure. Primary wave 2 is a single zigzag and the triangle for intermediate wave (B) gives it a sideways look. Primary wave 4 is a sharper and quicker double zigzag.
If it continues, then primary wave 4 may not move into primary wave 1 price territory above 74.96.
WEEKLY ELLIOTT WAVE COUNT
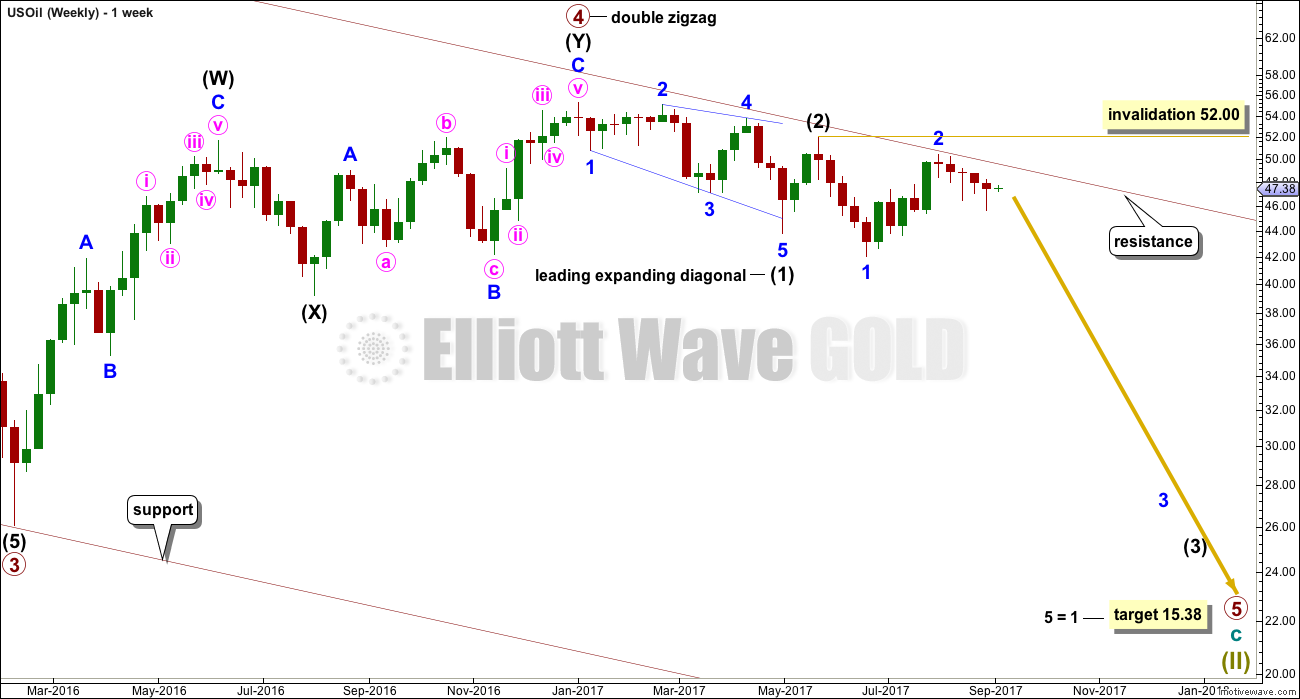
Click chart to enlarge.
The wave count sees primary wave 5 beginning with a leading diagonal for intermediate wave (1), and now a deep expanded flat for intermediate wave (2). This has good proportion, and fits at the daily chart level.
Intermediate wave (3) may have now begun. It may only subdivide as an impulse. Within intermediate wave (3), minor waves 1 and 2 may be complete.
Price continues to find resistance just below the upper edge of the maroon channel, which is copied over from the monthly chart. Assume this wave count shall have the right look while price remains below that trend line. Only would an alternate be considered if that trend line is breached.
Minor wave 2 may not move beyond the start of minor wave 1 above 52.00.
DAILY ELLIOTT WAVE COUNT
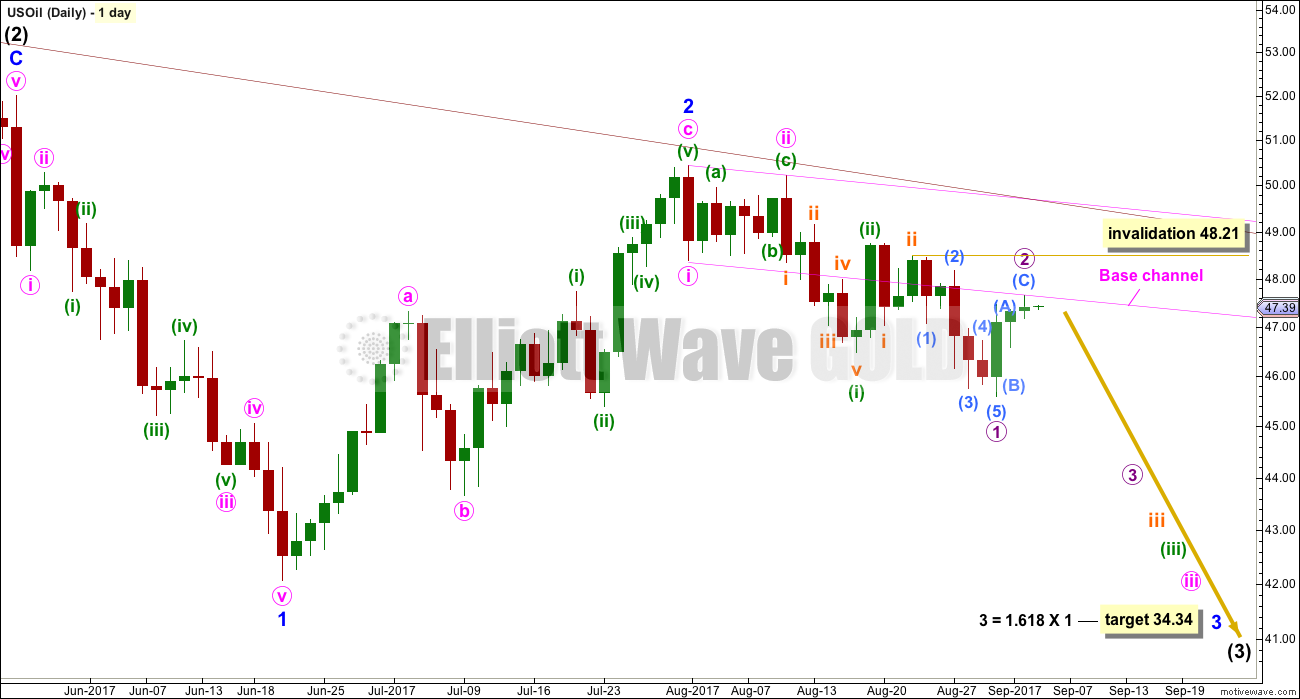
Click chart to enlarge.
It looks like price is continuing to find very strong resistance at the upper maroon trend line, which is copied over from monthly and weekly charts.
Despite the disproportion between intermediate wave (2) and minor wave 2, this wave count does fit in terms of subdivisions.
It looks like minuette wave (ii) may have been over as a quick zigzag. An alternate below looks at the possibility it may not be over.
Within subminuette wave iii, if micro wave 2 moves higher, it may not move beyond the start of micro wave 1 above 48.21.
A base channel is added in pink about minute waves i and ii. Price has broken below it as it should for a third wave. The lower edge might provide resistance. If it does and price reacts downwards from here, then expect downwards momentum to increase sooner rather than later.
This wave count expects to see a strong increase in downwards momentum in coming weeks.
ALTERNATE DAILY ELLIOTT WAVE COUNT
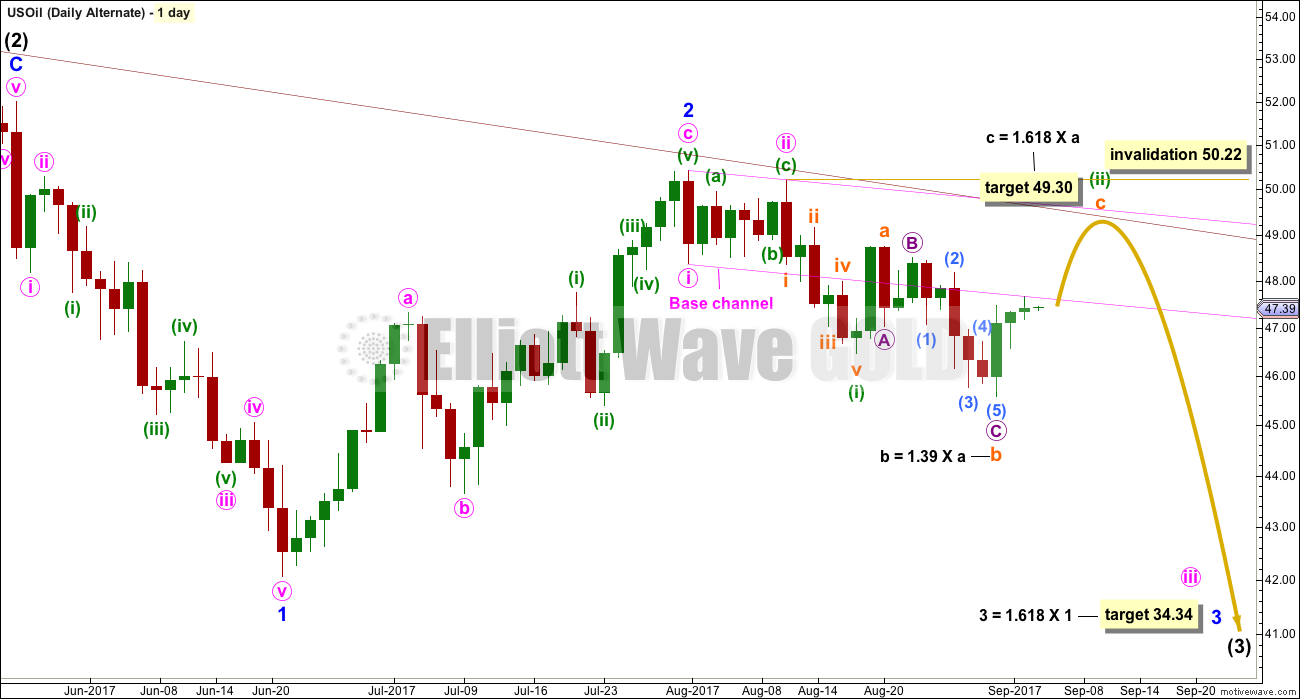
Click chart to enlarge.
It is possible that minuette wave (ii) is not over and may be continuing further as an expanded flat.
Both wave counts have problems of disproportion between minute wave ii and minuette wave (ii), but both shall be considered. Here, minuette wave (ii) would be longer in duration than minute wave ii one degree higher. Sometimes this is how Oil unfolds.
Price needs to overcome resistance at the lower edge of the base channel. If it can do that, then the target for upwards movement to end would see subminuette waves a and c exhibit a common Fibonacci ratio.
Minuette wave (ii) may not move beyond the start of minuette wave (i) above 50.22.
This alternate wave count allows for another test of the maroon trend line. If price gets up again close to that line, it should again offer another good entry point to join an established downwards trend.
TECHNICAL ANALYSIS
DAILY CHART
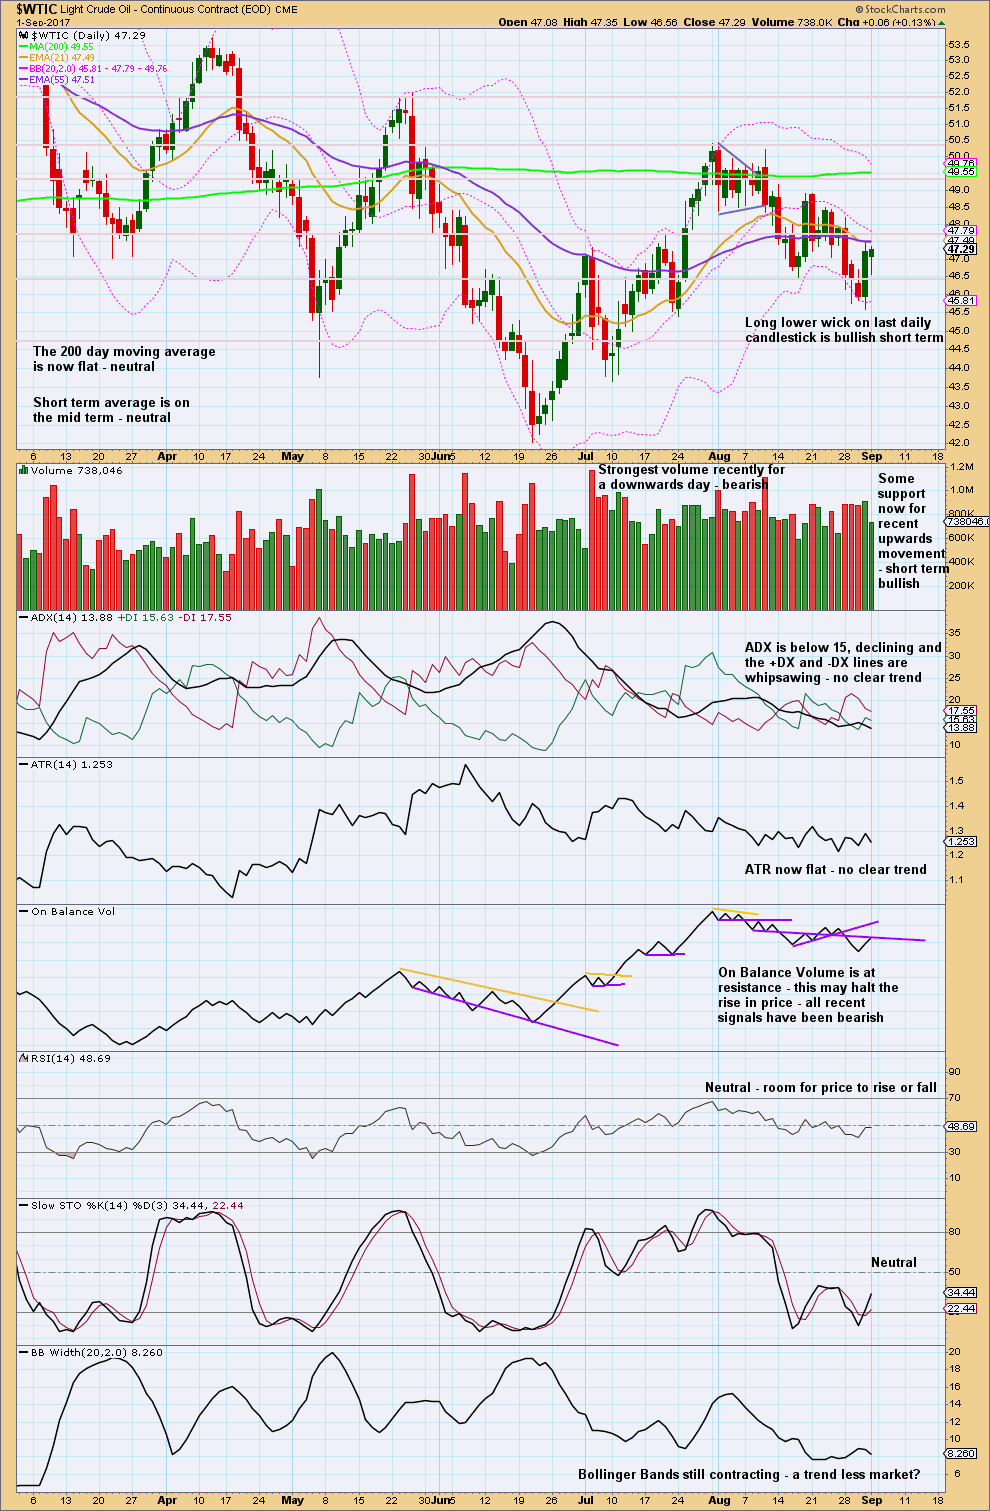
Click chart to enlarge. Chart courtesy of StockCharts.com.
Recent days’ strongest volume is for downwards movement through the months of May to August. This strongly suggests that the larger trend is still down and upwards movement is still a counter trend movement. So far this year Oil has made a series of lower lows and lower highs, the definition of a downwards trend, although the bounces have been deep and time consuming.
In the short term, the picture is not as bearish this week; it is reasonably neutral.
With price at resistance and On Balance Volume at resistance, this may force a turn here.
VOLATILITY INDEX
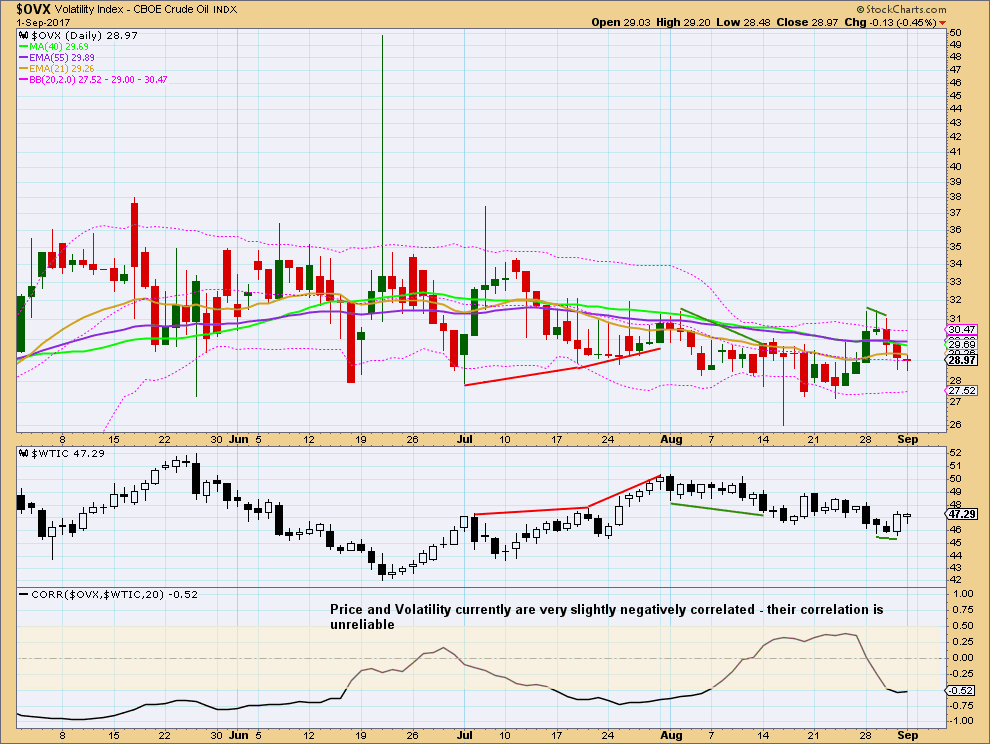
Click chart to enlarge. Chart courtesy of StockCharts.com.
Normally, volatility should decline as price rises and volatility should increase as price falls. Divergence from this normal can provide a bullish or bearish signal for Oil. However, it is noted that this signal occurs both in minor and major lows and it cannot be used to distinguish between them.
There was slight bullish divergence with volatility at the last low for price: as price made a new low volatility did not make a new low.
Volatility may be watched over the next few days if price moves higher. If short term divergence develops, then expect a high is in place. As price rises volatility should decline. If price makes a new high but volatility does not make a corresponding new low, expect a trend change.
Published @ 01:38 a.m. EST.