With an invalidation of the main hourly Elliott wave count below 1,276.10, the alternate hourly Elliott wave count now has confidence.
Summary: A consolidation for a B wave should complete this week. Short term upwards movement should reach a minimum of 1,302.74. Thereafter, a downwards swing should unfold.
The larger trend for at least the mid term remains upwards. The target would be at 1,320 in the first instance. It may be as high as 1,412, but this looks less likely.
Invest only 1-5% of equity on any one trade. Always trade with stops.
New updates to this analysis are in bold.
Last monthly charts for the main wave count are here, another monthly alternate is here, and video is here.
Grand SuperCycle analysis is here.
The wave counts will be labelled first and second. Classic technical analysis will be used to determine which wave count looks to be more likely. In terms of Elliott wave structure the second wave count has a better fit and fewer problems.
FIRST ELLIOTT WAVE COUNT
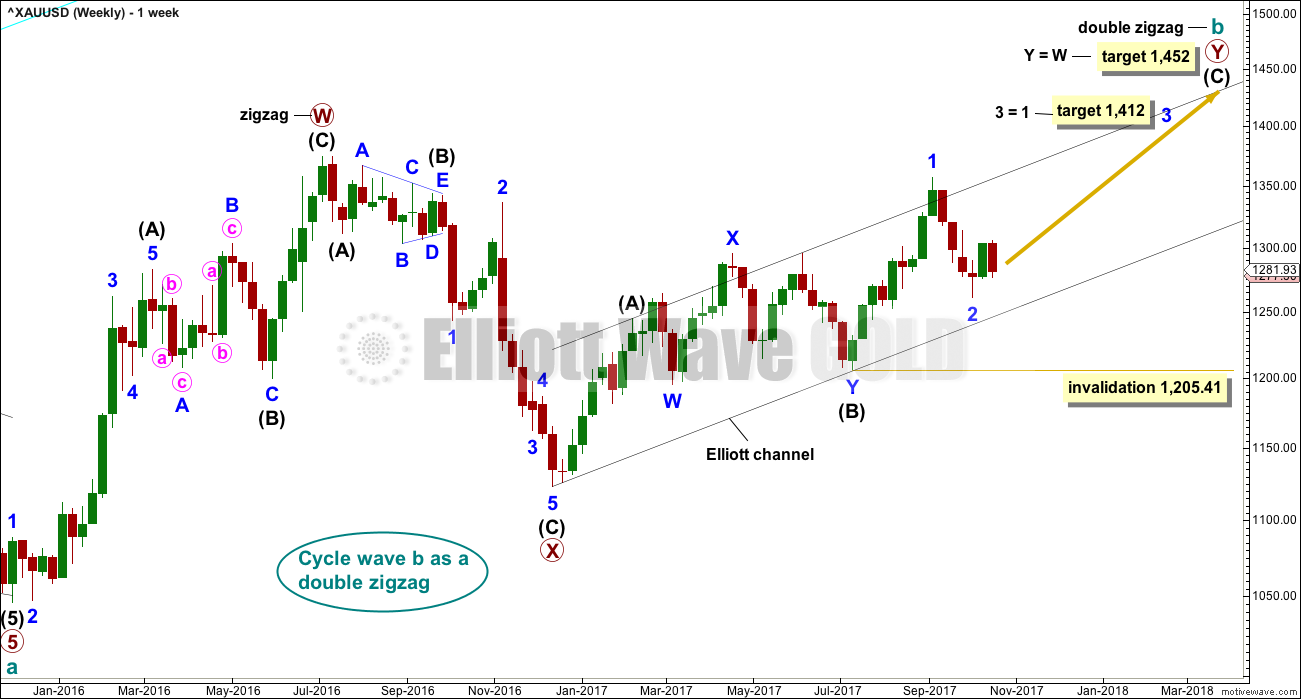
WEEKLY CHART
There are more than 23 possible corrective structures that B waves may take, and although cycle wave b still fits well at this stage as a triangle, it may still be another structure. This wave count looks at the possibility that it may be a double zigzag.
If cycle wave b is a double zigzag, then current upwards movement may be part of the second zigzag in the double, labelled primary wave Y.
The target remains the same.
Within intermediate wave (C), no second wave correction may move beyond the start of its first wave below 1,205.41. However, prior to invalidation, this wave count may be discarded if price breaks below the lower edge of the black Elliott channel. If this wave count is correct, then intermediate wave (C) should not break below the Elliott channel which contains the zigzag of primary wave Y upwards.
There are now three problems with this wave count which reduce its probability in terms of Elliott wave:
1. Cycle wave b is a double zigzag, but primary wave X within the double is deep and time consuming. While this is possible, it is much more common for X waves within double zigzags to be brief and shallow.
2. Intermediate wave (B) within the zigzag of primary wave Y is a double flat correction. These are extremely rare, even rarer than running flats. The rarity of this structure must further reduce the probability of this wave count.
3. Although intermediate wave (C) should be continuing so that primary wave Y ends substantially above the end of primary wave W, the duration and depth of minor wave 2 within it now looks to be too large at the weekly time frame.
DAILY CHART
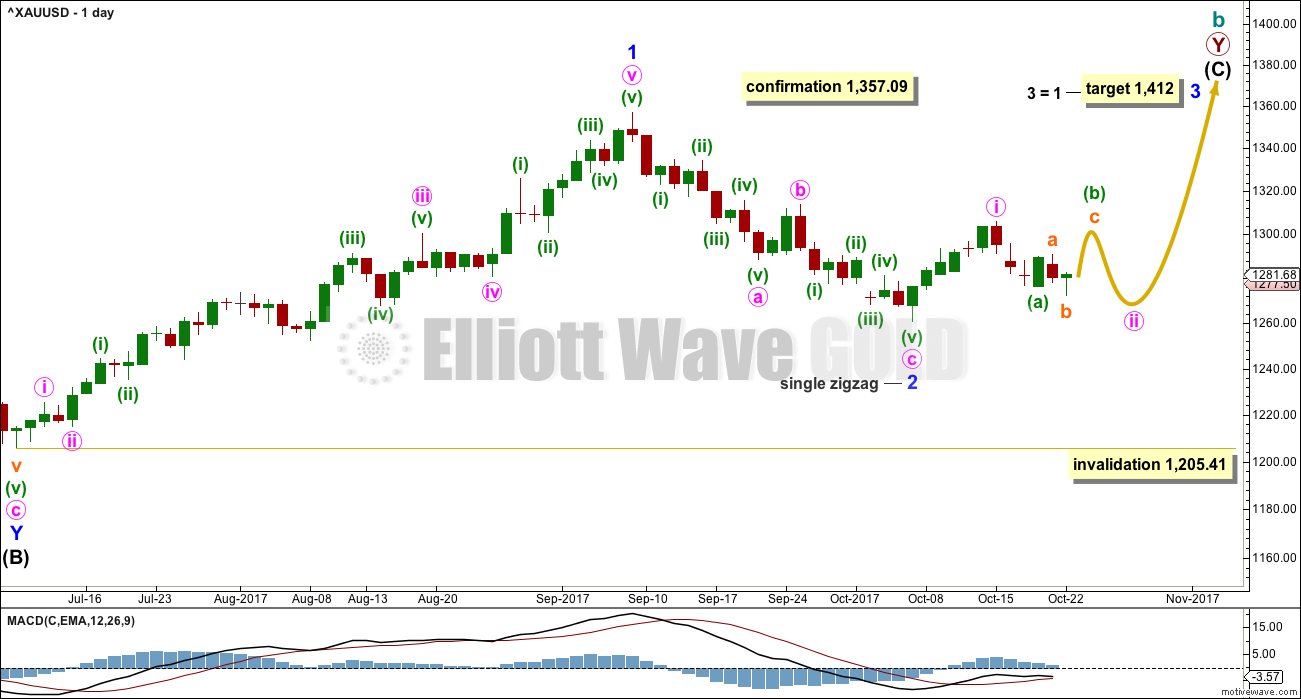
The analysis will focus on the structure of intermediate wave (C). To see details of all the bull movement for this year see daily charts here.
Intermediate wave (C) must be a five wave structure, either an impulse or an ending diagonal. It is unfolding as the more common impulse.
It is possible that minor waves 1 and now 2 may both be over. Minor wave 2 may have ended very close to the 0.618 Fibonacci ratio. If it continues lower, then minor wave 2 may not move beyond the start of minor wave 1 below 1,205.41.
Minor wave 1 lasted 44 days and minor wave 2 may have lasted 20 days, just one short of a Fibonacci 21.
It is of some concern now that minor wave 3 appears to be starting out rather slowly. This is somewhat unusual for a third wave and offers some support now to the second Elliott wave count. With StockCharts data showing a steady decline in volume as price rises, this concern is now validated.
Attention now turns to the structure of minute wave ii. With a slight new low today, minute wave ii cannot be over and may be continuing further as a flat correction. Within minute wave ii, minuette wave (b) may be an expanded flat.
HOURLY CHART
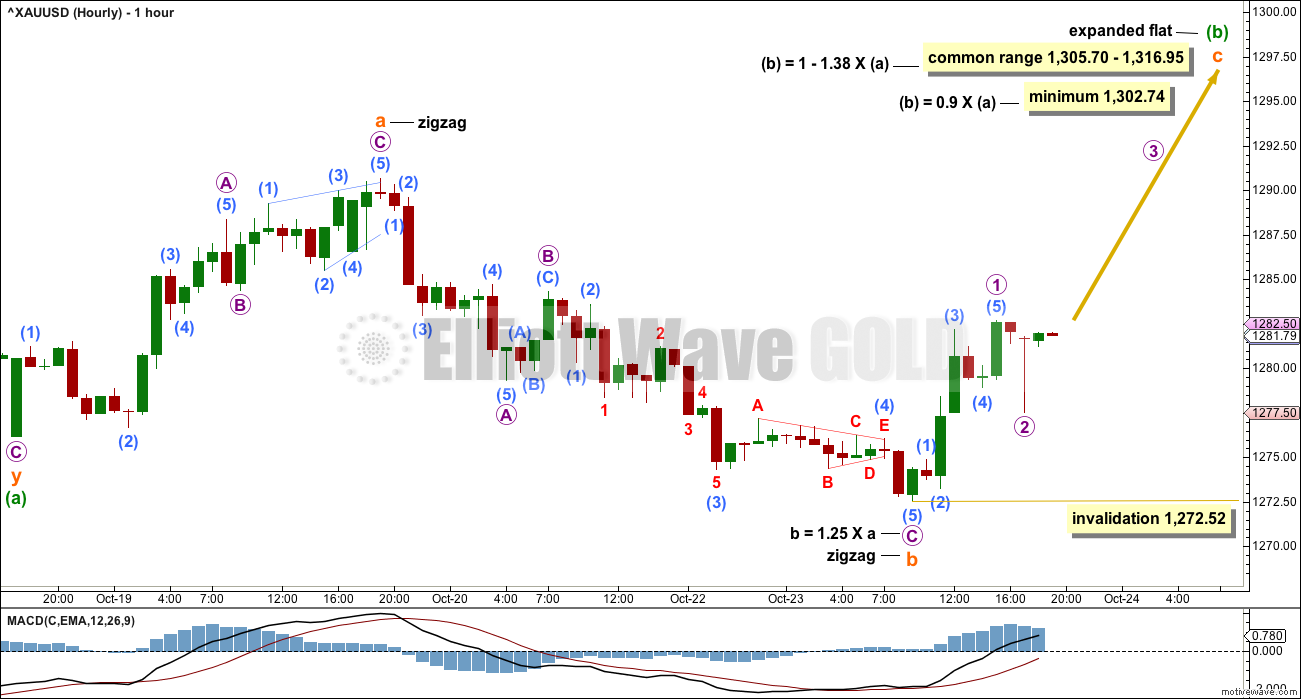
Within minute wave ii, only minuette wave (a) may be complete. Minuette wave (b) may be just over half way through.
Because minuette wave (a) subdivides as a three, minute wave ii may be a flat correction.
The minimum requirement for minuette wave (b) within a flat would be 0.9 the length of minuette wave (a) at 1,302.74. The common range for minuette wave (b) is given on the chart.
Minute wave ii cannot be continuing further as a combination if minuette wave (a) is correctly labelled as a double zigzag. This double zigzag cannot be labelled minuette wave (w) of a continuing combination. The maximum number of corrective structures in a combination is three (this maximum refers to W, Y and Z). To label multiples within multiples is to increase the maximum beyond three and would violate the Elliot wave rule. This is the most common error made by many, so members should always keep this rule in mind when labelling multiples.
Minute wave ii cannot continue further as a triangle as second waves do not subdivide with triangles as their sole corrective structure.
If subminuette wave a is a zigzag, then subminuette wave b must retrace a minimum 0.9 length of subminuette wave a. It has done this today. Subminuette wave b is within the common range for a flat from 1 to 1.38 times the length of subminuette wave a. Subminuette wave b is longer than 1.05 times the length of subminuette wave a, so minuette wave (b) may be an expanded flat.
If subminuette wave c were to be 1.618 the length of subminuette wave a at 1,296, then it would not reach the minimum requirement for minuette wave (b).
The next Fibonacci ratio in the sequence would see subminuette wave c reach 2.618 the length of subminuette wave a at 1,311. This is an area of strong prior resistance and support.
SECOND ELLIOTT WAVE COUNT
WEEKLY CHART
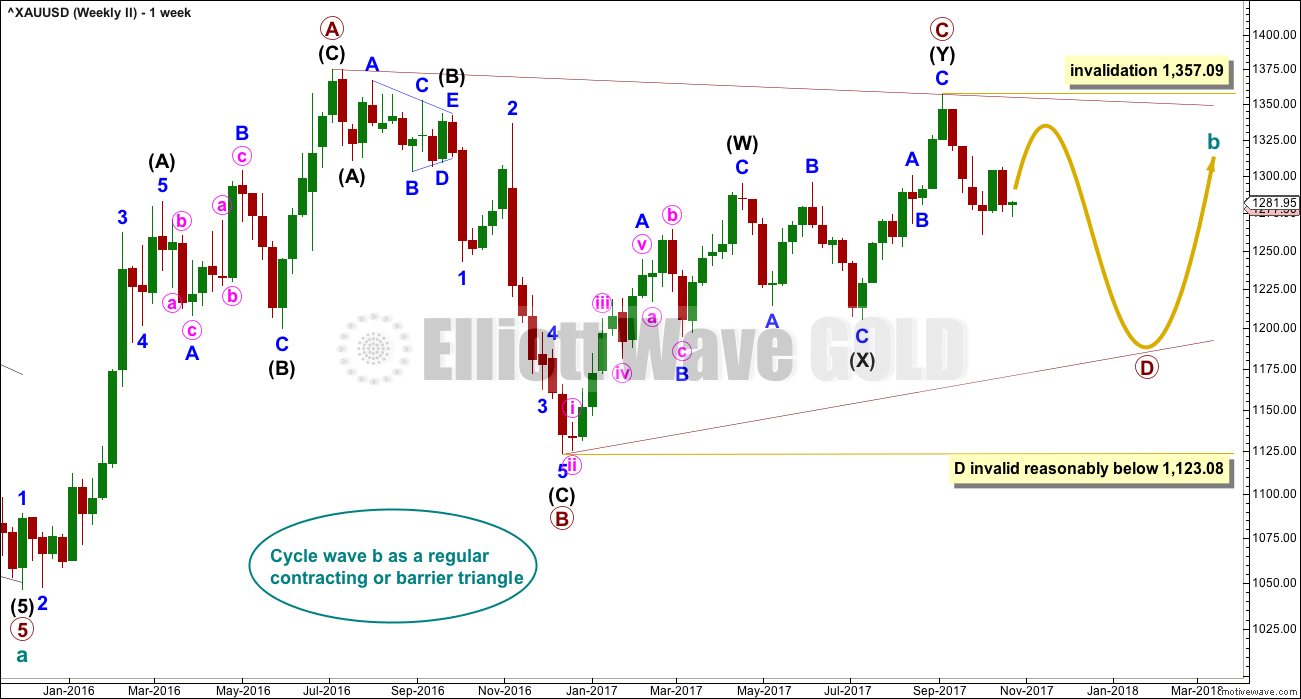
It is still possible that cycle wave b is unfolding as a regular contracting or barrier triangle.
Within a triangle, one sub-wave should be a more complicated multiple, which may be primary wave C. This is the most common sub-wave of the triangle to subdivide into a multiple.
Intermediate wave (Y) now looks like a complete zigzag at the weekly chart level.
Primary wave D of a contracting triangle may not move beyond the end of primary wave B below 1,123.08. Contracting triangles are the most common variety.
Primary wave D of a barrier triangle should end about the same level as primary wave B at 1,123.08, so that the B-D trend line remains essentially flat. This involves some subjectivity; price may move slightly below 1,123.08 and the triangle wave count may remain valid. This is the only Elliott wave rule which is not black and white.
Finally, primary wave E of a contracting or barrier triangle may not move beyond the end of primary wave C above 1,295.65. Primary wave E would most likely fall short of the A-C trend line. But if it does not end there, then it can slightly overshoot that trend line.
Primary wave A lasted 31 weeks, primary wave B lasted 23 weeks, and primary wave C lasted 38 weeks.
The A-C trend line now has too weak a slope. At this stage, this is now a problem for this wave count, the upper A-C trend line no longer has such a typical look.
Within primary wave D, no part of the zigzag may move beyond its start above 1,357.09.
DAILY CHART
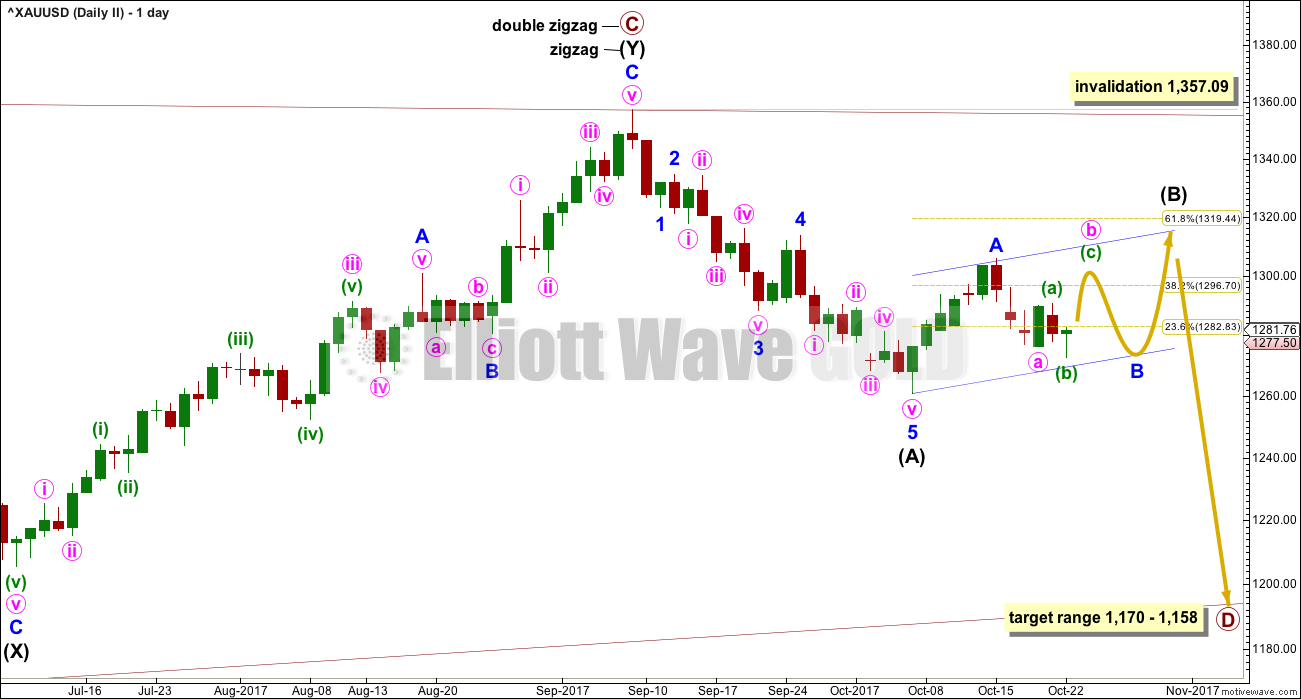
This second wave count expects the new wave down may be deeper and longer lasting than the first wave count allows for.
A common length for triangle sub-waves is from 0.8 to 0.85 the length of the prior wave. Primary wave D would reach this range from 1,170 to 1,158.
If primary wave C is correctly labelled as a double zigzag, then primary wave D must be a single zigzag.
Within the single zigzag of primary wave D, intermediate wave (A) is labelled as a complete impulse.
Intermediate wave (A) lasted twenty days, just one short of a Fibonacci twenty-one. Intermediate wave (B) may be about the same duration, so that this wave count has good proportions, or it may be longer because B waves tend to be more complicated and time consuming.
So far intermediate wave (B) has lasted eleven sessions. If it continues to total a Fibonacci thirteen, it may end in another two sessions. With minor wave B now incomplete, this looks less likely. The next Fibonacci number in the sequence is twenty-one which would see it continue now for another ten sessions.
Intermediate wave (B) may be a sharp upwards zigzag, or it may be a choppy overlapping consolidation as a flat, triangle or combination. At this stage, it looks most likely to be incomplete because an intermediate degree wave should last weeks. At its conclusion intermediate wave (B) should have an obvious three wave look to it here on the daily chart.
Minor wave B may be expected to be an incomplete flat correction in the same way as minute wave ii for the first Elliott wave count. Here, the degree of labelling is one degree higher.
With the new low today, minor wave B may not be continuing sideways as a triangle. The subdivisions do not fit for minute wave a to have ended at today’s low.
One important difference between the two wave counts is here minor wave B may make a new low below the start of minor wave A at 1,260.72, whereas this is an invalidation point for the first Elliott wave count.
HOURLY CHART
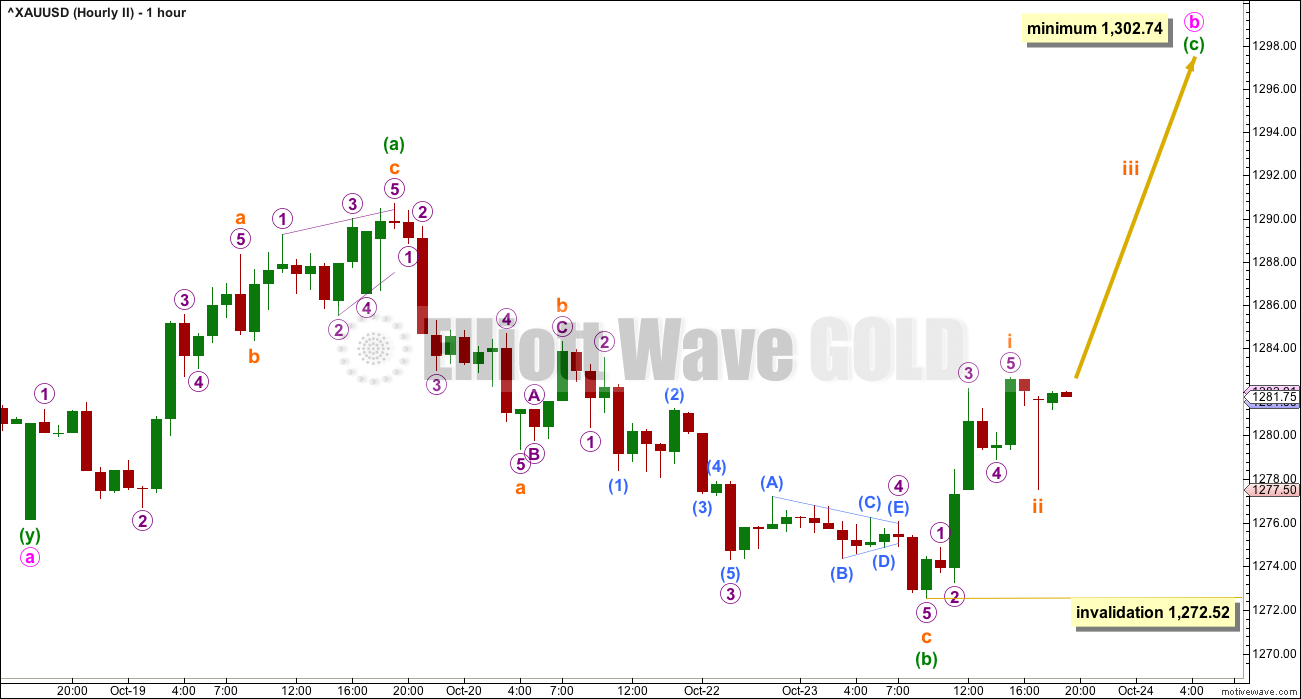
Subdivisions, invalidation points, minimum requirements and targets are the same at this stage for both wave counts.
TECHNICAL ANALYSIS
WEEKLY CHART
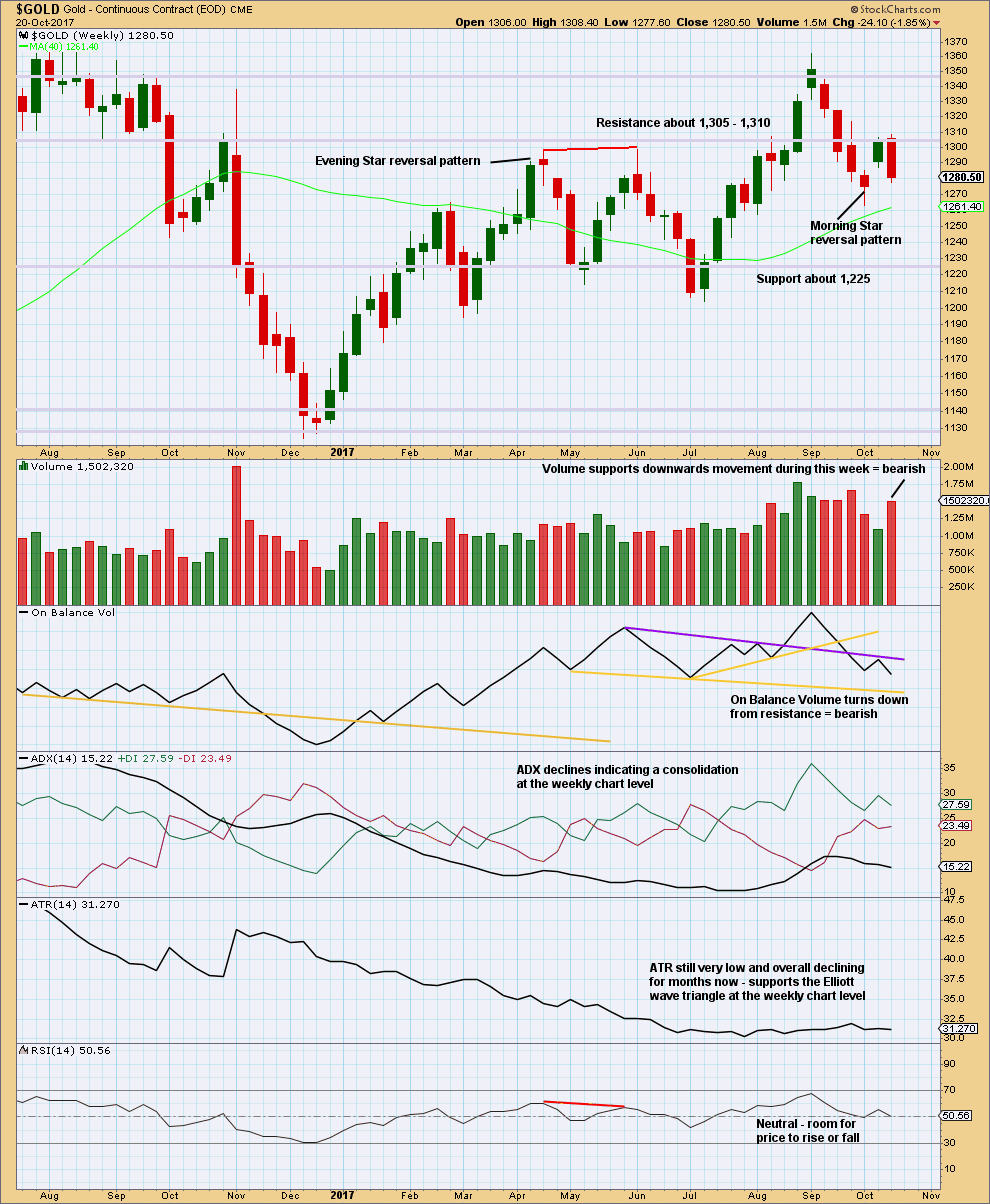
Click chart to enlarge. Chart courtesy of StockCharts.com.
Resistance on On Balance Volume has served to halt the rise in price and initiate a downwards reaction. This weekly candlestick is not correctly a Bearish Engulfing reversal pattern because it does not come after much upwards movement. There is almost nothing to reverse here. But the strong downwards week is certainly bearish.
Support from volume is also very bearish.
The upside may be very limited here.
DAILY CHART
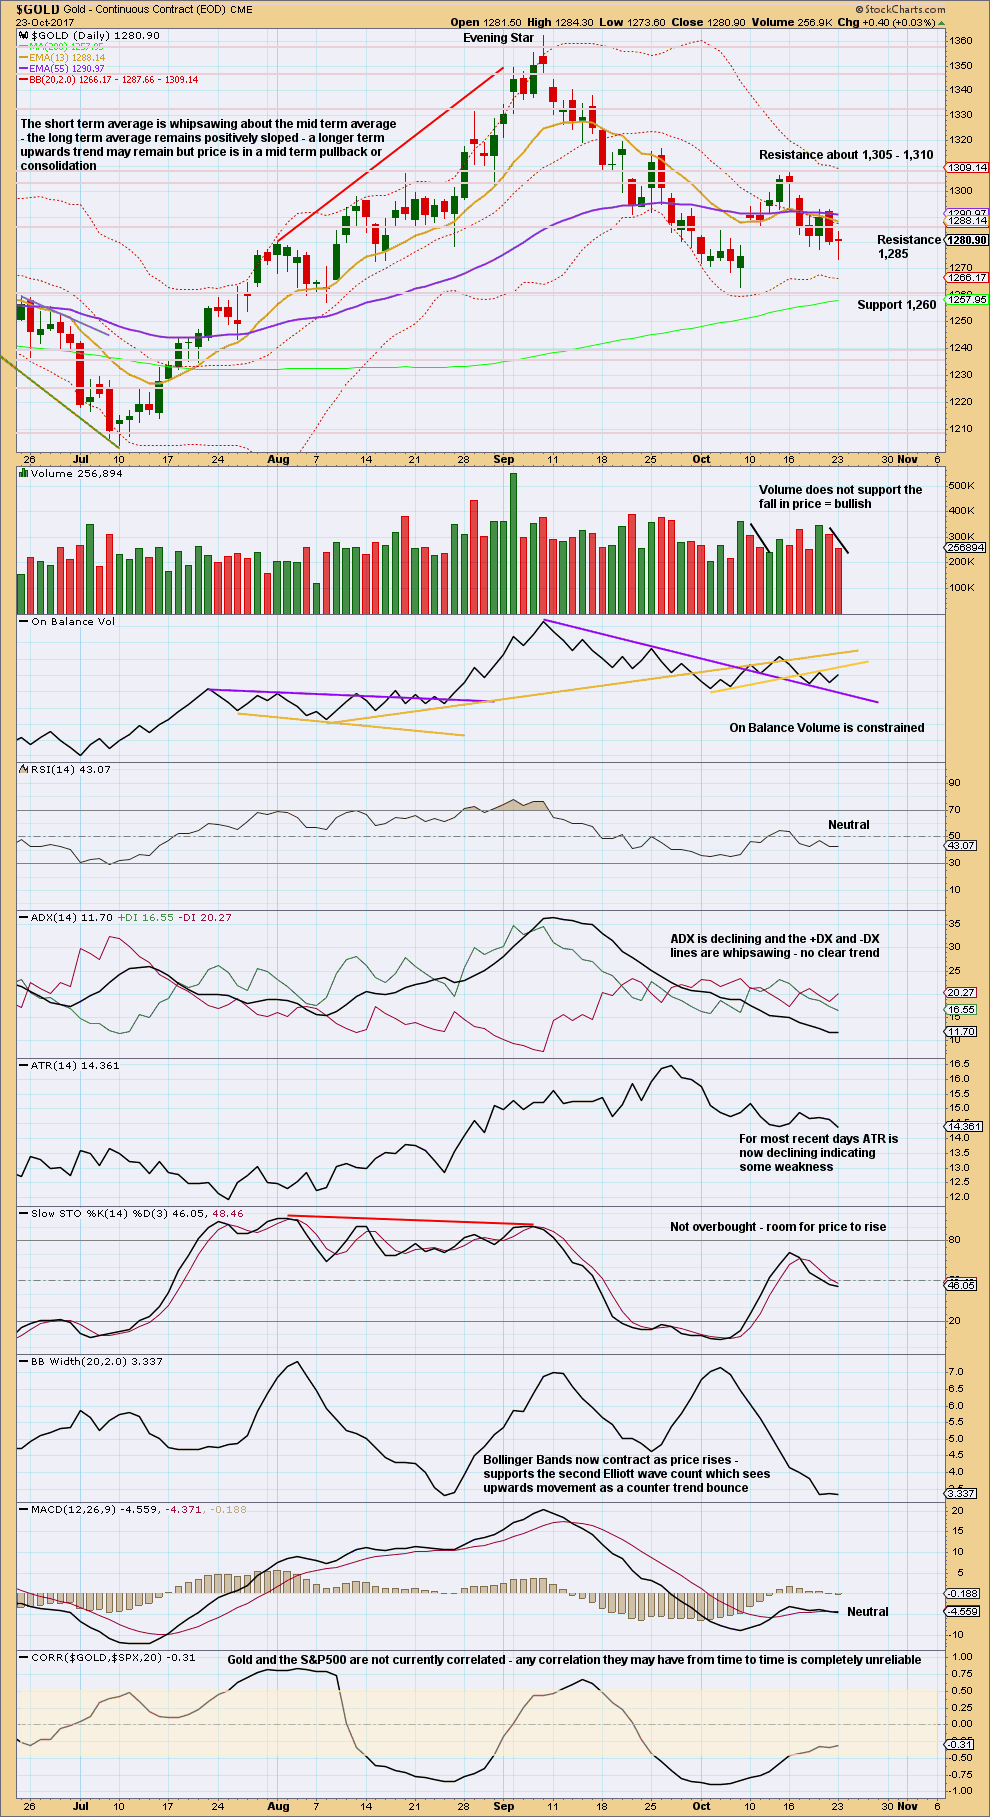
Click chart to enlarge. Chart courtesy of StockCharts.com.
Downwards movement today looks weak with a long legged doji.
This market is consolidating. Within the small consolidation (which is within a larger consolidation), resistance is about 1,305 to 1,310 and support is about 1,260. During this time, it is two upwards days that have strongest volume suggesting an upwards breakout is more likely than downwards.
Published @ 09:31 p.m. EST.

A deep second wave correction? If this downwards move today shows weakness in volume that would support this wave count.
The long lower wick developing and the breach of the small channel supports the idea… so far.
Good stuff. Gold price never made it to the 1284-87 price zone instead grinding lower into the 1270’s. Remains to be seen if an upturn for a break above 1282 can occur before a break below 1272 for 1269/68 occurs. Prefer to stay short Gold (which seems to be struggling to get past pivot/1278)…. Lets see.
Seems everyday i’m short, get stopped out, then reload short. Can’t get a trend going. Not sure what is keeping gold from falling apart here, as i think it really should for a host of reasons, but only getting 5-10 dollar moves. It is definitely trying to bottom. I don’t think it will succeed, but as with everything in the market, it’s not impossible. Will see
happened again lol. Only my broker is making money
maybe time to reload, but this action is wacky
Hi Eli. Staying short is risky. But, with Gold price making lower highs, a tight stop at 1281 or 1283 should work for a break below 1273 for 1269/68. Gold price will likely collapse should a break below 1268 occur lol…. There does not seem to be any purchase yet in going long, with Gold price weak below its pivot. Unclear situation. Matter of judgement (and risk) which way one would want to swing it. Expecting Silver to pullback(drop) which should drag Gold price down with it lol… Happy days. GL!
Alan
Hon. Prime minister of Singapore Mr. Lee Hsien Loong gave a very nice speech in White House rose garden with President Trump on his side.
I was impressed.
Thanks Papudi.
Politics and economics are his forte. I guess also that President Trump had wised up in his dealings with Asia. The abolition of the TPP left America with a weakend influence in Asia, particularly East and South East Asia. China had been only too glad to step into the void, what with the One Belt One Road initiative. If America does not step up their presence in Asia, she will find herself slowly being cut off from a large part of the burgeoning world. Already, the Philippines under President Duterte had shown some resistance to American influence. When push comes to shove with China, many of our nations will be forced to take sides. And as they say, “out of sight, out of mind”.
Hi Dreamer,
Do you know what the symbol in Stock Charts is for gold and do they only do a Daily chart of gold?
Also has anyone used Trade Navigator charts? Are they better than Stockcharts?
StockCharts is $Gold
The USD could cause problems for the bullish gold case if the potential inverse H&S pattern plays out.
The bottom could be in for the USD bullish case longer term, but if this is just another 4th wave for USD, more down to new lows could follow after a bounce short term.
Even though the USD / Gold negative correlation is unreliable, what happens over the next week or so will likely affect gold.
Hi Dreamer,
Yeah, I see the inverse H&S now.
Until now I saw only a 3, 3, 5 expanding flat, for the 4th wave correction, in the bigger downtrend since Dec 2016. Currently in the last leg up of the correction. The big problem with my count being that of disproportion with the earlier 2nd wave correction, from Feb to Mar this year. My 4th is twice as long as the 2nd. So, maybe it is H&S 🙁
The corresponding 2nd wave looks to be a Double zigzag, so there would be alternation with an expanded flat and flats do take longer. I think the disproportion is reasonable.
The H&S could play out with a move higher and still be a 4th wave. That’s the tricky part. Watching the neckline for now.
Ok, thank you Dreamer.
Fed meeting next Tues/Wed. No press conference scheduled, so likely no rate hike. Rate hike more likely at December meeting that includes press conference.
Even without a press conference, the markets will be affected by a statement release.
Maybe Gold and miners bottom near this meeting next week?
GDXJ shows some positive Stochastics divergence, yet OBV leans bearish. The trendline break to the downside as well as the H&S pattern are bearish, yet a possible bullish falling wedge may be in play.
Maybe we get a bounce with Gold that results in little more than a trendline backtest before more down?
That looks more like a head and shoulders than a bullish wedge. However, H&S patterns typically fail at the low end. IMO…Picking a bottom is a losing proposition. Good luck.
GDX should bounce if Gold moves up as Lara expects. That said, the technical profile for GDX at the moment is still bearish.
Even with a bounce, a low below 22.81 is likely in the coming days.