Price continued lower changing the Elliott wave count for the short term. Hourly charts today will show all movement from the last swing high on the 16th of October.
Summary: While price remains above 1,260.72, this downwards movement could still be a second wave correction that may now be complete. A third wave up may begin here.
If price makes a new low below 1,260.72, then the second Elliott wave count would be strongly indicated. A mid term upwards swing would still be expected to begin very soon. The target at this stage would be about 1,305 – 1,310.
Invest only 1-5% of equity on any one trade. Always trade with stops.
New updates to this analysis are in bold.
Last monthly charts for the main wave count are here, another monthly alternate is here, and video is here.
Grand SuperCycle analysis is here.
The wave counts will be labelled first and second. Classic technical analysis will be used to determine which wave count looks to be more likely. In terms of Elliott wave structure the second wave count has a better fit and fewer problems.
FIRST ELLIOTT WAVE COUNT
WEEKLY CHART
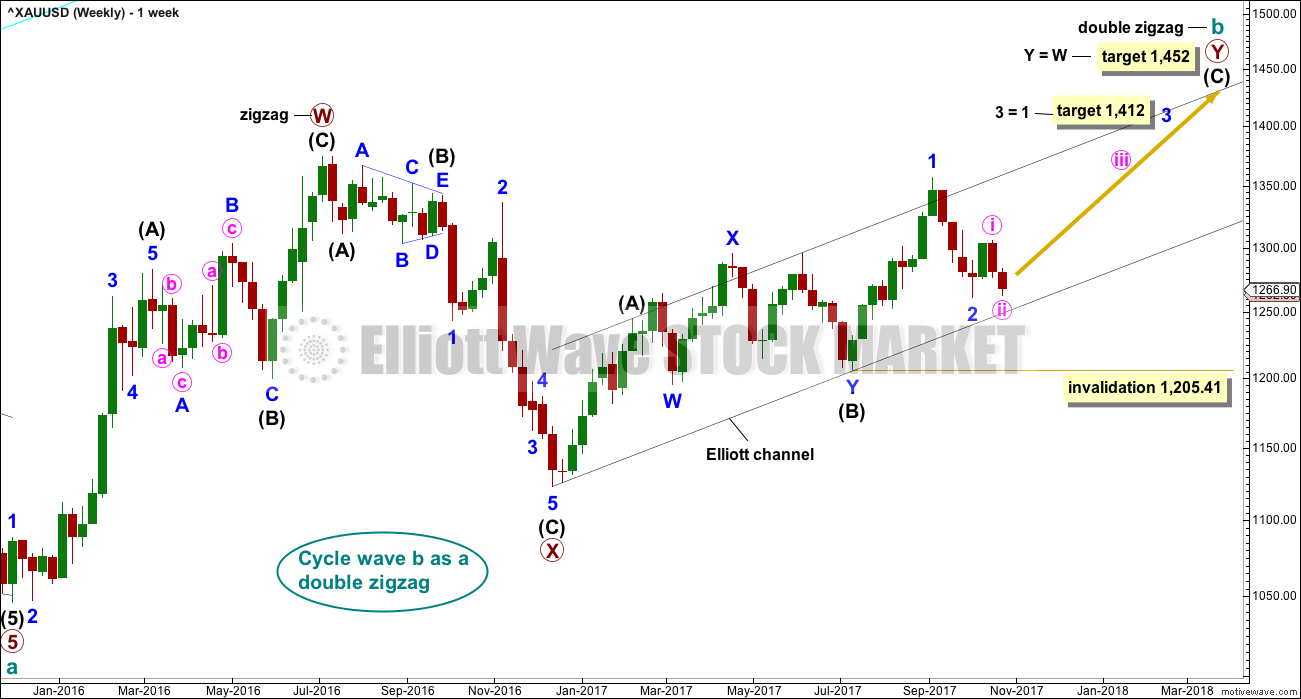
There are more than 23 possible corrective structures that B waves may take, and although cycle wave b still fits well at this stage as a triangle, it may still be another structure. This wave count looks at the possibility that it may be a double zigzag.
If cycle wave b is a double zigzag, then current upwards movement may be part of the second zigzag in the double, labelled primary wave Y.
The target remains the same.
Within intermediate wave (C), no second wave correction may move beyond the start of its first wave below 1,205.41. However, prior to invalidation, this wave count may be discarded if price breaks below the lower edge of the black Elliott channel. If this wave count is correct, then intermediate wave (C) should not break below the Elliott channel which contains the zigzag of primary wave Y upwards.
There are now three problems with this wave count which reduce its probability in terms of Elliott wave:
1. Cycle wave b is a double zigzag, but primary wave X within the double is deep and time consuming. While this is possible, it is much more common for X waves within double zigzags to be brief and shallow.
2. Intermediate wave (B) within the zigzag of primary wave Y is a double flat correction. These are extremely rare, even rarer than running flats. The rarity of this structure must further reduce the probability of this wave count.
3. Although intermediate wave (C) should be continuing so that primary wave Y ends substantially above the end of primary wave W, the duration and depth of minor wave 2 within it now looks to be too large at the weekly time frame.
DAILY CHART
The analysis will focus on the structure of intermediate wave (C). To see details of all the bull movement for this year see daily charts here.
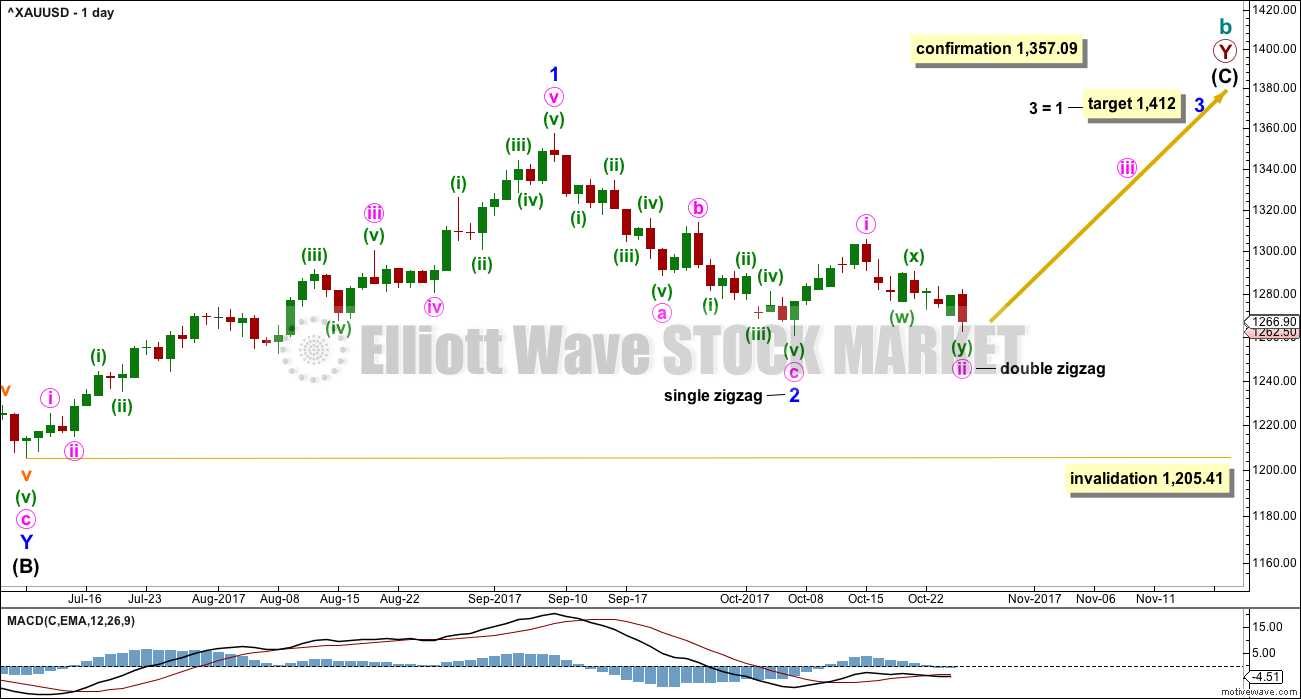
Intermediate wave (C) must be a five wave structure, either an impulse or an ending diagonal. It is unfolding as the more common impulse.
It is possible that minor waves 1 and now 2 may both be over. Minor wave 2 may have ended very close to the 0.618 Fibonacci ratio. If it continues lower, then minor wave 2 may not move beyond the start of minor wave 1 below 1,205.41.
Minor wave 1 lasted 44 days and minor wave 2 may have lasted 20 days, just one short of a Fibonacci 21.
It is of some concern now that minor wave 3 appears to be starting out rather slowly and that minute wave ii within it is now a very deep correction. This is somewhat unusual for a third wave and offers some support now to the second Elliott wave count. With StockCharts data showing a steady decline in volume as price rises, this concern is validated.
Attention now turns to the structure of minute wave ii. Minute wave ii cannot be over and may be continuing further as a flat correction. Within minute wave ii, minuette wave (b) may be an expanded flat.
HOURLY CHART
Downwards movement has continued too far now for a flat correction to be reasonably likely. Wave B within a potential flat would now be too close to twice the length of wave A, beyond that point the idea of a flat should be discarded. It will be discarded slightly before that point today.
A double zigzag will fit neatly within downwards movement. If minute wave ii is over here as a very deep double zigzag, then it may have lasted a Fibonacci eight days.
Because minute wave ii here is so deep, the appropriate Fibonacci ratio to use to calculate a target for minute wave iii is 2.618.
Minute wave ii may not move beyond the start of minute wave i below 1,260.72.
SECOND ELLIOTT WAVE COUNT
WEEKLY CHART
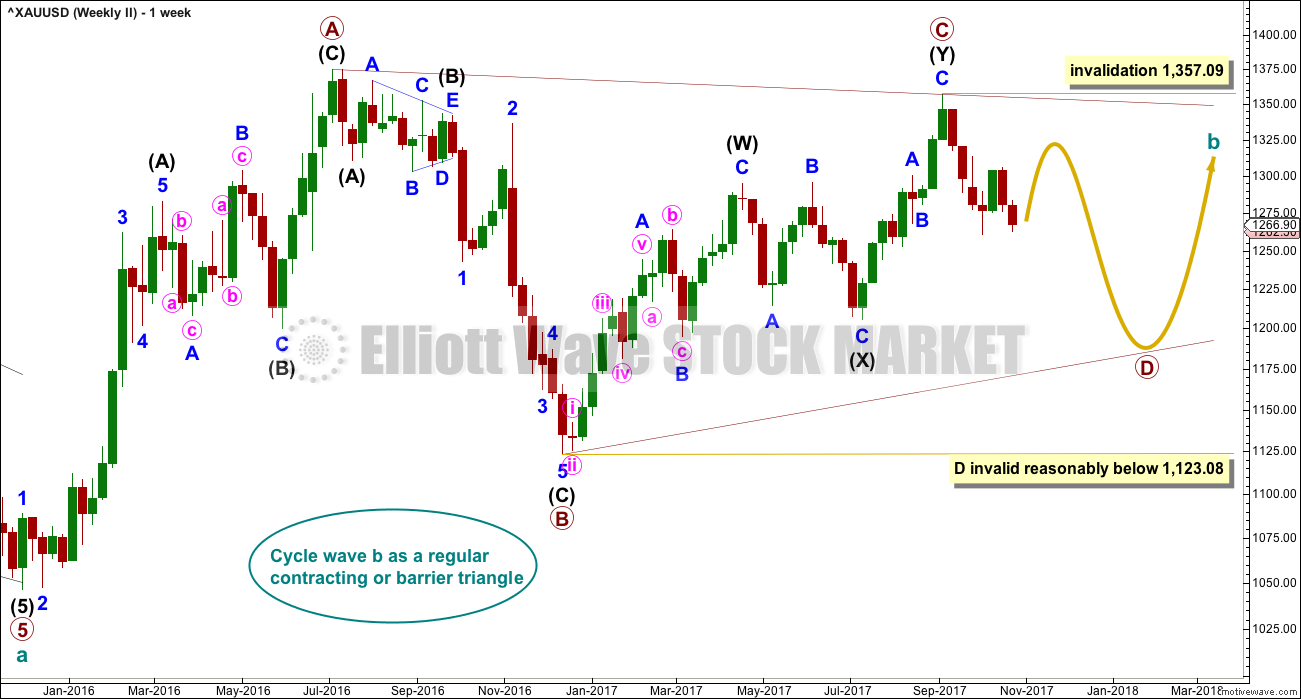
It is still possible that cycle wave b is unfolding as a regular contracting or barrier triangle.
Within a triangle, one sub-wave should be a more complicated multiple, which may be primary wave C. This is the most common sub-wave of the triangle to subdivide into a multiple.
Intermediate wave (Y) now looks like a complete zigzag at the weekly chart level.
Primary wave D of a contracting triangle may not move beyond the end of primary wave B below 1,123.08. Contracting triangles are the most common variety.
Primary wave D of a barrier triangle should end about the same level as primary wave B at 1,123.08, so that the B-D trend line remains essentially flat. This involves some subjectivity; price may move slightly below 1,123.08 and the triangle wave count may remain valid. This is the only Elliott wave rule which is not black and white.
Finally, primary wave E of a contracting or barrier triangle may not move beyond the end of primary wave C above 1,295.65. Primary wave E would most likely fall short of the A-C trend line. But if it does not end there, then it can slightly overshoot that trend line.
Primary wave A lasted 31 weeks, primary wave B lasted 23 weeks, and primary wave C lasted 38 weeks.
The A-C trend line now has too weak a slope. At this stage, this is now a problem for this wave count, the upper A-C trend line no longer has such a typical look.
Within primary wave D, no part of the zigzag may move beyond its start above 1,357.09.
DAILY CHART
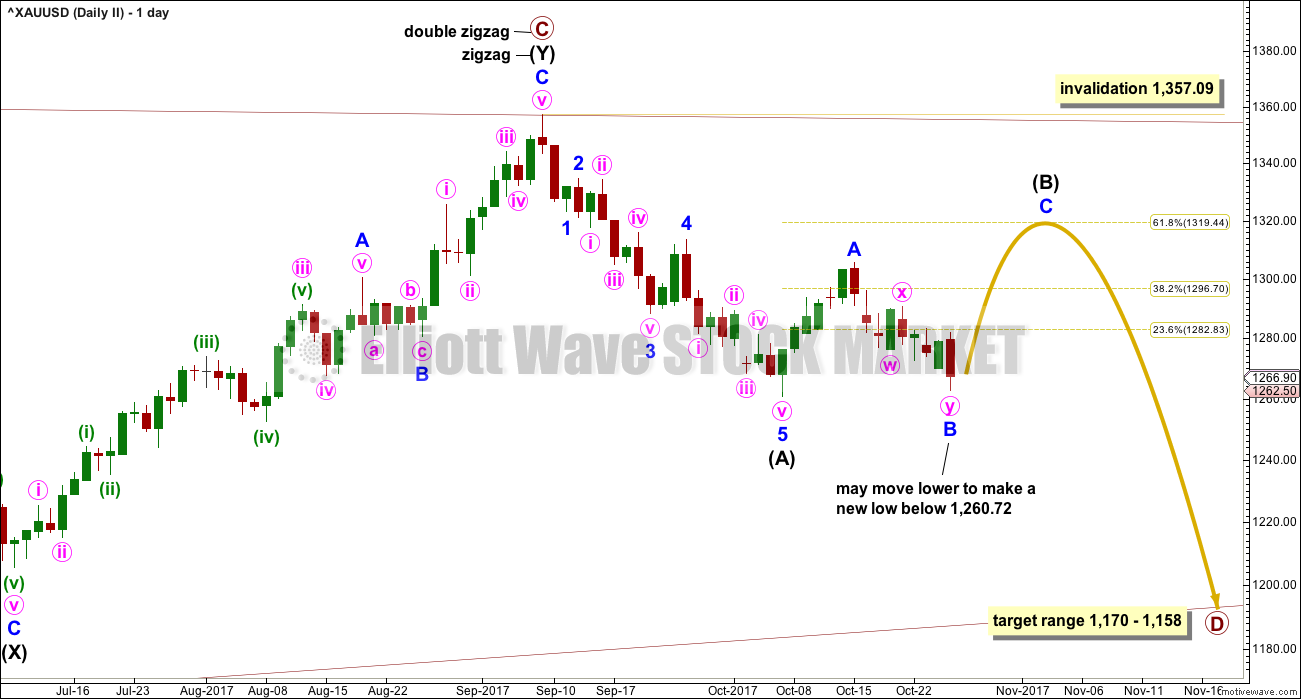
This second wave count expects the new wave down may be deeper and longer lasting than the first wave count allows for.
A common length for triangle sub-waves is from 0.8 to 0.85 the length of the prior wave. Primary wave D would reach this range from 1,170 to 1,158.
If primary wave C is correctly labelled as a double zigzag, then primary wave D must be a single zigzag.
Within the single zigzag of primary wave D, intermediate wave (A) is labelled as a complete impulse.
Intermediate wave (A) lasted twenty days, just one short of a Fibonacci twenty-one. Intermediate wave (B) may be about the same duration, so that this wave count has good proportions, or it may be longer because B waves tend to be more complicated and time consuming.
So far intermediate wave (B) has lasted fourteen sessions. The next Fibonacci number in the sequence is twenty-one which would see it continue now for another seven sessions.
Intermediate wave (B) may be a sharp upwards zigzag, or it may be a choppy overlapping consolidation as a flat, triangle or combination. At this stage, it looks most likely to be incomplete because an intermediate degree wave should last weeks. At its conclusion intermediate wave (B) should have an obvious three wave look to it here on the daily chart.
The idea of a flat correction continuing for minor wave B is discarded. Minor wave B may be complete here or close to completion as a double zigzag.
Minor wave A will subdivide as either a five wave impulse or a three wave zigzag. If it is seen as a zigzag, then the whole structure for intermediate wave (B) may be a flat correction, which would allow for minor wave B to move below the start of minor wave A at 1,260.72.
HOURLY CHART
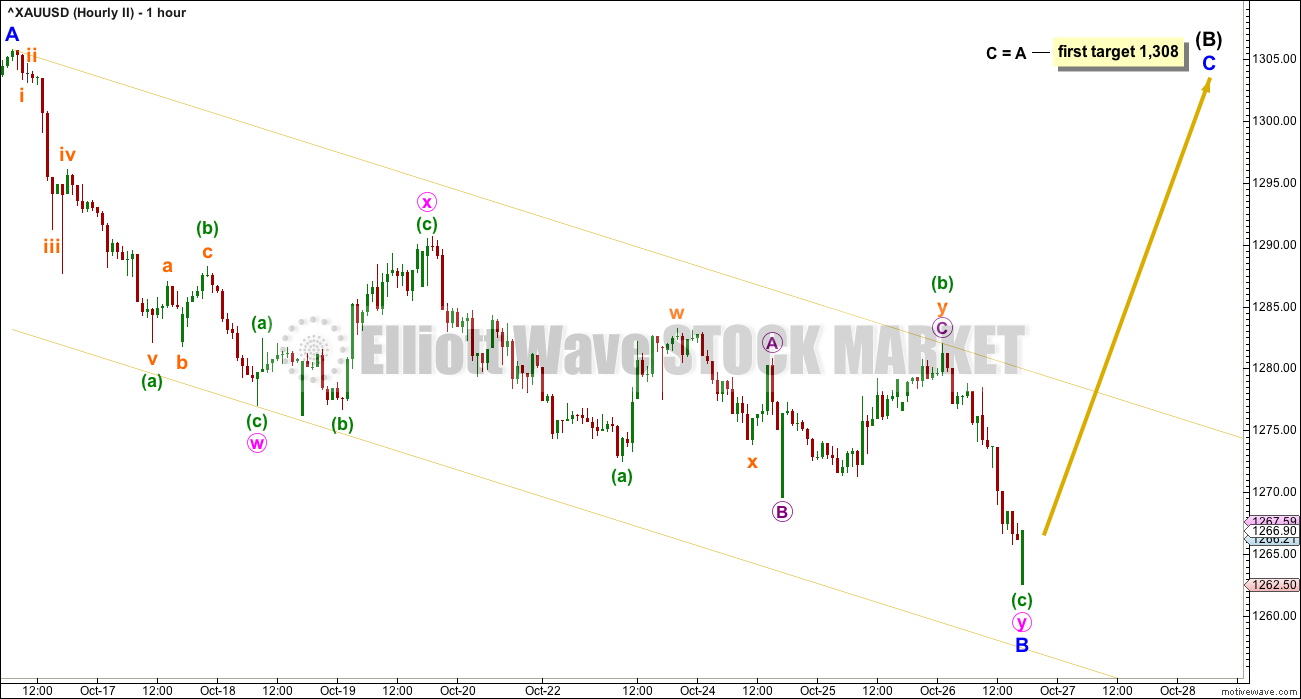
The best fit channel absolutely needs to be breached before members may have any confidence that a low is in place. While price remains within the channel, the risk that it may continue lower must be accepted.
TECHNICAL ANALYSIS
WEEKLY CHART
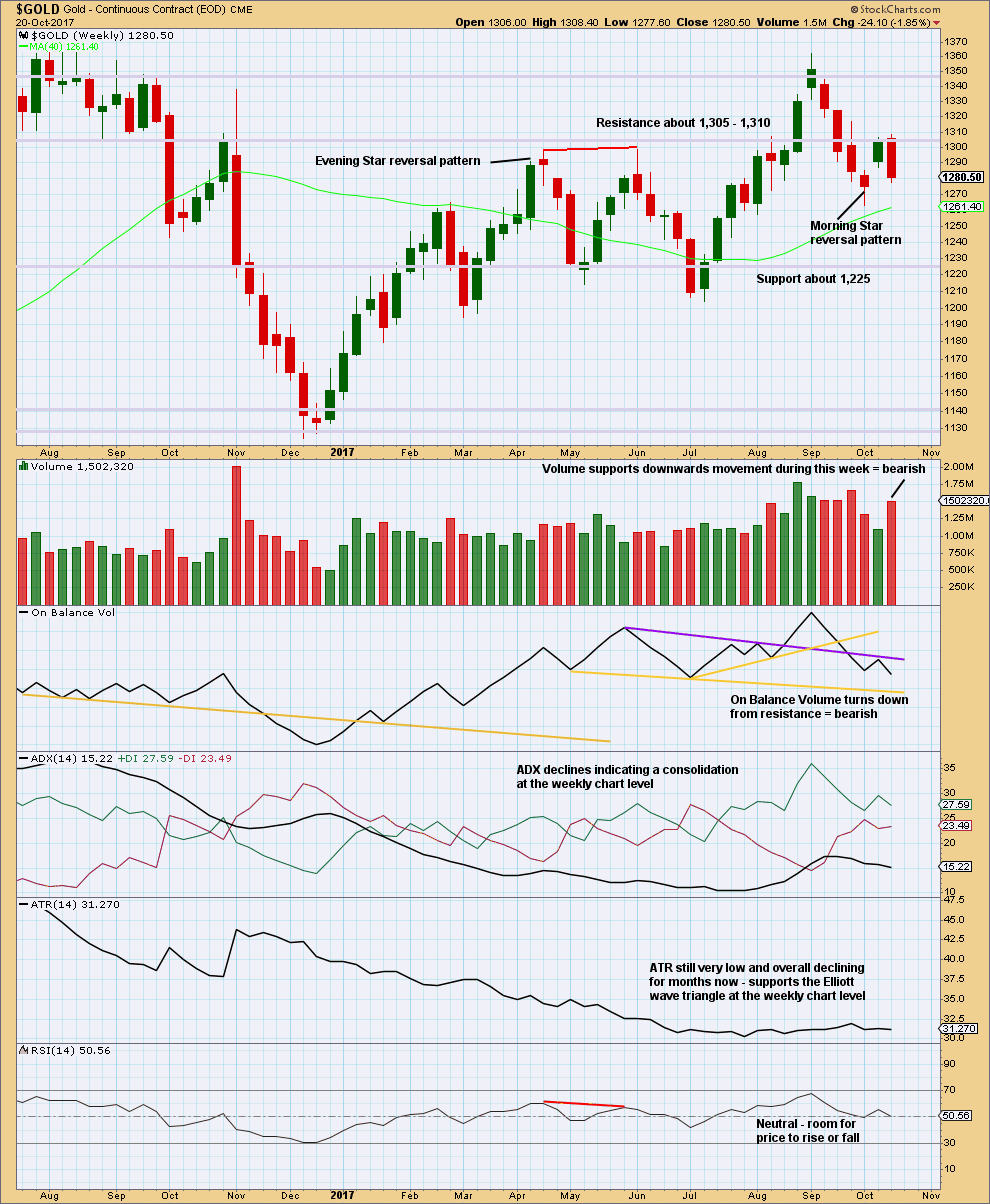
Click chart to enlarge. Chart courtesy of StockCharts.com.
Resistance on On Balance Volume has served to halt the rise in price and initiate a downwards reaction. This weekly candlestick is not correctly a Bearish Engulfing reversal pattern because it does not come after much upwards movement. There is almost nothing to reverse here. But the strong downwards week is certainly bearish.
Support from volume is also very bearish.
The upside may be very limited here.
DAILY CHART
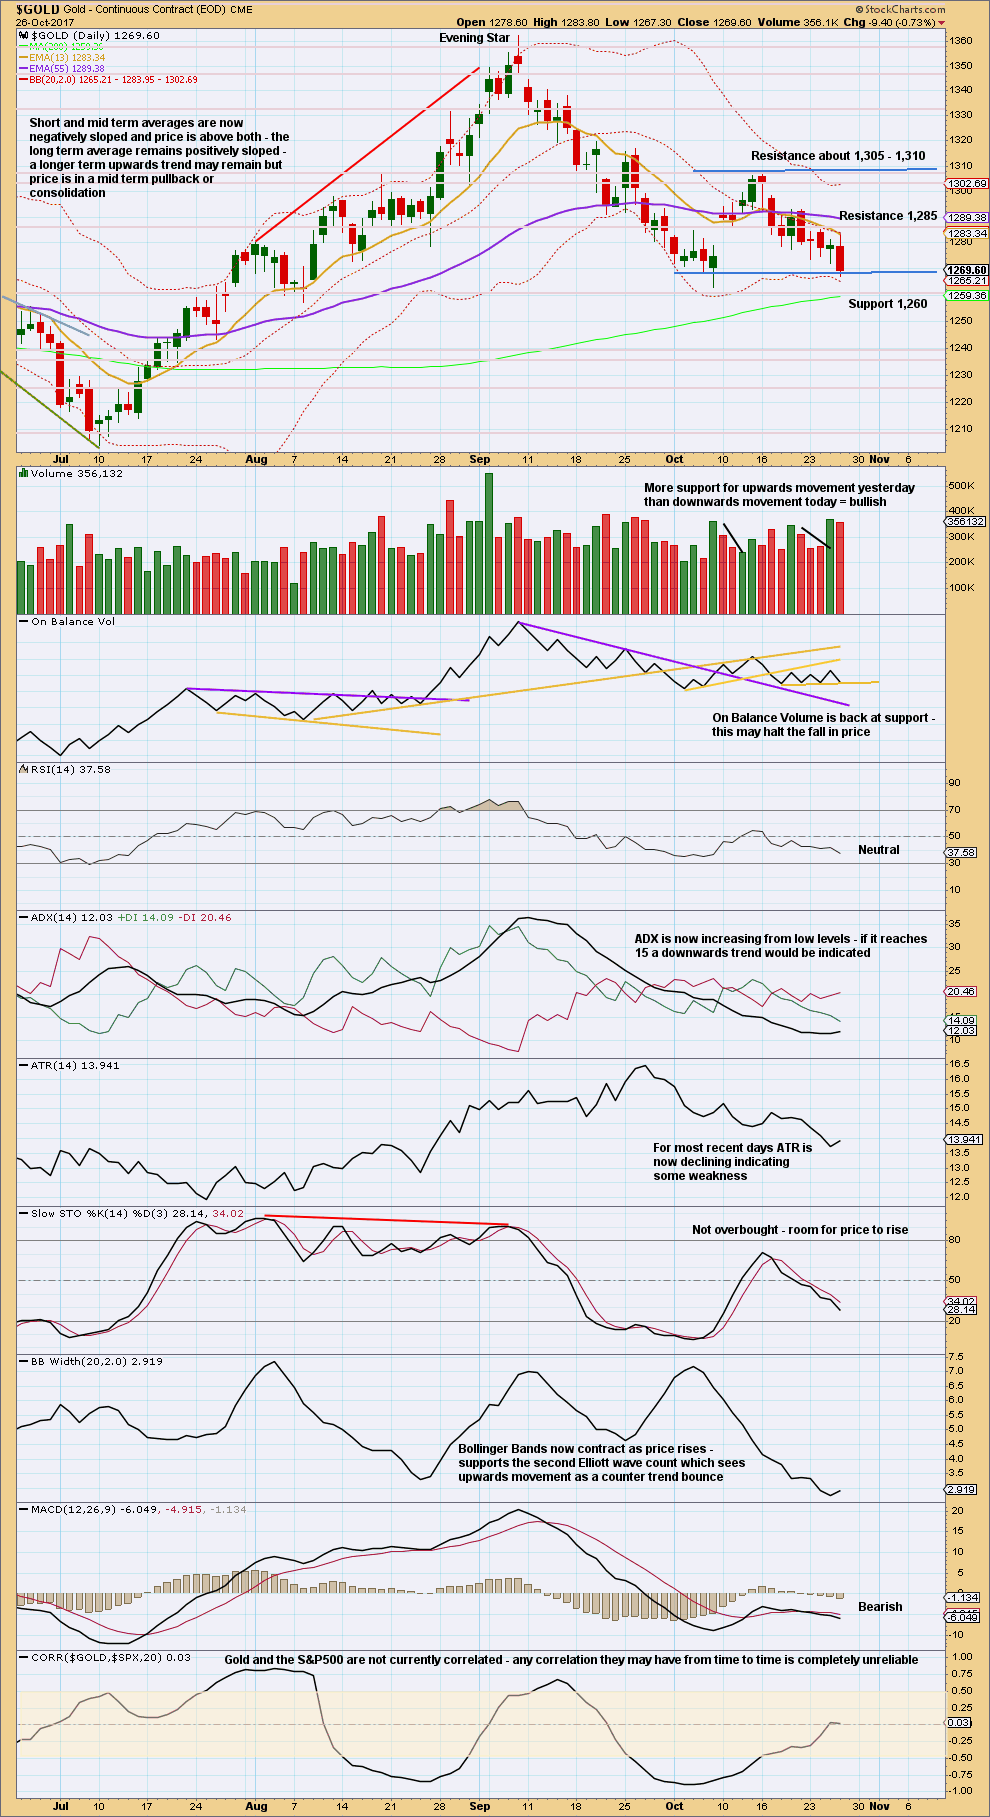
Click chart to enlarge. Chart courtesy of StockCharts.com.
An outside day completes with a balance of volume downwards. Some small decline in volume did not offer as much support today to downwards movement within the session as it did for upwards movement during yesterday’s session.
On Balance Volume is now tracing out a good sideways range. The short yellow support line has now been tested three times and is horizontal. This should offer reasonable support.
Published @ 06:15 p.m. EST.

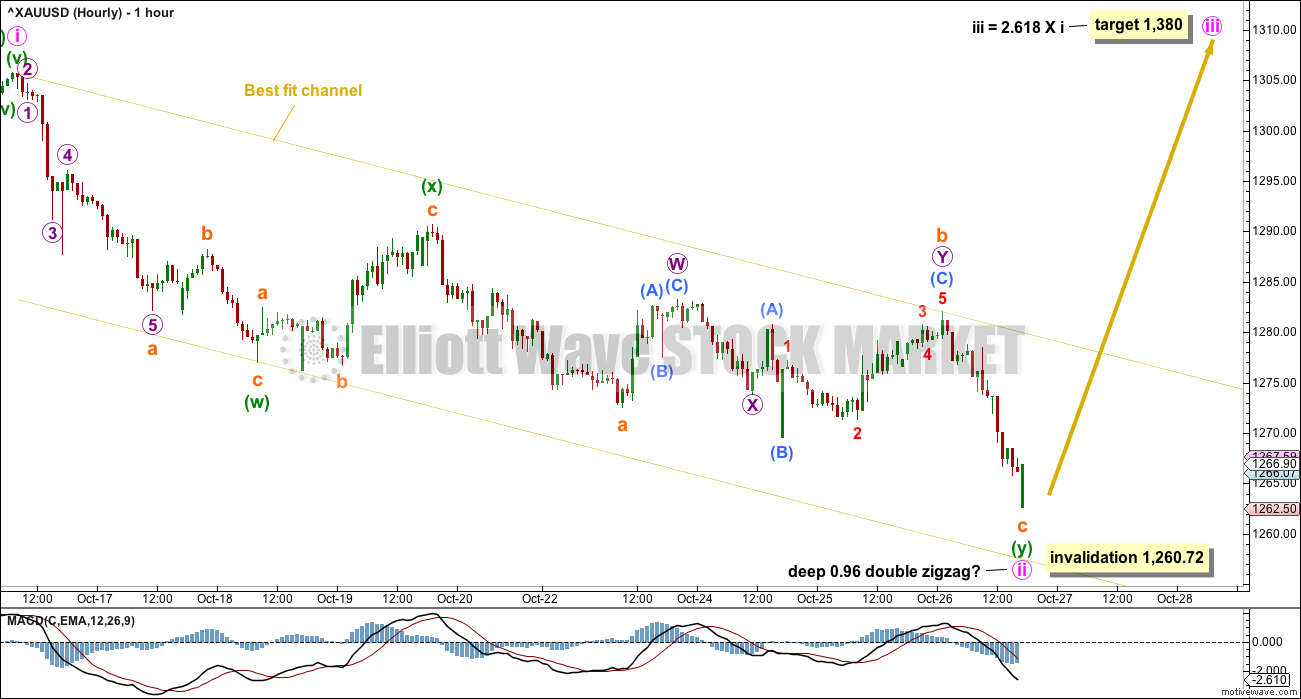
So far the low is holding and minute ii remains 0.96 X minute i. Both wave counts remain valid.
The best fit channel which is now rather wide is being breached to the upside, but again BarChart is showing a big spike on the hourly chart. As Dreamer has noted, these spikes appear to be predictive of the next move in Gold. They don’t always seem to be great for timing, but they do seem to generally work.
and the spike has disappeared… price has not yet breached the channel.
Hi Lara,
Would you be able to update your GDX charts this weekend?
Thanks,
Jennifer
Yes.
For a while I have been watching the commercial gold positions. They very closely correlate the price of gold in the future. When they get heavily negative there is almost sure to be a correction. While ew can help show what the outcome of this move might be it has rarely correctly predicted the direction of a gold move without being in concert with the commercial position. Be very wary of euphoria or depression in the gold market. Check what the commercials are doing. If they are going heavy short then you best step aside. If they are going heavy long then it is time to start allocating cash. The speculators take the opposite side and are most heavily long during euphoria. (Let’s say 275k contracts or so). They are closer to neutral during bottoms (say 100k or less contracts positive). So yes, look at ew but make sure your commercials are in alignment. This will save you a lot of money and make you a lot of money in the future. I don’t know how the commercials are almost always right. Perhaps they are big banks that know fed moves beforehand. I just know they are right. Best of luck all, remember Lara’s advice to limit your investment to five percent or so in a given area.
D GO,
Can you explain further where they are right now? Are they heavy long now?
Thank you.
This should help visualize where the gold COT structure is at right now. It should updated shortly with this week’s numbers just out, which show some commercial short covering, and the beginning of some long liquidation by speculators. As you’ll see, it s a long ways away from the bottom back during the summer. If this is a real bull market, we shouldn’t expect it to get back to that point, but probably needs some more balancing before next big move up. Of course, this doesn’t work perfectly but it helps to be in line with the trends shown
http://snalaska.com/cot/current/charts/GC.png
http://news.goldseek.com/COT/1509132692.php
Reported every Friday on goldseek.com. These positions are for the tues earlier in the week. Commercials are about 210k short. Specs about 190k long. Since this was for tues the price of gold has dropped since then. Therefore the commercials probably removed some shorts and they are probably less than 200k net short. If you look at the table above when the specs get net long about 150k to 175 k during a bull market this is usually near a low. In a bear market the low is closer to 50 k net long for specs. I know this can be confusing. it is hard to pick a sudden turn with this but in conjunction with Lara’s analysis you should be able to fine tune into another turn. All the best. It is up in the air whether this is a bull or bear trend with the dollar breaking out a bit here. It is just another useful tool.
I wonder… how can NASDAQ go up and metals down. Look at copper !?
Lastly, here is a recent Rambus public post. He is bullish the USD.
https://rambus1.com/2017/10/25/weekend-report-143/
Here’s a 5 yr chart showing Gold and it’s Correlation to the USD.
The USD is often inversely correlated (pink area) to Gold, but the USD is just as often with no correlation to Gold (white area). Rarely is the USD positively correlated with Gold (green area).
So overall, it’s difficult for Gold to rise when the USD rises, but it does happen on occasion. If the channel shown in the USD chart below is broken to the upside, It’s likely that Gold will not go up to new highs.
Many seem to be looking at the $USD action and it’s breakout yesterday of an inverted H&S.
This chart takes a look at a possible count from the top in early 2017. The USD could be in a 4th wave correction up. If this is correct, it will likely work it’s way higher over the next 8-10 days before turning down again.
It could also breakout of the channel and continue higher, signaling that the TOP is not in yet. This would match Lara’s last USD analysis. She thinks the TOP is not in.
https://www.tradingview.com/x/OcFAgihI/
In the monthly time frame, it does look like a fourth wave. If it is a five wave down move, then after a three wave counter, there should be more down move in the dollar?
The second wave correction lasted almost two years starting 2012. This correction occurring after the five waves up from 2011, could be expected to last as long or longer than two years?
Throw in a few triangles and diagonals at the appropriate wave levels for more sideways movement?
On another note I am looking at DXY, monthly, since 1971. And it looks like it has been side stepping down since then.
The previous image showing the stair stepping down. This is the image showing an earlier 2nd wave up and what appears like the 4th wave up now.
Gold price may have made the high of the day already at around 1268. Lucky if Gold price can get past there for 1270/pivot with 1277 as limiting possibly to correct oversold levels. ADX is up, only helps strengthen the downside! DMI & CCI point for lower prices to follow. What a disaster; a test and break below 1260 is probably on the cards… GL folks.