
Last analysis expected a little more downwards movement to either 16.347 or possibly as low as 15.799 – 15.649. The low came one day after last analysis was published at 16.311, just 0.038 below the first target.
Summary: Look out for a pullback here or very soon. Weakness in upwards movement suggests it may be sooner rather than later. If price remains above 16.311, the first bullish Elliott wave count will remain viable. A new low now below 16.311 would see the second more bearish Elliott wave count increase in probability.
New updates to this analysis are in bold.
Last monthly chart is here.
ELLIOTT WAVE COUNTS
FIRST WAVE COUNT
WEEKLY CHART
Click chart to enlarge.
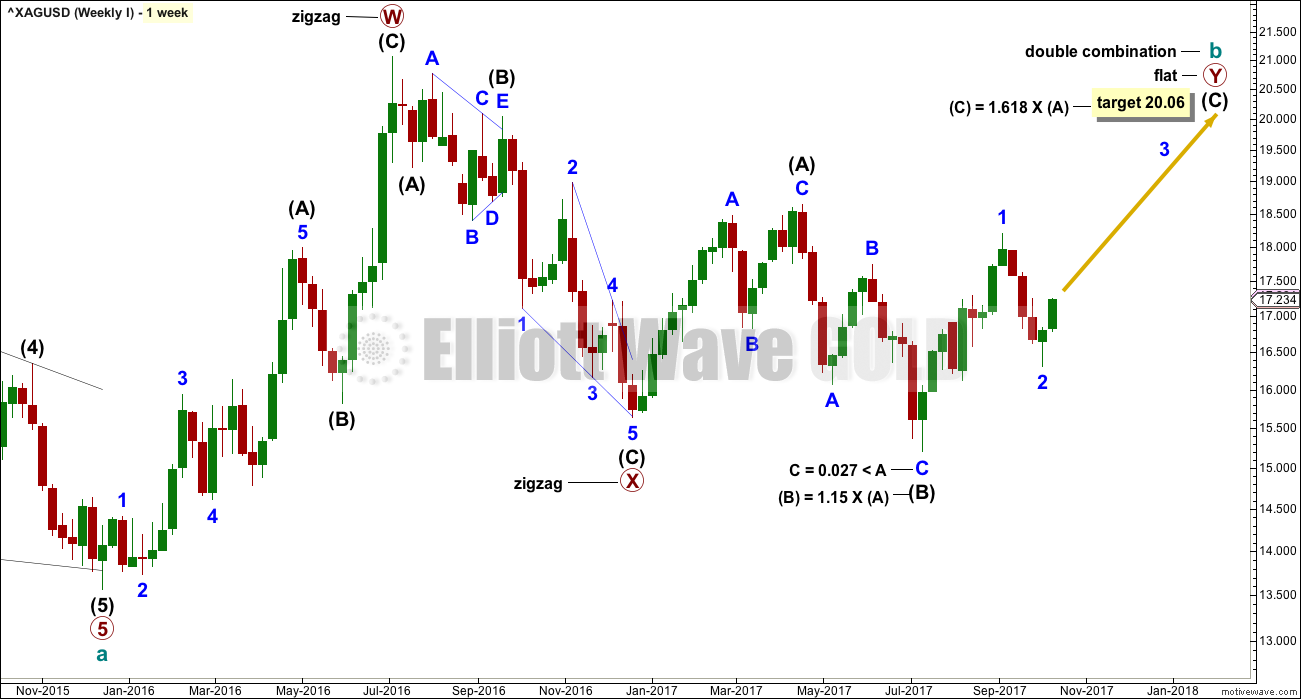
Cycle wave b may be completing as a double combination: zigzag – X – flat. The second structure, a flat correction for primary wave Y, may be underway.
Within a flat correction, intermediate wave (B) must retrace a minimum 0.9 length of intermediate wave (A) at 15.938. Intermediate wave (B) has met this minimum requirement; the rule for a flat correction is met. Intermediate wave (B) is longer than 1.05 times the length of intermediate wave (A) indicating this may be an expanded flat. Expanded flat corrections are the most common type. Normally their C waves are 1.618 or 2.618 the length of their A waves.
The target calculated would see primary wave Y to end close to same level as primary wave W about 21.062. The purpose of combinations is to take up time and move price sideways. To achieve this purpose the second structure in the double normally ends about the same level as the first.
While the combination wave count at the weekly chart level does not currently work for Gold, it does still work for Silver. They do not have to complete the same structures for cycle wave b, and fairly often their structures are different.
DAILY CHART
Click chart to enlarge.
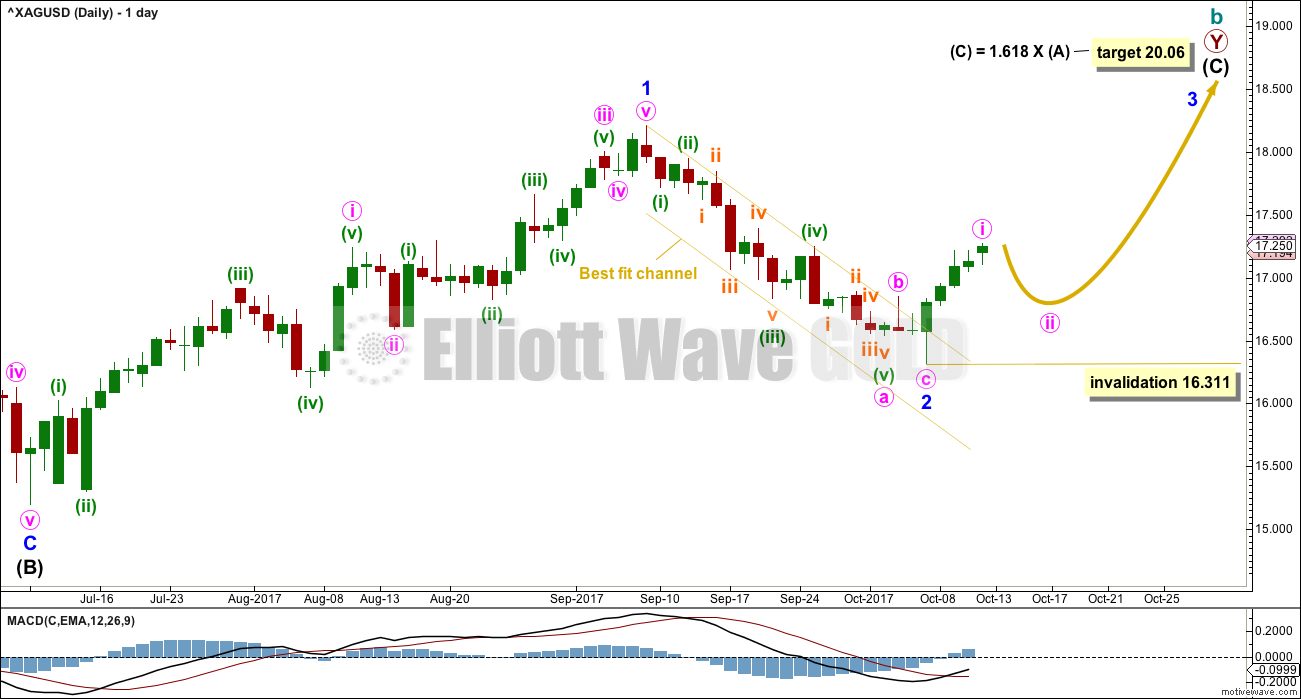
For this first wave count, upwards movement for intermediate wave (C) must subdivide as a five wave structure. It may be unfolding as an impulse.
Within the impulse of intermediate wave (C), only minor wave 1 was over at the last high and now minor wave 2 may now be complete. If it continues lower, then minor wave 2 may not move beyond the start of minor wave 1 below 15.197.
Minor wave 2 may have ended very close to the most likely point of the 0.618 Fibonacci ratio of minor wave 1 at 16.347.
Minor wave 1 lasted 44 days. Minor wave 2 may have completed in 20 days, just one short of a Fibonacci 21.
Minor wave 3 may only subdivide as an impulse. It would be very likely to show its subdivisions clearly at the daily chart level. Minute waves ii and iv within it should show up as multi day pullbacks or sideways consolidations. Look out for minute wave ii to be relatively deep.
Minute wave ii may not move beyond the start of minute wave i below 16.311.
SECOND WAVE COUNT
WEEKLY CHART
Click chart to enlarge.
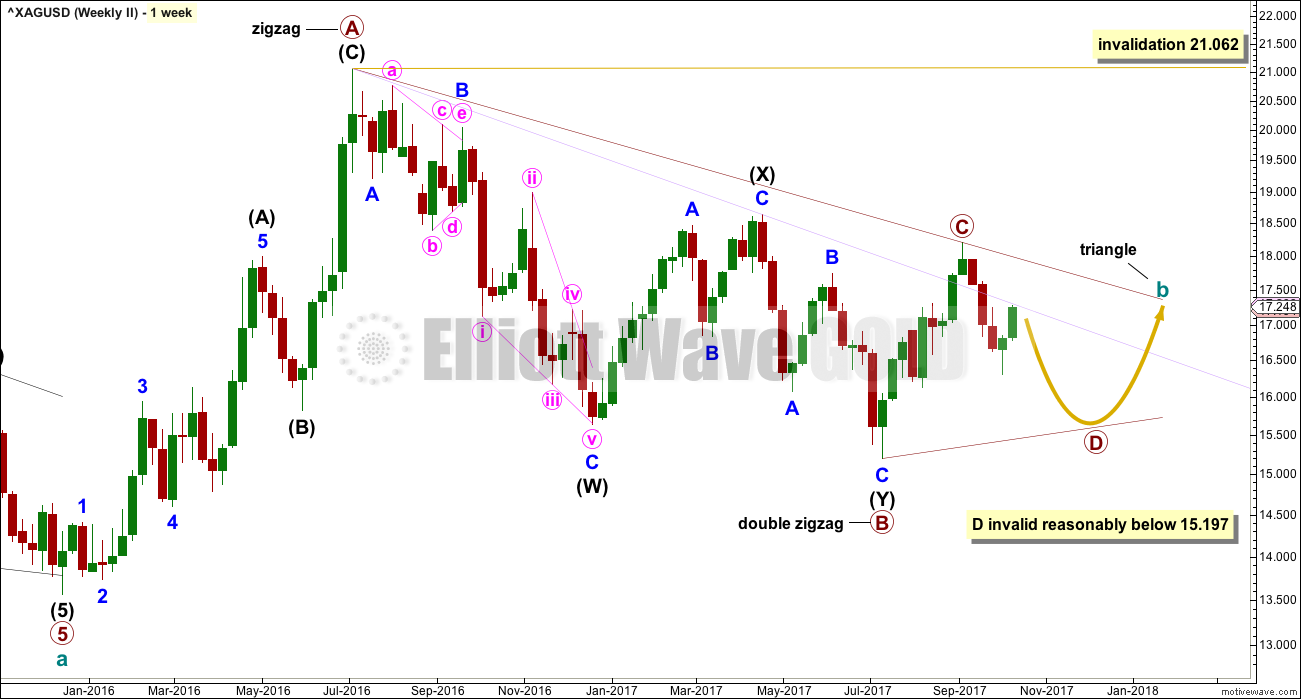
It remains possible for Silver that a large regular contracting or regular barrier triangle may be completing.
Within a triangle, one of the sub-waves must be a more complicated multiple, usually a multiple zigzag. This may be complete for primary wave B.
Primary wave C upwards may now be complete. The upper A-C trend line does have a fairly steep slope though, so it must be accepted that primary wave C may not be over and may continue higher. If it does, it may not move beyond the end of primary wave A above 21.062.
Primary wave C must subdivide as a three wave zigzag.
DAILY CHART
Click chart to enlarge.
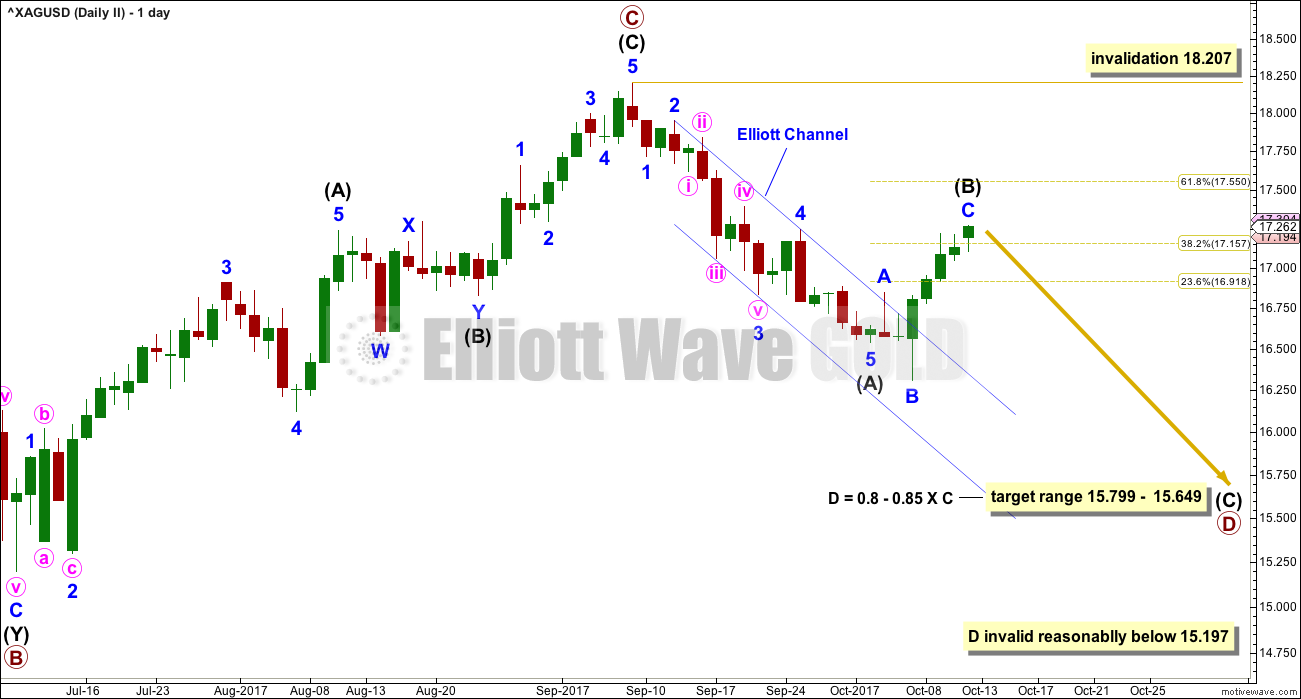
Primary wave C now looks complete and primary wave D downwards looks to have begun for this wave count. Primary wave D downwards must subdivide as a zigzag, which subdivides 5-3-5.
Primary wave D of a contracting triangle may not move beyond the end of primary wave B below 15.197.
Primary wave D of a barrier triangle may end about the same level as primary wave B at 15.197; as long as the B-D trend line is essentially flat, the triangle will remain valid. Unfortunately, there is some subjectivity in this rule; it is not black and white.
Within primary wave D, intermediate wave (A) now looks like a complete impulse. Intermediate wave (B) may now be complete as an expanded flat correction ending just a little above the 0.382 Fibonacci ratio of intermediate wave (A). It is still entirely possible that intermediate wave (B) may continue higher to end closer to the 0.618 Fibonacci ratio. At this stage, there is no evidence yet of a trend change although there is reasonable weakness in upwards movement.
Intermediate wave (B) may not move beyond the start of intermediate wave (A) above 18.207.
TECHNICAL ANALYSIS
WEEKLY CHART
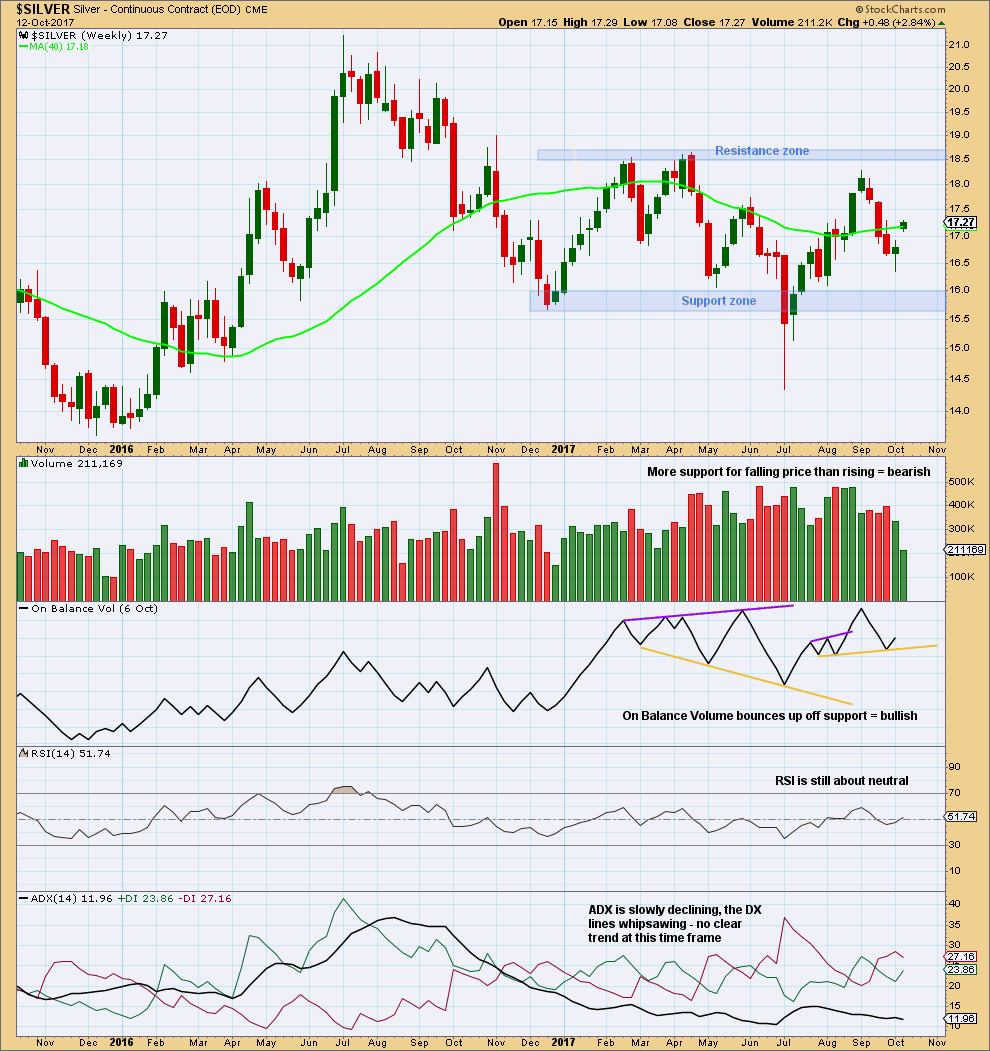
Click chart to enlarge. Chart courtesy of StockCharts.com.
Downwards weeks come with stronger volume than upwards for most recent movement. This volume profile is bearish.
DAILY CHART
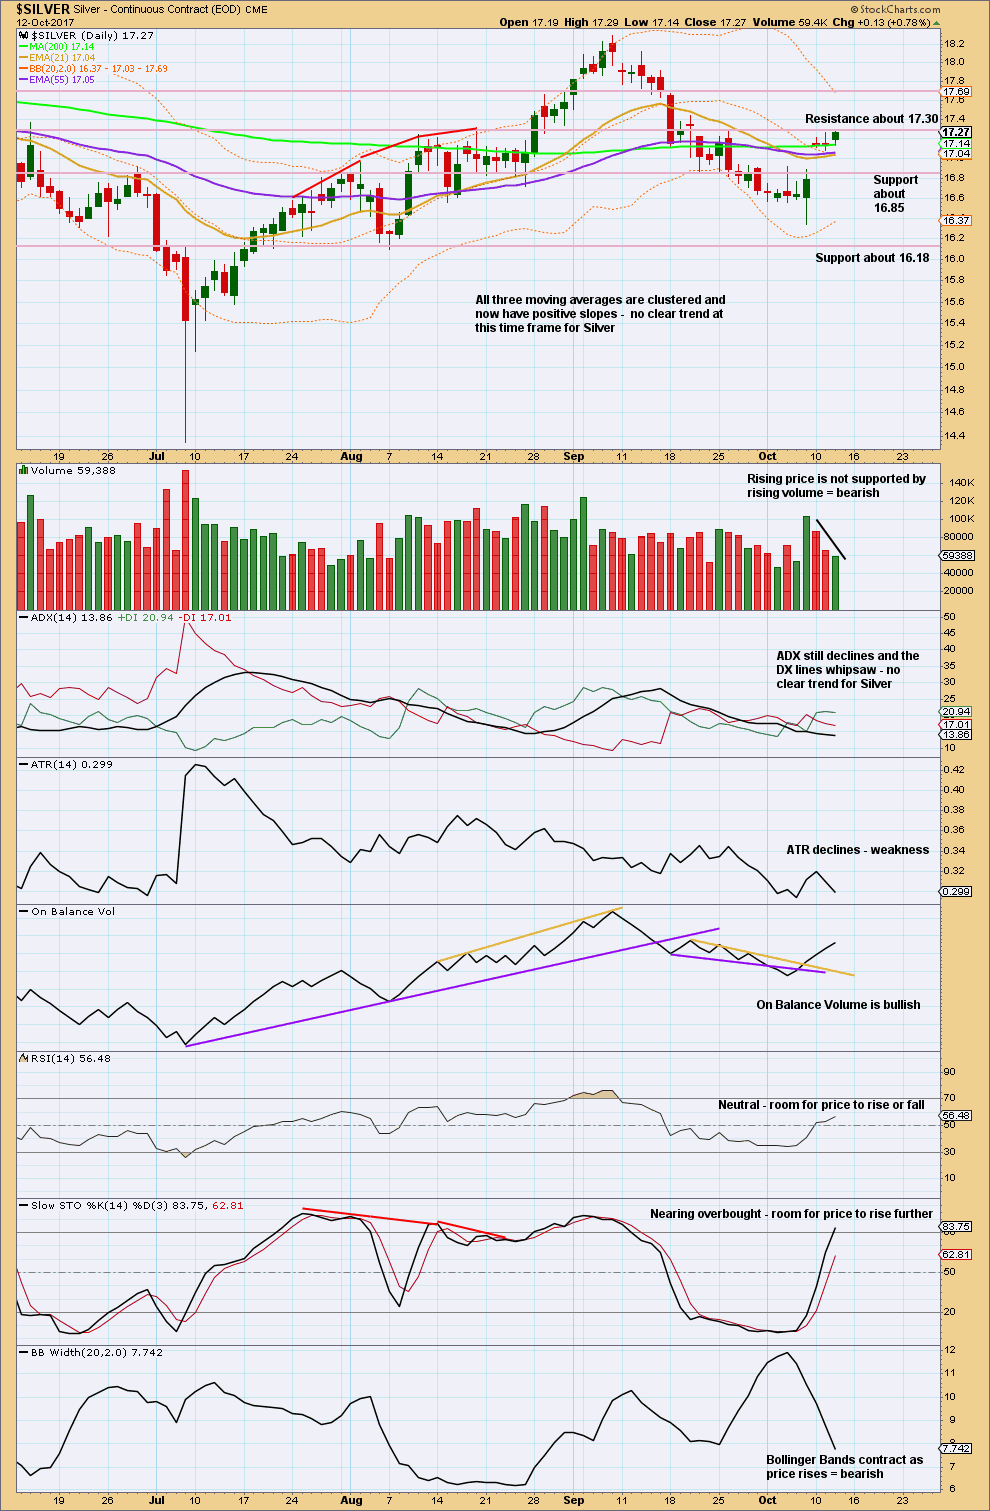
Click chart to enlarge. Chart courtesy of StockCharts.com.
A very clear decline in volume as price has been rising for the last few days is fairly bearish for the short term.
Price is finding resistance about 17.30. If it turns here, look for first support about 16.85 and thereafter 16.18.
There is still a little room for price to rise before it turns though; RSI and Stochastics are not yet overbought.
Published @ 11:19 p.m. EST.