A small range inside day sees the Elliott wave analysis remain the same.
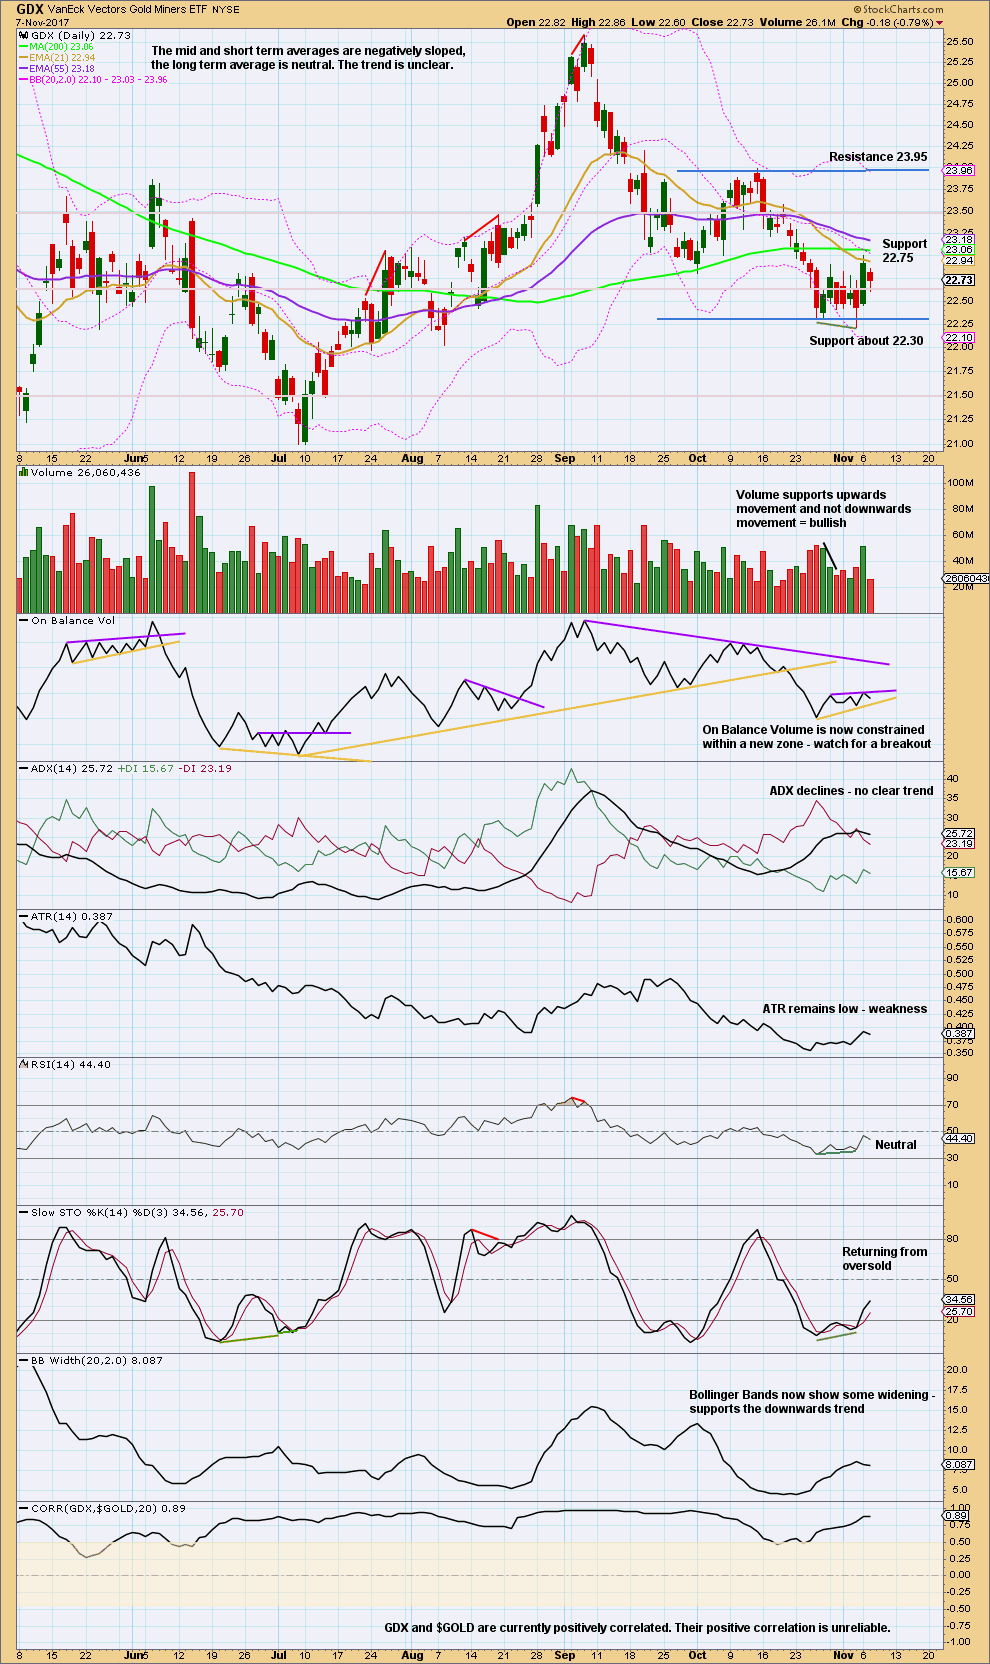
Volume for GDX offers a clue as to the next direction for price in the short term.
Summary: An upwards swing is expected to continue here to end about resistance at 1,305 to 1,310. Along the way up, there may be another small sideways movement to last one to three days.
Only the most experienced of traders should be trading the small swings within a consolidation. If trading the small swings, reduce risk to 1-3% of equity for any one trade and always trade with stops.
New updates to this analysis are in bold.
Last monthly charts for the main wave count are here, another monthly alternate is here, and video is here.
Grand SuperCycle analysis is here.
The wave counts will be labelled first and second. Classic technical analysis will be used to determine which wave count looks to be more likely. In terms of Elliott wave structure the second wave count has a better fit and fewer problems.
FIRST ELLIOTT WAVE COUNT
WEEKLY CHART
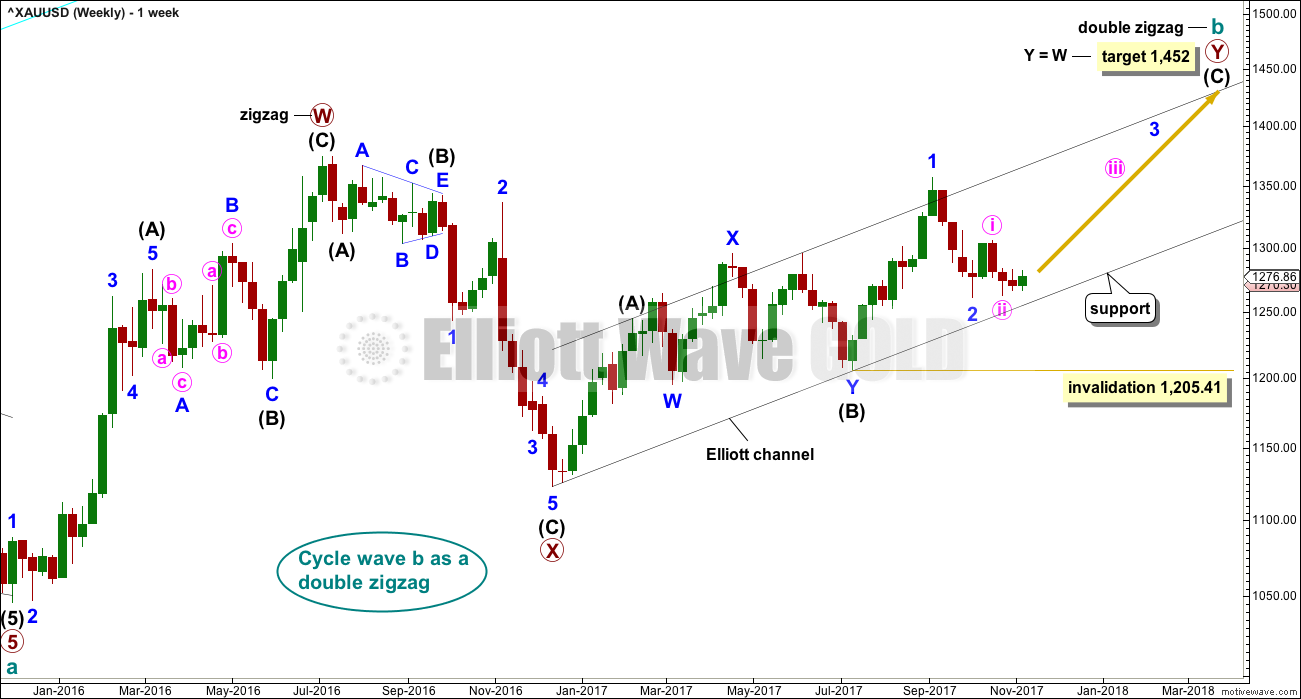
There are more than 23 possible corrective structures that B waves may take, and although cycle wave b still fits well at this stage as a triangle, it may still be another structure. This wave count looks at the possibility that it may be a double zigzag.
If cycle wave b is a double zigzag, then current upwards movement may be part of the second zigzag in the double, labelled primary wave Y.
The target remains the same.
Within intermediate wave (C), no second wave correction may move beyond the start of its first wave below 1,205.41. However, prior to invalidation, this wave count may be discarded if price breaks below the lower edge of the black Elliott channel. If this wave count is correct, then intermediate wave (C) should not break below the Elliott channel which contains the zigzag of primary wave Y upwards.
There are now three problems with this wave count which reduce its probability in terms of Elliott wave:
1. Cycle wave b is a double zigzag, but primary wave X within the double is deep and time consuming. While this is possible, it is much more common for X waves within double zigzags to be brief and shallow.
2. Intermediate wave (B) within the zigzag of primary wave Y is a double flat correction. These are extremely rare, even rarer than running flats. The rarity of this structure must further reduce the probability of this wave count.
3. Although intermediate wave (C) should be continuing so that primary wave Y ends substantially above the end of primary wave W, the duration and depth of minor wave 2 within it now looks to be too large at the weekly time frame.
DAILY CHART
The analysis will focus on the structure of intermediate wave (C). To see details of all the bull movement for this year see daily charts here.
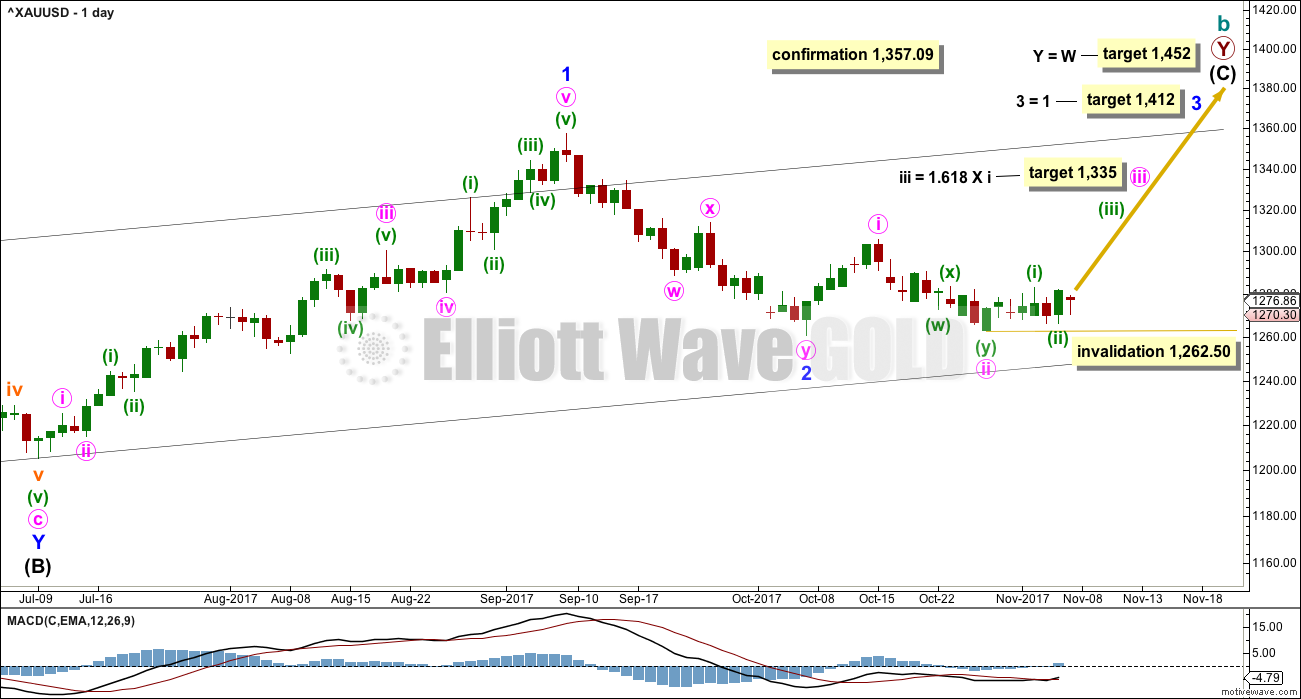
Intermediate wave (C) must be a five wave structure, either an impulse or an ending diagonal. It is unfolding as the more common impulse.
Minor wave 2 may be over and minor wave 3 may have begun. Minor wave 3 may only subdivide as an impulse.
Within minor wave 3, minute waves i and ii should be over. Minute wave iii may only subdivide as an impulse.
Within minute wave iii, minuette waves (i) and now also (ii) look to be over. If minuette wave (ii) continues any lower, it may not move beyond the start of minuette wave (i) below 1,262.50.
The target for minute wave iii expects the most common Fibonacci ratio to minute wave i.
The target for minor wave 3 expects that both minor waves 1 and 3 will both be long extensions, so minor wave 5 may not be extended when it arrives.
HOURLY CHART
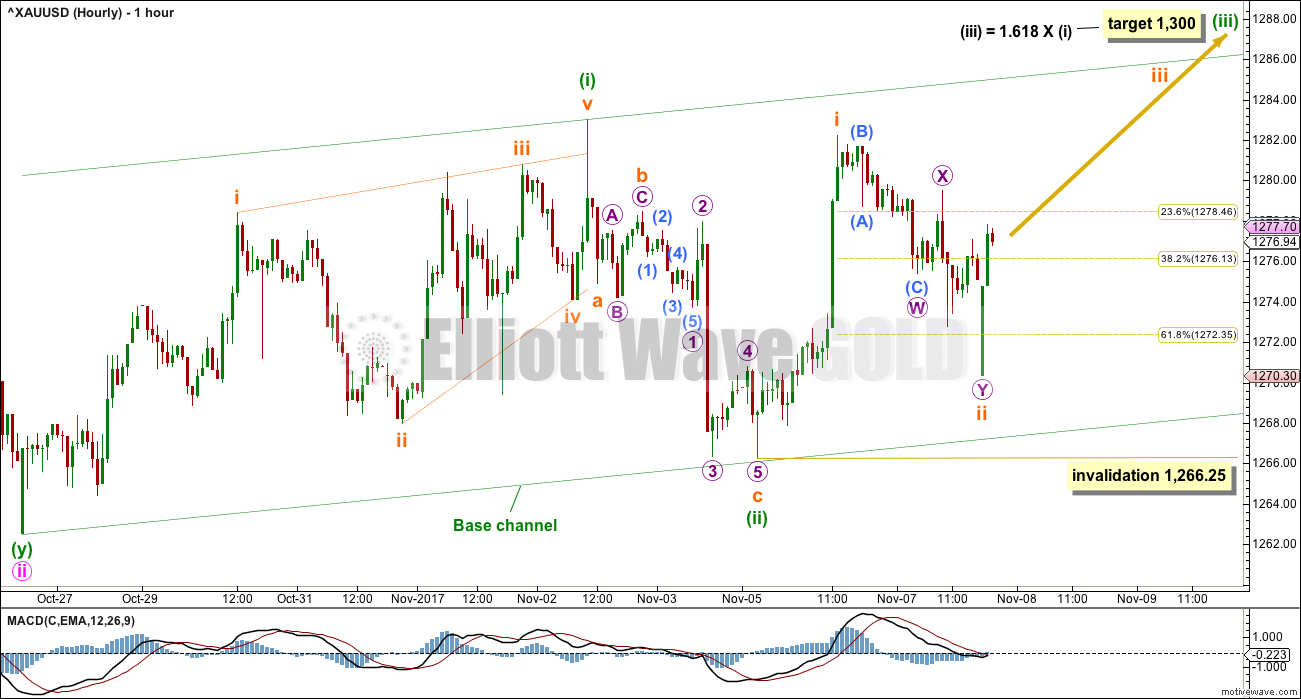
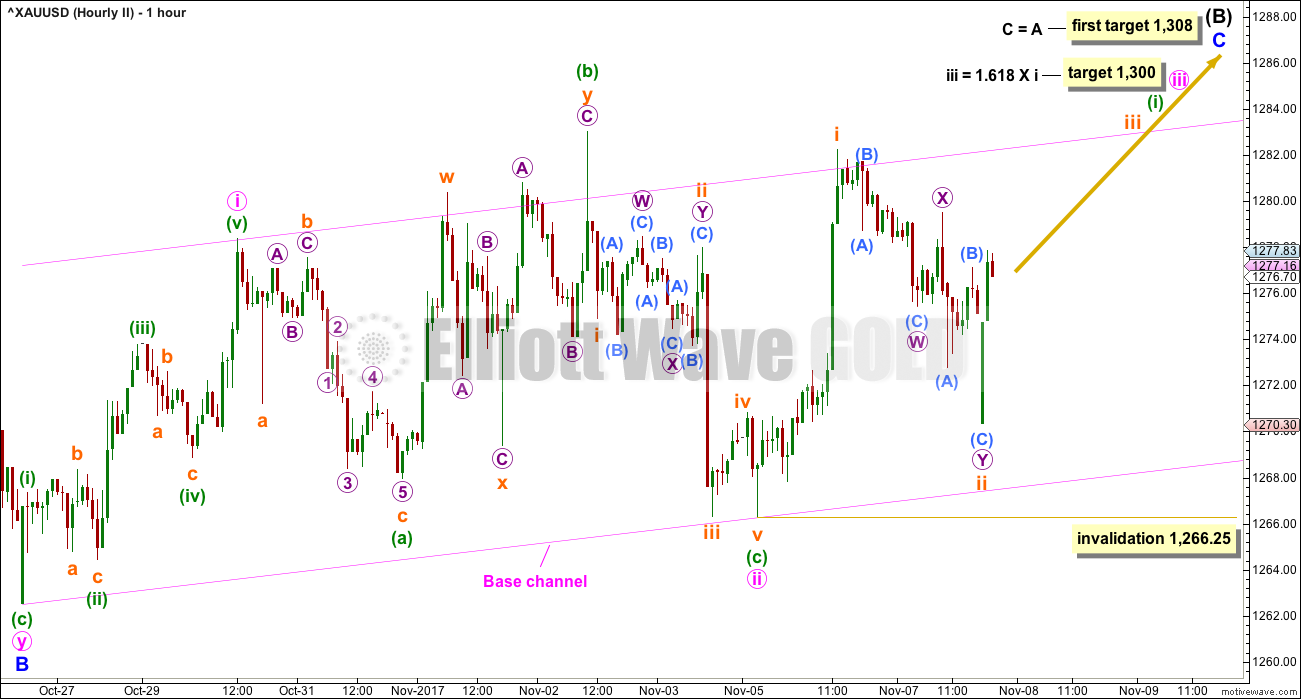
There is more than one way to see the subdivisions of recent movement shown on this hourly chart, from the low for the 27th of October.
A leading contracting diagonal may have completed to the last high, followed by a very deep second wave correction. It is common for second waves following first wave leading diagonals to be very deep indeed. This has the right look.
Micro wave 5 to end subminuette wave c to end minuette wave (ii) has moved very slightly below the end of micro wave 3, avoiding a truncation.
Minuette wave (iii) may only subdivide as an impulse, and it must move far enough above the end of minuette wave (i) at 1,283.02 to allow room for minuette wave (iv) to unfold and remain above first price territory. The target for minuette wave (iii) expects the most common Fibonacci ratio to minuette wave (i).
Within minuette wave (iii), subminuette wave i must now be complete. Subminuette wave ii may not move beyond the start of subminuette wave i below 1,266.25.
If subminuette wave ii continues any lower, then it should find strong support about the lower edge of the green base channel. Lower degree second wave corrections should not breach base channels drawn about first and second waves one or more degrees higher.
This wave count now expects to see an increase in upwards momentum this week.
SECOND ELLIOTT WAVE COUNT
WEEKLY CHART
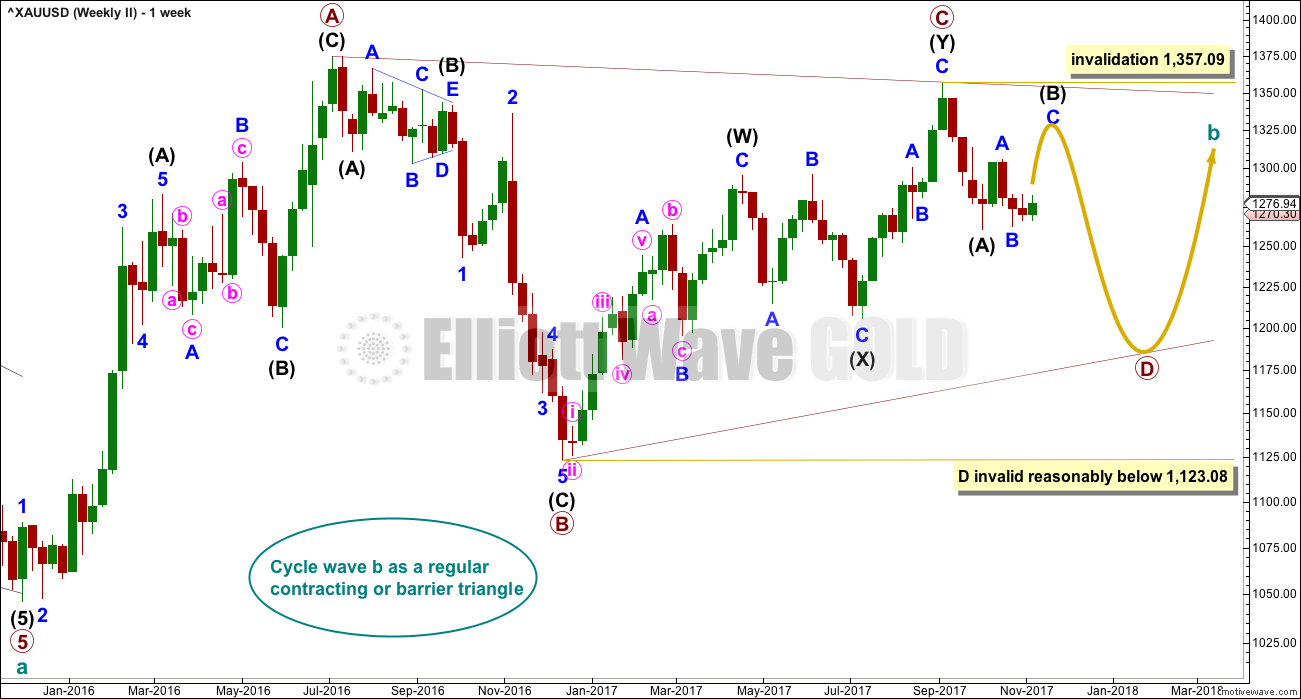
It is still possible that cycle wave b is unfolding as a regular contracting or barrier triangle.
Within a triangle, one sub-wave should be a more complicated multiple, which may be primary wave C. This is the most common sub-wave of the triangle to subdivide into a multiple.
Intermediate wave (Y) now looks like a complete zigzag at the weekly chart level.
Primary wave D of a contracting triangle may not move beyond the end of primary wave B below 1,123.08. Contracting triangles are the most common variety.
Primary wave D of a barrier triangle should end about the same level as primary wave B at 1,123.08, so that the B-D trend line remains essentially flat. This involves some subjectivity; price may move slightly below 1,123.08 and the triangle wave count may remain valid. This is the only Elliott wave rule which is not black and white.
Finally, primary wave E of a contracting or barrier triangle may not move beyond the end of primary wave C above 1,295.65. Primary wave E would most likely fall short of the A-C trend line. But if it does not end there, then it can slightly overshoot that trend line.
Primary wave A lasted 31 weeks, primary wave B lasted 23 weeks, and primary wave C lasted 38 weeks.
The A-C trend line now has too weak a slope. At this stage, this is now a problem for this wave count, the upper A-C trend line no longer has such a typical look.
Within primary wave D, no part of the zigzag may move beyond its start above 1,357.09.
DAILY CHART
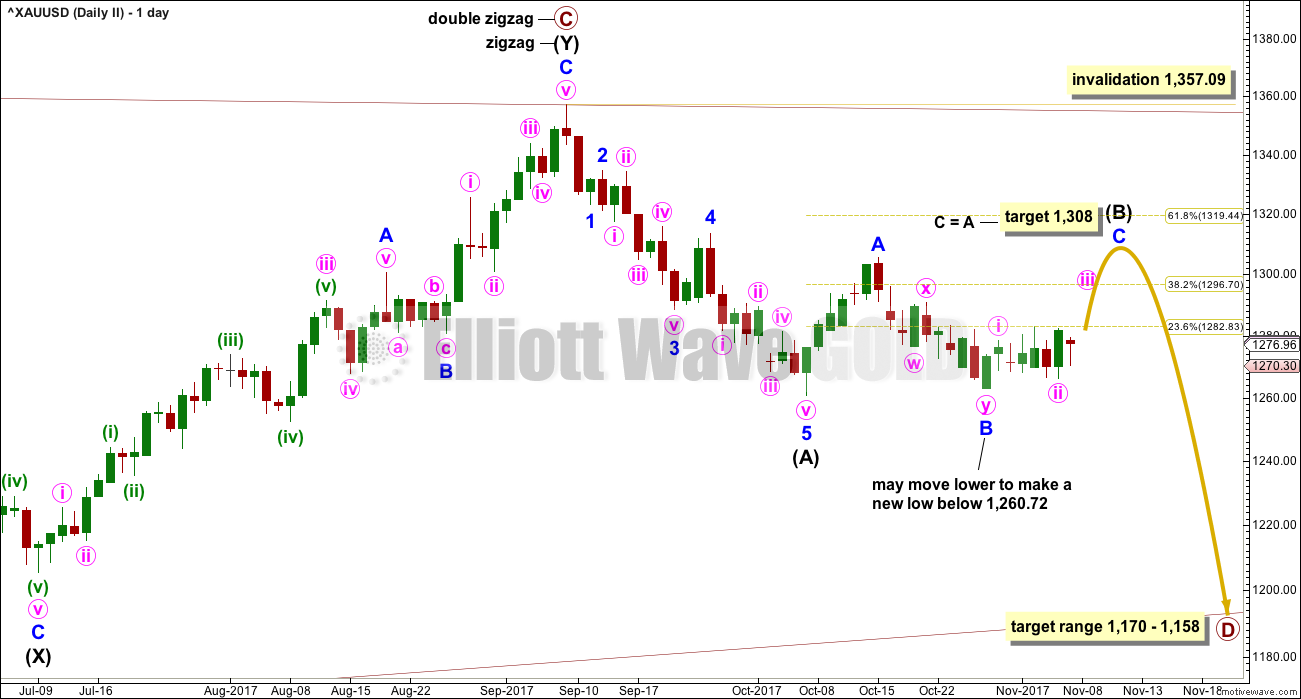
At this stage intermediate wave (B) looks incomplete.
A common length for triangle sub-waves is from 0.8 to 0.85 the length of the prior wave. Primary wave D would reach this range from 1,170 to 1,158.
If primary wave C is correctly labelled as a double zigzag, then primary wave D must be a single zigzag.
Within the single zigzag of primary wave D, intermediate wave (A) is labelled as a complete impulse.
Intermediate wave (A) lasted twenty days, just one short of a Fibonacci twenty-one. Intermediate wave (B) may be about the same duration, so that this wave count has good proportions, or it may be longer because B waves tend to be more complicated and time consuming.
So far intermediate wave (B) has lasted twenty-two sessions, it is incomplete and needs several more sessions now to complete. The next Fibonacci ratio in the sequence is thirty four.
At its conclusion intermediate wave (B) should have an obvious three wave look to it here on the daily chart. While it is labelled as a flat correction, it may also complete as a combination or triangle. Labelling for this second wave count within intermediate wave (B) may change here on the daily chart and at the hourly chart level as the structure continues and becomes clearer.
HOURLY CHART
Intermediate wave (B) may be a regular flat correction. It may also be a combination or triangle, so labelling within this structure for this wave count my still change in coming days.
There is more than one way to label most recent movement since the low of the 27th of October, for this movement shown on both hourly charts.
The labelling for the first hourly chart will work in the same way for this second hourly chart, as in minute wave i may have ended at the last high as a leading contracting diagonal. But minute wave i may also have ended earlier and minute wave ii may have just completed today as an expanded flat correction.
Minute wave iii may only subdivide as an impulse. The target expects the most common Fibonacci ratio to minute wave i.
The lower edge of the base channel here should also provide support if the last correction of minuette wave (ii) moves any lower.
Minor wave C would be extremely likely to make at least a slight new high above the end of minor wave A at 1,305.72 to avoid a truncation if intermediate wave (B) is a flat correction. If intermediate wave (B) is a triangle, then minor wave C may not move beyond the end of minor wave A above 1,305.72 (it must end before this point).
Both wave counts require a five wave structure upwards to complete. For this second wave count it would be labelled minor wave C.
TECHNICAL ANALYSIS
WEEKLY CHART
Click chart to enlarge. Chart courtesy of StockCharts.com.
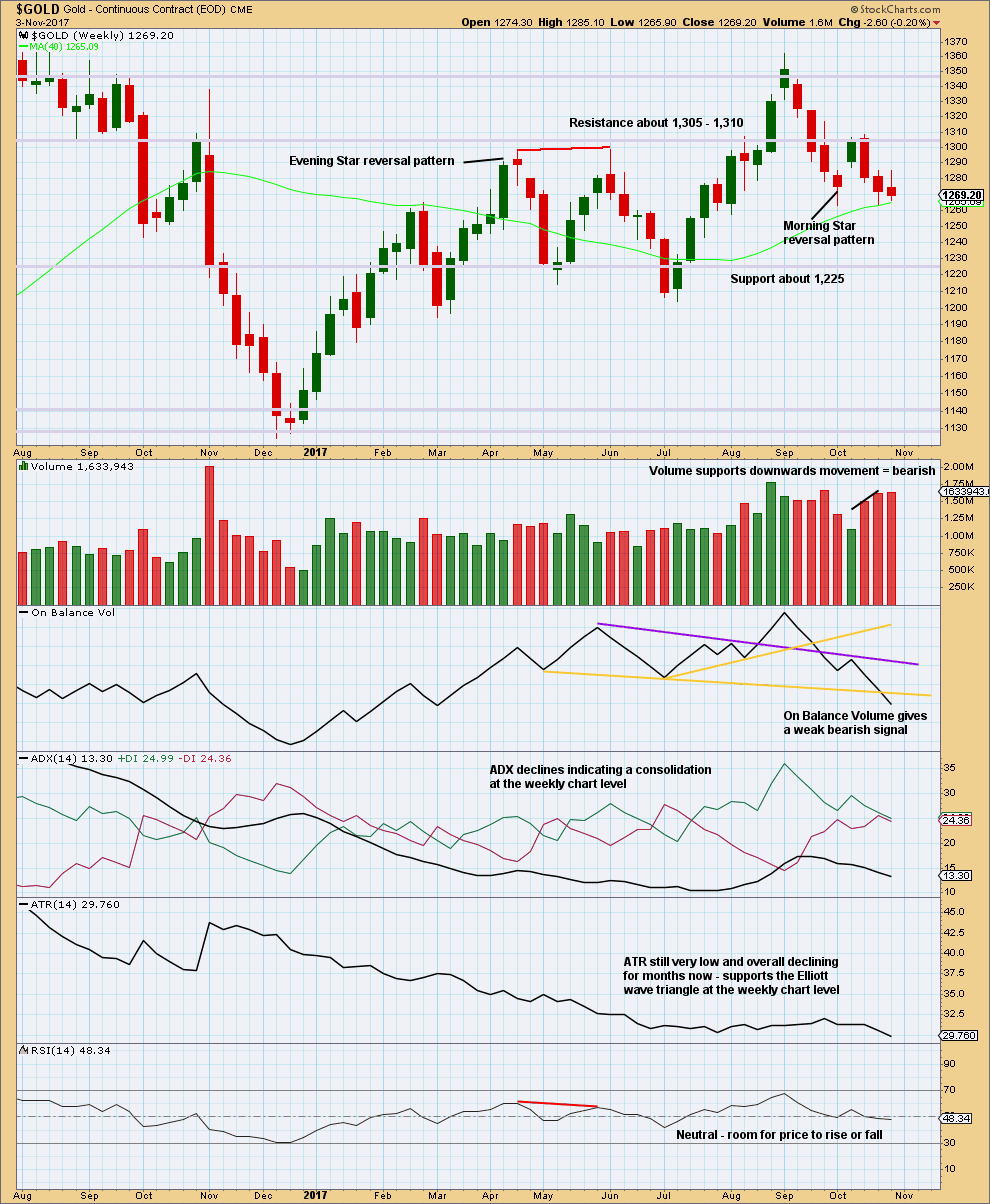
Although price made a higher high and higher low last week, the definition of upwards movement, the candlestick has closed red and the balance of volume for the week is downwards. Some increase in volume supports downwards movement during the week, so this is interpreted as bearish.
ATR continues to decline, which offers fairly strong support to the second Elliott wave count. This is exactly the kind of price behaviour expected from large triangles.
DAILY CHART
Click chart to enlarge. Chart courtesy of StockCharts.com.
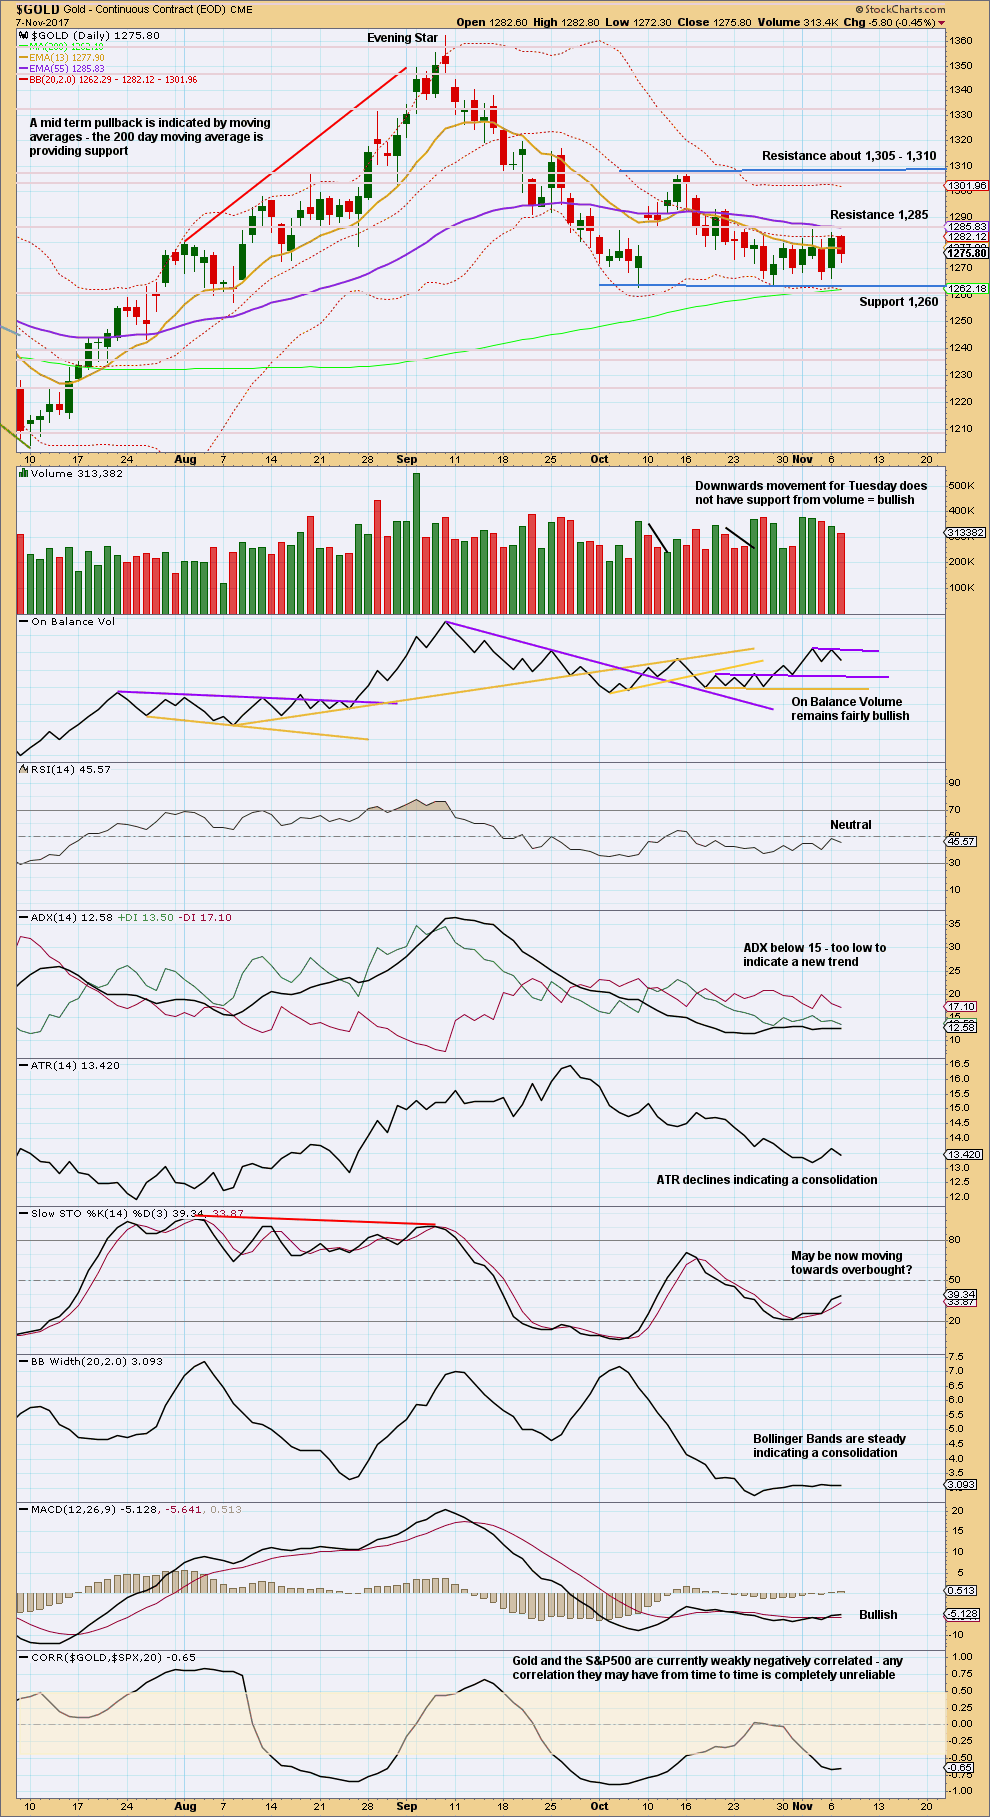
Price is very clearly consolidating. Expect swings from support to resistance and back again. Use Stochastics in conjunction with support and resistance to signal when each swing ends. Be aware that trading a consolidating market is much more risky than trading a trending market, and reduce risk accordingly. Only experienced traders should consider trading the swings within a consolidation. Reduce risk to 1-3% of equity. Always trade with stops. Here, move stops to a little below support and above resistance to allow for overshoots; give the market room to move.
With Stochastics very close to oversold and price at support, an upwards swing may now be beginning. Look for resistance about 1,305 – 1,310. This also supports the second Elliott wave count.
Price does not move within a consolidation in straight lines from resistance to support and back again. Consolidations are characterised by a lot of choppy overlapping movement, and declining ATR.
GDX DAILY CHART
Click chart to enlarge. Chart courtesy of StockCharts.com.
An upwards swing may be expected to continue to resistance about 23.95.
Price does not move in straight lines within consolidations, making them poor trading opportunities. If trading this upwards swing, then reduce risk to only 1-3% of equity to acknowledge higher risk.
Published @ 08:37 p.m. EST.

Price is finally moving strongly higher after about a week of basing.
There should be a reasonable way up to go yet.
If members are not already positioned long then the next second wave correction may provide an opportunity. If it is deep then it should find strong support at the new orange base channel.
When price breaks above the upper edges of the two base channels here then they may provide some support. This doesn’t always work…. but when it does it offers a nice opportunity for a good entry point.
Since the 27th of October there are now higher highs and higher lows, even though price has been sluggish. I’m expecting it to now start to move higher with a bit more momentum.
And finally, I expect that the lack of comments here today is a reflection of this low volatility and frustrating market.
Members already positioned long may move stops up to just below the orange base channel, or if more risk tolerant to just below the invalidation point.
Always trade with stops.
Thanks Lara. Another day where a move had started and then kinda stopped in its tracks. We’ll have to see where this takes us, but the trend direction still seems up in the air really.
Probably because this market is not currently trending at the daily chart level at this time.
Consolidating markets are particularly difficult to make $$ in.