Upwards movement was expected for both Elliott wave counts. A higher high and a higher low with a green daily candlestick for the session fits expectations.
Summary: An upwards swing is expected to continue here to end about resistance at 1,305 to 1,310. Along the way up, there may be another small sideways movement to last one to three days.
Only the most experienced of traders should be trading the small swings within a consolidation. If trading the small swings, reduce risk to 1-3% of equity for any one trade and always trade with stops.
New updates to this analysis are in bold.
Last monthly charts for the main wave count are here, another monthly alternate is here, and video is here.
Grand SuperCycle analysis is here.
The wave counts will be labelled first and second. Classic technical analysis will be used to determine which wave count looks to be more likely. In terms of Elliott wave structure the second wave count has a better fit and fewer problems.
FIRST ELLIOTT WAVE COUNT
WEEKLY CHART
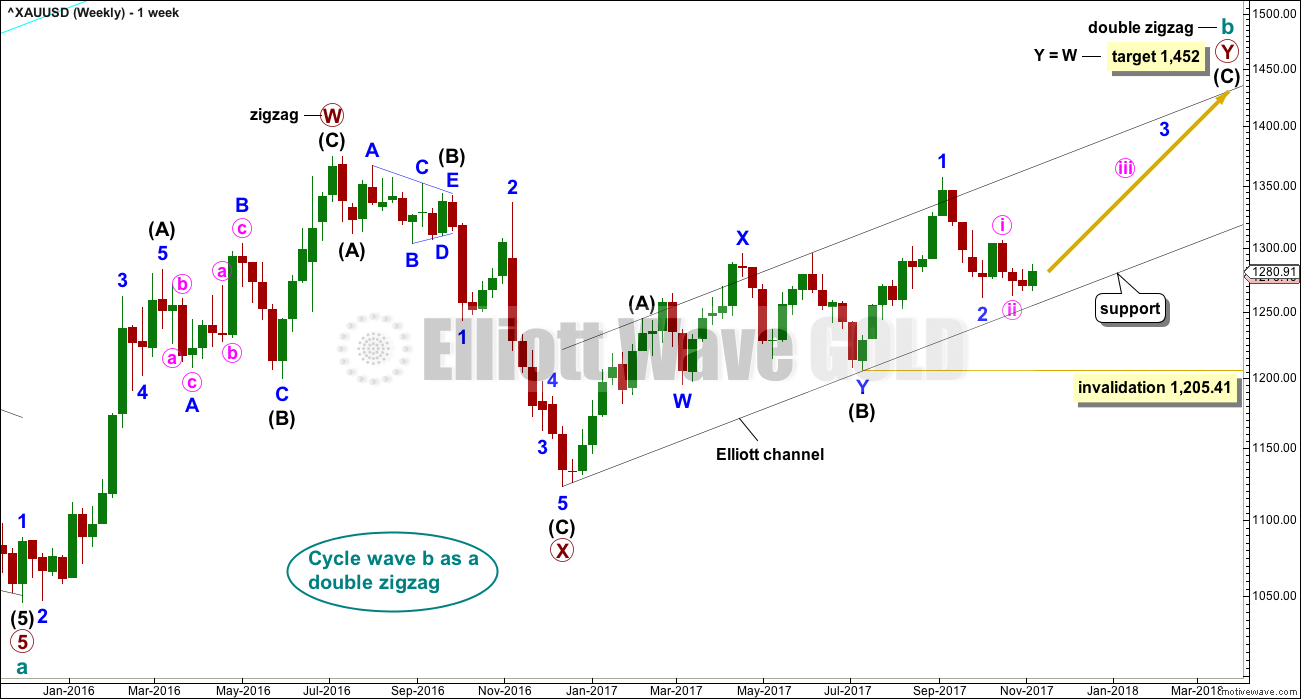
There are more than 23 possible corrective structures that B waves may take, and although cycle wave b still fits well at this stage as a triangle, it may still be another structure. This wave count looks at the possibility that it may be a double zigzag.
If cycle wave b is a double zigzag, then current upwards movement may be part of the second zigzag in the double, labelled primary wave Y.
The target remains the same.
Within intermediate wave (C), no second wave correction may move beyond the start of its first wave below 1,205.41. However, prior to invalidation, this wave count may be discarded if price breaks below the lower edge of the black Elliott channel. If this wave count is correct, then intermediate wave (C) should not break below the Elliott channel which contains the zigzag of primary wave Y upwards.
There are now three problems with this wave count which reduce its probability in terms of Elliott wave:
1. Cycle wave b is a double zigzag, but primary wave X within the double is deep and time consuming. While this is possible, it is much more common for X waves within double zigzags to be brief and shallow.
2. Intermediate wave (B) within the zigzag of primary wave Y is a double flat correction. These are extremely rare, even rarer than running flats. The rarity of this structure must further reduce the probability of this wave count.
3. Although intermediate wave (C) should be continuing so that primary wave Y ends substantially above the end of primary wave W, the duration and depth of minor wave 2 within it now looks to be too large at the weekly time frame.
DAILY CHART
The analysis will focus on the structure of intermediate wave (C). To see details of all the bull movement for this year see daily charts here.
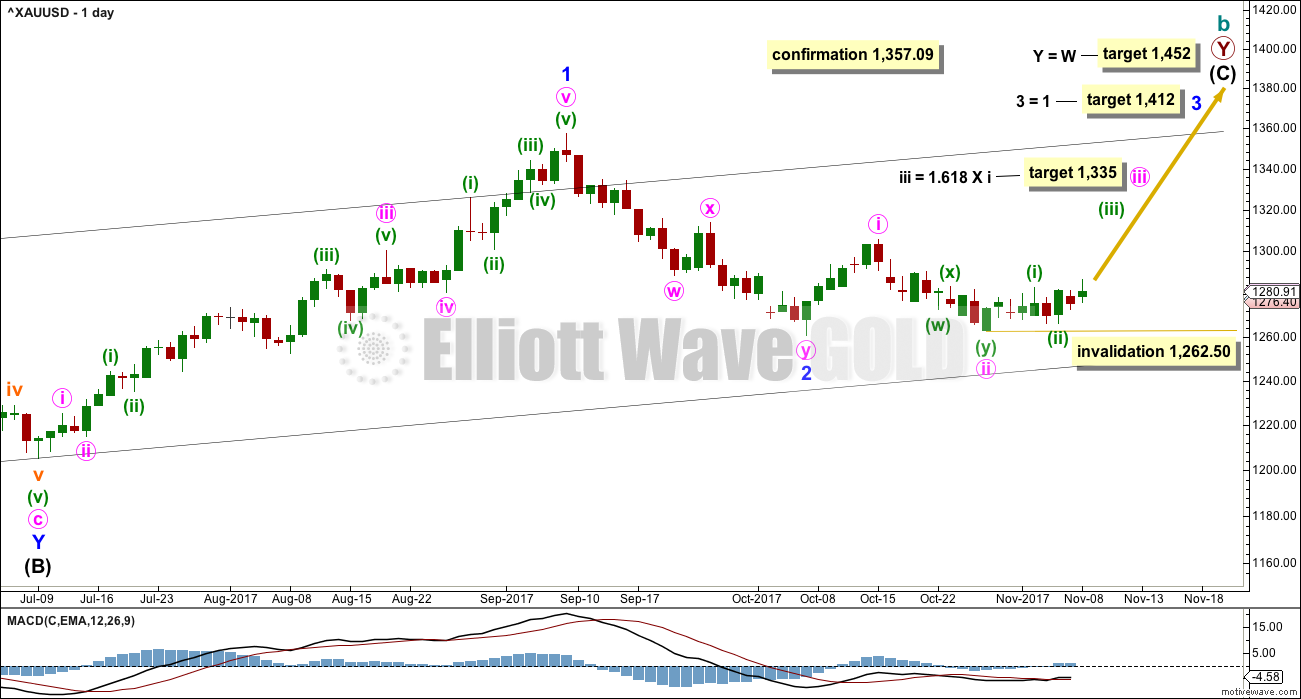
Intermediate wave (C) must be a five wave structure, either an impulse or an ending diagonal. It is unfolding as the more common impulse.
Minor wave 2 may be over and minor wave 3 may have begun. Minor wave 3 may only subdivide as an impulse.
Within minor wave 3, minute waves i and ii should be over. Minute wave iii may only subdivide as an impulse.
Within minute wave iii, minuette waves (i) and now also (ii) look to be over. If minuette wave (ii) continues any lower, it may not move beyond the start of minuette wave (i) below 1,262.50.
The target for minute wave iii expects the most common Fibonacci ratio to minute wave i.
The target for minor wave 3 expects that both minor waves 1 and 3 will both be long extensions, so minor wave 5 may not be extended when it arrives.
Price behaviour since the low on the 27th of October, at 1,262.05, is unconvincing as the start of a third wave up at two degrees. While Gold may start its third waves a little slowly, third waves should still begin with at least one convincingly strong upwards day. Although price has moved slightly higher, it is doing so with declining volume and is not exhibiting reasonable strength on upwards days. This gives some reasonable doubt now for this wave count.
HOURLY CHART
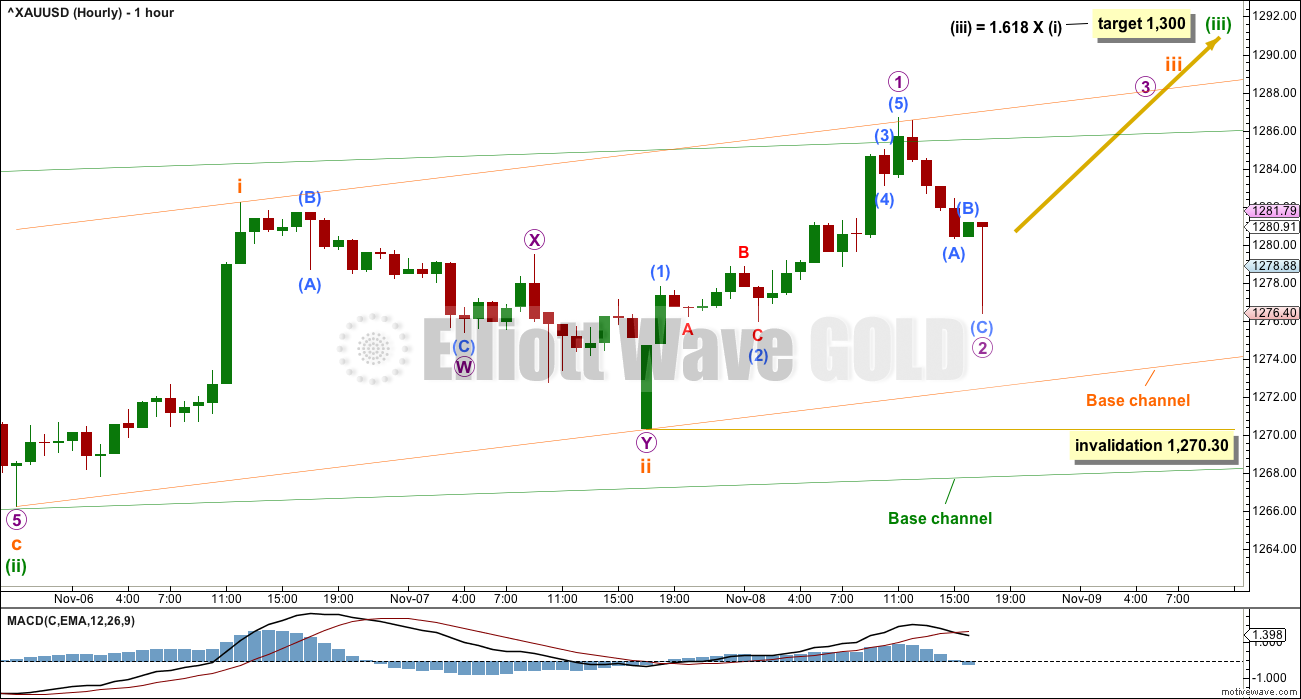
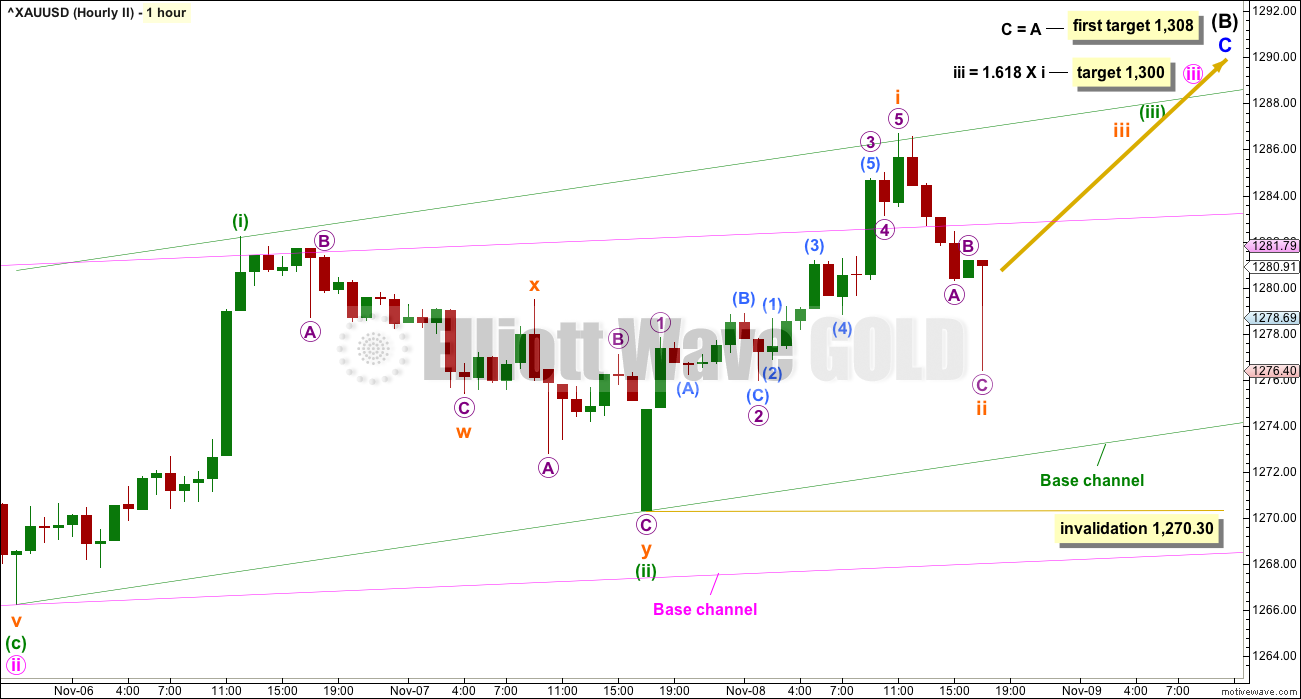
There is more than one way to see the subdivisions of recent movement shown on this hourly chart, from the low for the 27th of October.
A leading contracting diagonal may have completed to the last high, followed by a very deep second wave correction. It is common for second waves following first wave leading diagonals to be very deep indeed. This has the right look.
Micro wave 5 to end subminuette wave c to end minuette wave (ii) has moved very slightly below the end of micro wave 3, avoiding a truncation.
Minuette wave (iii) may only subdivide as an impulse, and it must move far enough above the end of minuette wave (i) at 1,283.02 to allow room for minuette wave (iv) to unfold and remain above first price territory. The target for minuette wave (iii) expects the most common Fibonacci ratio to minuette wave (i).
Within minuette wave (iii), subminuette waves i and now ii must now be complete.
Within subminuette wave iii, micro waves 1 and now likely 2 may be complete. Micro wave 2 may not move beyond the start of micro wave 1 below 1,270.30.
Upwards movement so far this week is not exhibiting an increase in momentum. This adds some doubt now that this wave count is correct.
This wave count now expects that there may be five overlapping first and second waves. This indicates a winding up of potential energy that may be released in explosive upwards movement.
SECOND ELLIOTT WAVE COUNT
WEEKLY CHART
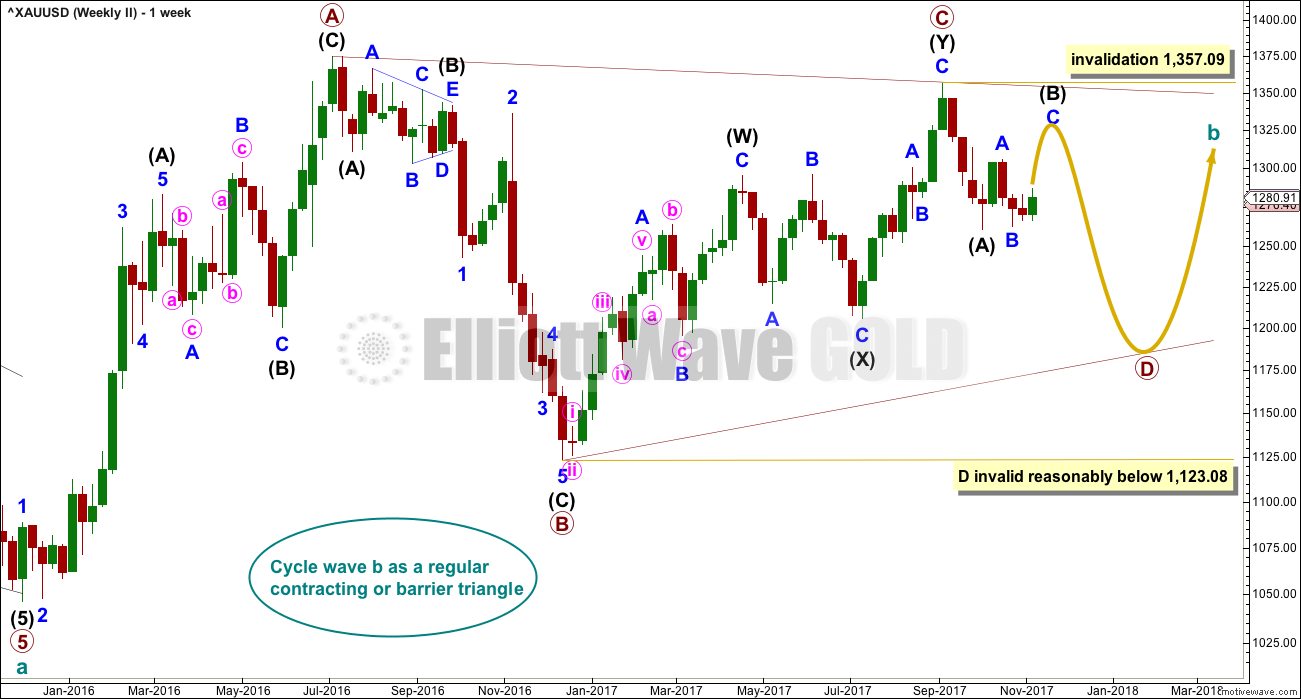
It is still possible that cycle wave b is unfolding as a regular contracting or barrier triangle.
Within a triangle, one sub-wave should be a more complicated multiple, which may be primary wave C. This is the most common sub-wave of the triangle to subdivide into a multiple.
Intermediate wave (Y) now looks like a complete zigzag at the weekly chart level.
Primary wave D of a contracting triangle may not move beyond the end of primary wave B below 1,123.08. Contracting triangles are the most common variety.
Primary wave D of a barrier triangle should end about the same level as primary wave B at 1,123.08, so that the B-D trend line remains essentially flat. This involves some subjectivity; price may move slightly below 1,123.08 and the triangle wave count may remain valid. This is the only Elliott wave rule which is not black and white.
Finally, primary wave E of a contracting or barrier triangle may not move beyond the end of primary wave C above 1,295.65. Primary wave E would most likely fall short of the A-C trend line. But if it does not end there, then it can slightly overshoot that trend line.
Primary wave A lasted 31 weeks, primary wave B lasted 23 weeks, and primary wave C lasted 38 weeks.
The A-C trend line now has too weak a slope. At this stage, this is now a problem for this wave count, the upper A-C trend line no longer has such a typical look.
Within primary wave D, no part of the zigzag may move beyond its start above 1,357.09.
DAILY CHART
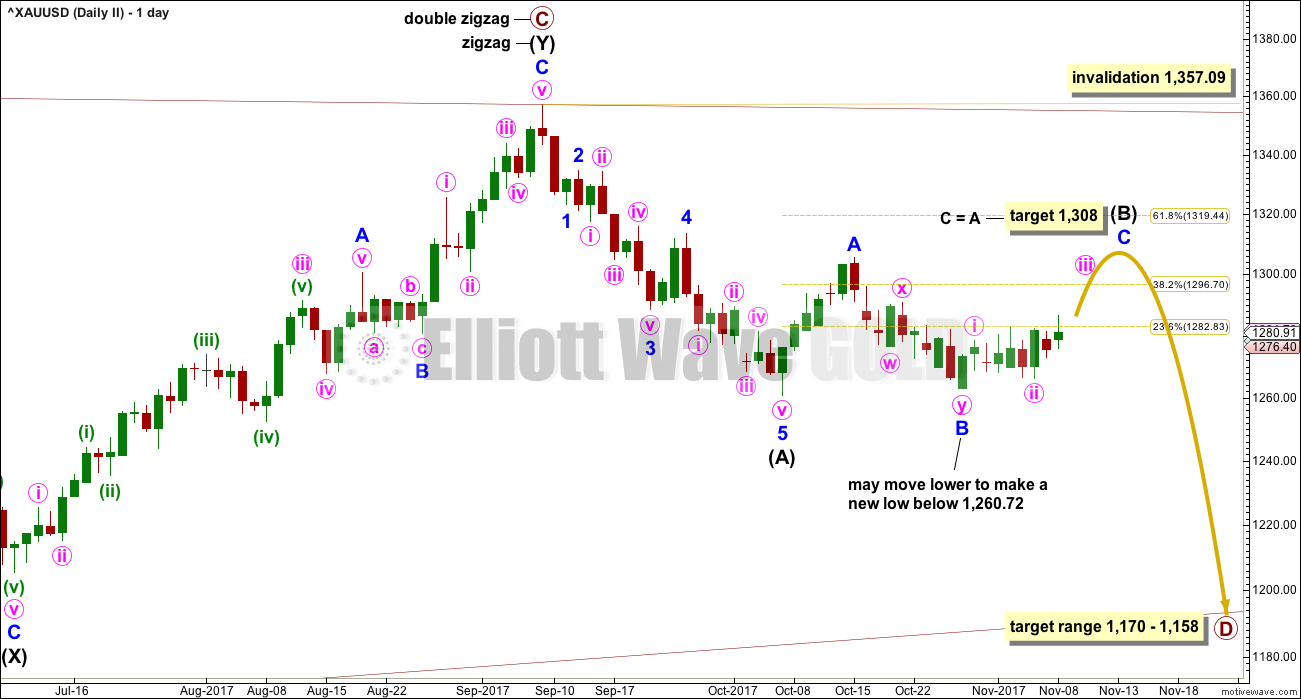
At this stage intermediate wave (B) looks incomplete.
A common length for triangle sub-waves is from 0.8 to 0.85 the length of the prior wave. Primary wave D would reach this range from 1,170 to 1,158.
If primary wave C is correctly labelled as a double zigzag, then primary wave D must be a single zigzag.
Within the single zigzag of primary wave D, intermediate wave (A) is labelled as a complete impulse.
Intermediate wave (A) lasted twenty days, just one short of a Fibonacci twenty-one. Intermediate wave (B) may be about the same duration, so that this wave count has good proportions, or it may be longer because B waves tend to be more complicated and time consuming.
So far intermediate wave (B) has lasted twenty-three sessions, it is incomplete and needs several more sessions now to complete. The next Fibonacci ratio in the sequence is thirty four.
At its conclusion intermediate wave (B) should have an obvious three wave look to it here on the daily chart. While it is labelled as a flat correction, it may also complete as a combination or triangle. Labelling for this second wave count within intermediate wave (B) may change here on the daily chart and at the hourly chart level as the structure continues and becomes clearer.
HOURLY CHART
Intermediate wave (B) may be a regular flat correction. It may also be a combination or triangle, so labelling within this structure for this wave count my still change in coming days.
Minute wave iii may only subdivide as an impulse. The target expects the most common Fibonacci ratio to minute wave i.
Minor wave C would be extremely likely to make at least a slight new high above the end of minor wave A at 1,305.72 to avoid a truncation if intermediate wave (B) is a flat correction. If intermediate wave (B) is a triangle, then minor wave C may not move beyond the end of minor wave A above 1,305.72 (it must end before this point).
A new base channel is added to minuette waves (i) and (ii). If subminuette wave ii moves any lower, it should find very strong support about the lower edge of this base channel.
Upwards movement for Wednesday’s session found resistance at the upper edge of the green base channel drawn about minuette waves (i) and (ii). If a third wave up is underway, then it should have the power to break above resistance at this trend line. If that happens, then price may find support about that line. This is not always how base channels work, but when they do that provides another good entry opportunity to join a trend within a third wave.
Subminuette wave ii may not move beyond the start of subminuette wave i below 1,270.30.
TECHNICAL ANALYSIS
WEEKLY CHART
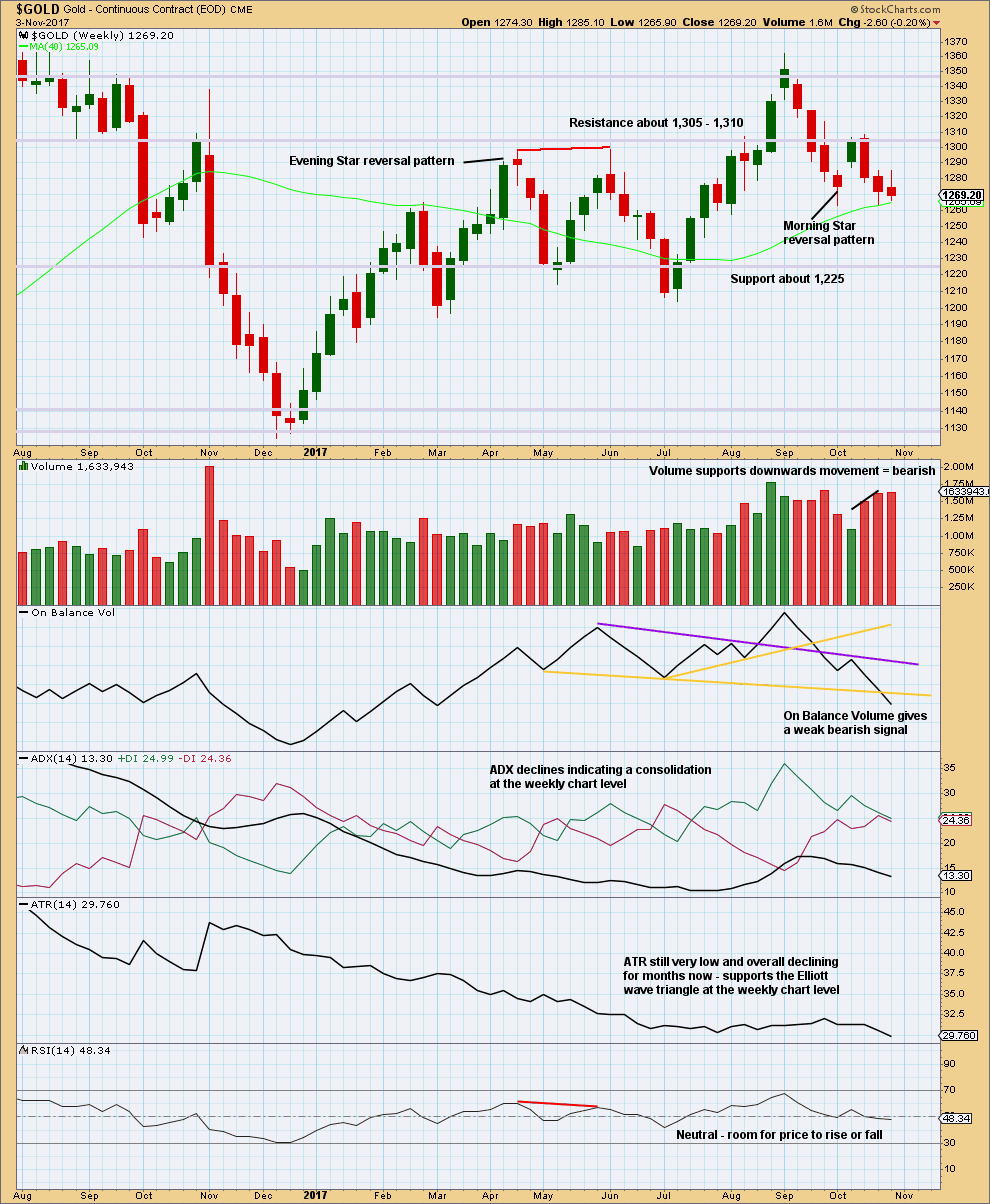
Click chart to enlarge. Chart courtesy of StockCharts.com.
Although price made a higher high and higher low last week, the definition of upwards movement, the candlestick has closed red and the balance of volume for the week is downwards. Some increase in volume supports downwards movement during the week, so this is interpreted as bearish.
ATR continues to decline, which offers fairly strong support to the second Elliott wave count. This is exactly the kind of price behaviour expected from large triangles.
DAILY CHART
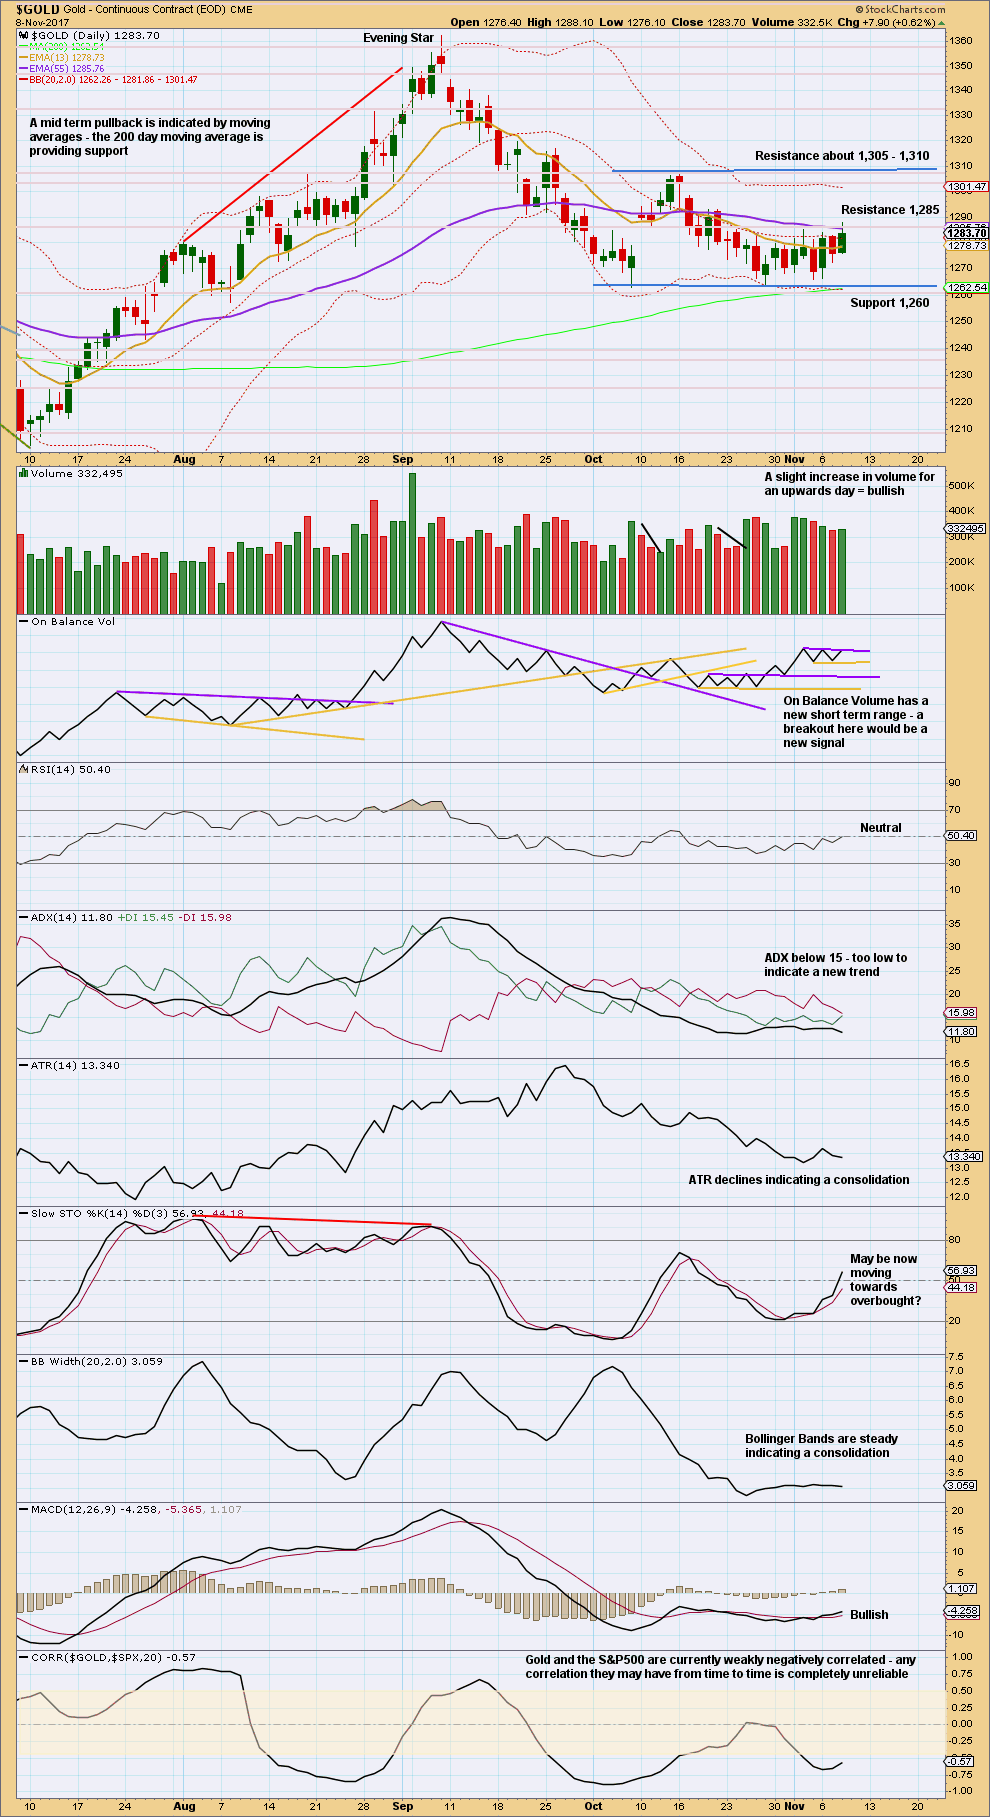
Click chart to enlarge. Chart courtesy of StockCharts.com.
Price is very clearly consolidating. Expect swings from support to resistance and back again. Use Stochastics in conjunction with support and resistance to signal when each swing ends. Be aware that trading a consolidating market is much more risky than trading a trending market, and reduce risk accordingly. Only experienced traders should consider trading the swings within a consolidation. Reduce risk to 1-3% of equity. Always trade with stops. Here, move stops to a little below support and above resistance to allow for overshoots; give the market room to move.
With Stochastics very close to oversold and price at support, an upwards swing may now be beginning. Look for resistance about 1,305 – 1,310. This also supports the second Elliott wave count.
Along the way up, price at this time is finding resistance about 1,285.
Volume today gives a little support to upwards movement. The overall decline in volume for the last five sessions adds support to the second Elliott wave count over the first.
On Balance Volume will be watched carefully. If tomorrow moves price higher, then On Balance Volume would give a bullish signal. That would be given reasonable weight.
GDX DAILY CHART
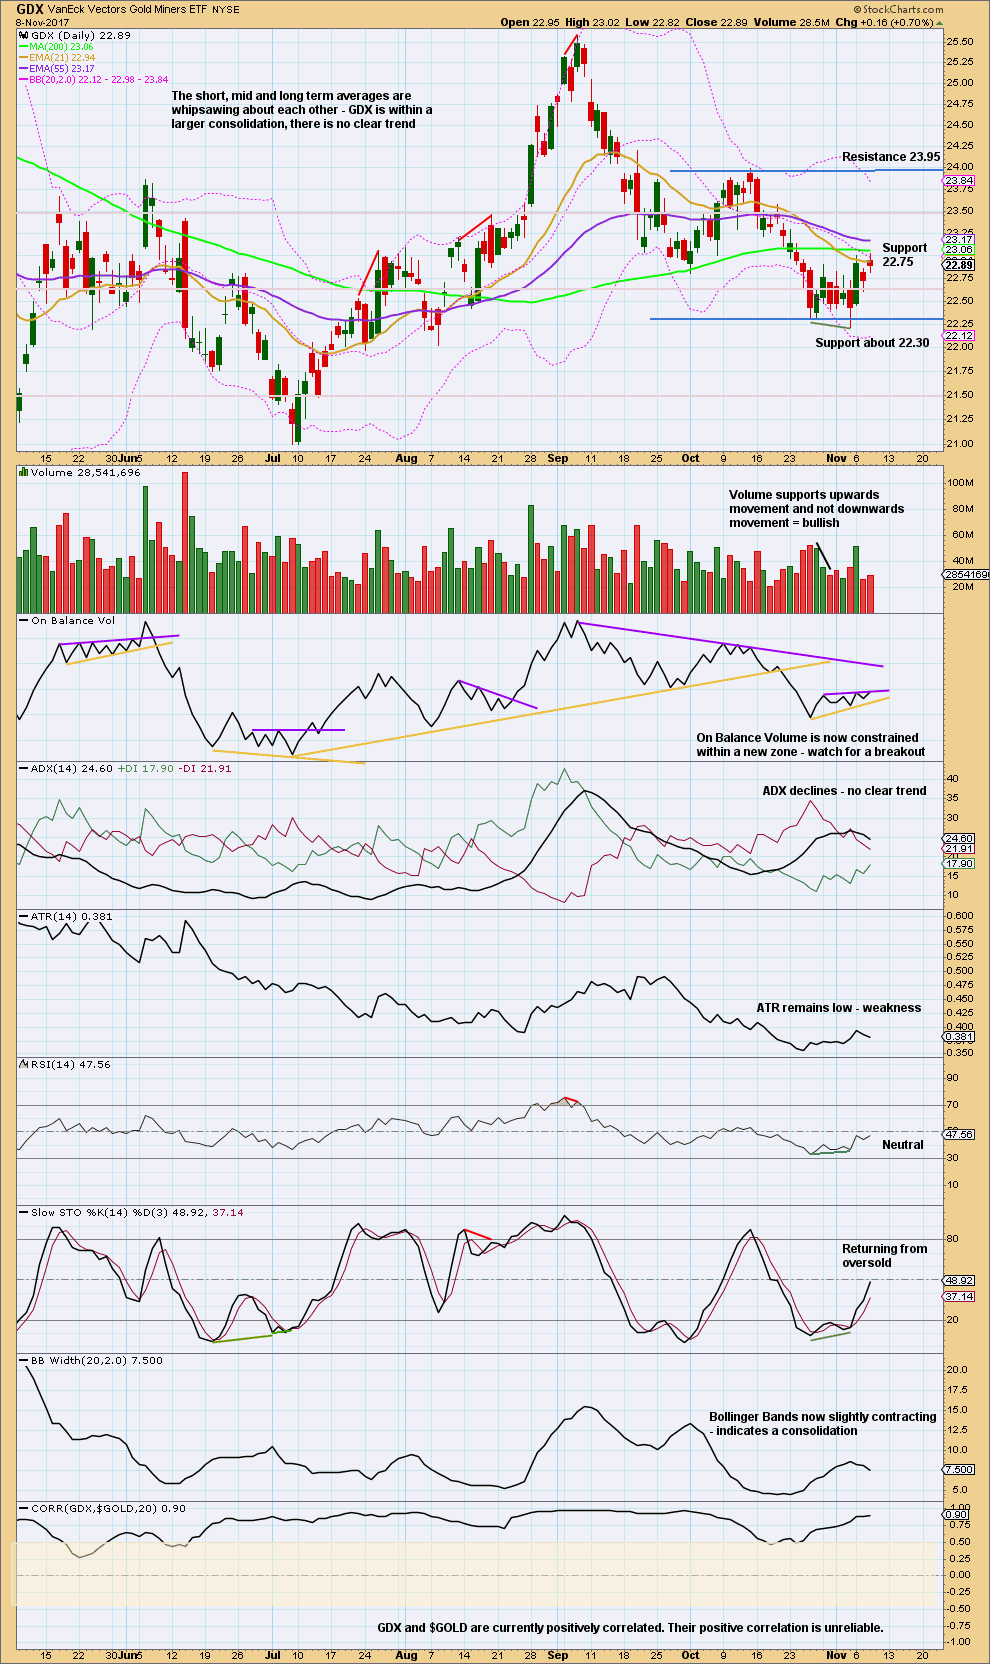
Click chart to enlarge. Chart courtesy of StockCharts.com.
An upwards swing may be expected to continue to resistance about 23.95.
Price does not move in straight lines within consolidations, making them poor trading opportunities. If trading this upwards swing, then reduce risk to only 1-3% of equity to acknowledge higher risk.
Published @ 06:10 p.m. EST.

Price is still moving higher, but still a bit slow. Look out, if my wave counts are correct then it may accelerate strongly tomorrow.
Now for newer members (and maybe too some not so new) you may be surprised to hear I don’t follow the “news”. Particularly news of what is supposed to move markets. Too much noise.
The core theory of Elliott wave is that it is social mood that creates market movement and creates the news, not the other way around. It’s an important distinction, and one that is very unpopular.
So what’s happening tomorrow? The strong move up that both wave counts now are expecting may come on a news announcement that sees the middle of a third wave unfold.
Anyway, so far so good for both counts. Still a ways up to go before this swing is done.
Here’s the second hourly chart updated:
You are the best in this 100%
Why thank you very much.
But I will be wrong sometimes. I have been wrong before, and I will be wrong again.
Which is why managing the risk on every trade is so important.
I’d hate to see anyone become so comfortable with my analysis that they trust me too much to let risk management slide.
I second Tarboush. You really are great, Lara. If anything, you undersell yourself. Of course, everyone will be wrong to varying levels at different times.
Very true about social mood, market movement and news. I am a firm believer.
“It’s an important distinction, and one that is very “”unpopular.”” if this had not been the case how will the “CNBC”s of the world eke out a living!
USD possibly starting its 5th leg down? Awaiting channel breach for confirmation to bode well for Gold, in the short term.
Within minor A move minute iii up to the next swing high, now minute iii looks like a perfect five wave impulse.
Where you have minor B (blue) move that over to the left, the swing low you have labelled minute a (pink). Don’t accept a truncation like that to try and make your wave count work.
Moving minor B to the low just prior now means minor C has a count of 7, it needs one more high to be complete.
Finally, consider that instead of a 5-3-5 zigzag completing, this could also be 5-3-5 for waves 1-2-3 of an impulse. So the high of minor A would be equivalent to a first wave. That’s the price point which differentiates the two ideas and so a new low below that price point tells you it’s more likely a zigzag and it should be done.
Does that all make sense?
I am absolutely thrilled to have you review and comment on my wave analysis. I sincerely appreciate it.
Every point is absolutely worth its weight in gold 🙂
Truncated flat. Very true! Point well taken.
“That’s the price point which differentiates the two ideas and so a new low below that price point tells you it’s more likely a zigzag and it should be done” = Invalidation point. 4 overlapping 1. Fantastic. I need to internalize this into my thought process.
“Moving minor B to the low just prior now means minor C has a count of 7, it needs one more high to be complete.” I am afraid, this is not clear to me. May I bother you to kindly explain this again, please? Thanks.
“Does that all make sense?” = the teacher 🙂
Thank you kindly, Lara. Much obliged.
David,
Impulses have a count of 5 (waves) and extended impulses have a count of 9, 13, 17, etc depending on how many extensions there are. A count of 7 is a corrective wave.
So in the case of Minor C in your chart, it needs to be an impulse. When you move Minor B down to the previous low as Lara suggests, Minor C then has a count of 7. The final structure needs to be a 1-2, 1-2, 3-4, 3-4, 5 for a count of 9. That’s why Lara says one more final high is needed. Hope this helps. 🙂
Wonderful Dreamer.
I wish there was a way to set an alert or email when there is a response to a post. I missed this response of yours. Today, I was revisiting this post and comments and saw your response.
Thank you kindly.
A look at GDX hourly
https://www.tradingview.com/x/zhixjwpl/
Superb Dreamer. I did not catch the I H&S, thank you.
Also, thank you for suggesting TradingView for EW counts, I now have circled counts. Much appreciated.
Btw do you publish your charts on TradingView ? I mean, would I be able to see it there, when I log in?
Thanks.
Hi David,
Glad you like TV. I look forward to seeing some of your charts.
You won’t see my charts on TV as I haven’t been posting there, just here.
Thank you Dreamer. I shall follow your example and post only here. But, they will be nowhere even close to your charts or of course Lara’s. Thanks.
Hi Lara
I’d like to revisit the subject of your data feed. There’s hardly a day without some kind of gap or spike that is not found on any other data feeds. I have access to 3 feeds and it’s possible to access more on line for further evidence.
I take your point that as long as you are consistent with your data source then the analysis should be sound. However, that assumes that your feed is at variance in a consistent way, and it clearly is not.
Reference the second hourly chart above. At 1700 hours Eastern there is a spurious spike down and on the previous day at exactly the same time there is a green candlestick implying a $6 gap down which clearly didn’t happen. Many feeds provide data for 23 out of 24 hours and 1700 Eastern is the exact time that other feeds are closed. I doubt if that is a coincidence. On the 1st November there is another spike at exactly 1700 hours and there are many more previously.
Although many times it doesn’t matter to the analysis, sometimes it does. For example, most feeds recently showed what could be a 1,2 but your data showed the 2 exceeding the origin of 1, forcing you to see it as a flat from the previous move.
Is it possible to use another source without messing up your established routines?
P.S. I used to be ‘Johno’ on the board.
Johno,
I agree that the Barchart data is suspicious when it spikes. As you know, I chart on Trading view and my patterns are often slightly different than Lara’s. Often though, we can get to the same conclusion with a slightly different count.
I know Lara is limited to data feeds that work with MotiveWave. You can go to MotiveWave.com and see the data feeds that work. Is there another feed that you would recommend?
No, because I don’t subscribe to a separate feed, but gain access through different brokers. Plus there are motive wave specific issues as you know.
Supported Brokers
http://www.motivewave.com/brokers/brokers.htm
Supported data feeds
http://www.motivewave.com/brokers/data_services.htm
My problem Johno is data feeds that synch with Motive Wave AND Mac. Not easy.
And I’m paying a reasonable amount of $$ for this BarChart feed.
They tell me they’re using COMEX data. And so the data from that one exchange may be different from other data feeds.
Understood. Keep an eye on the 5-6 pm (New York) bar and I think you will find that is the suspicious area.
Yeah, that’s what I’ve noticed.
Dreamer and I have both noted that the weird spikes we see do seem to often portend the next direction for $GOLD price.
But the last spike was down… and today price is moving up…. so that doesn’t always work.