
Last week’s Silver analysis expected upwards movement to continue for the short term. This is exactly what has happened for the week. The targets remain the same.
Summary: Expect upwards movement for the short term to at least 17.505. Movement may continue to as high as 21.18.
New updates to this analysis are in bold.
Last monthly chart is here.
ELLIOTT WAVE COUNTS
FIRST WAVE COUNT
WEEKLY CHART
Click chart to enlarge.
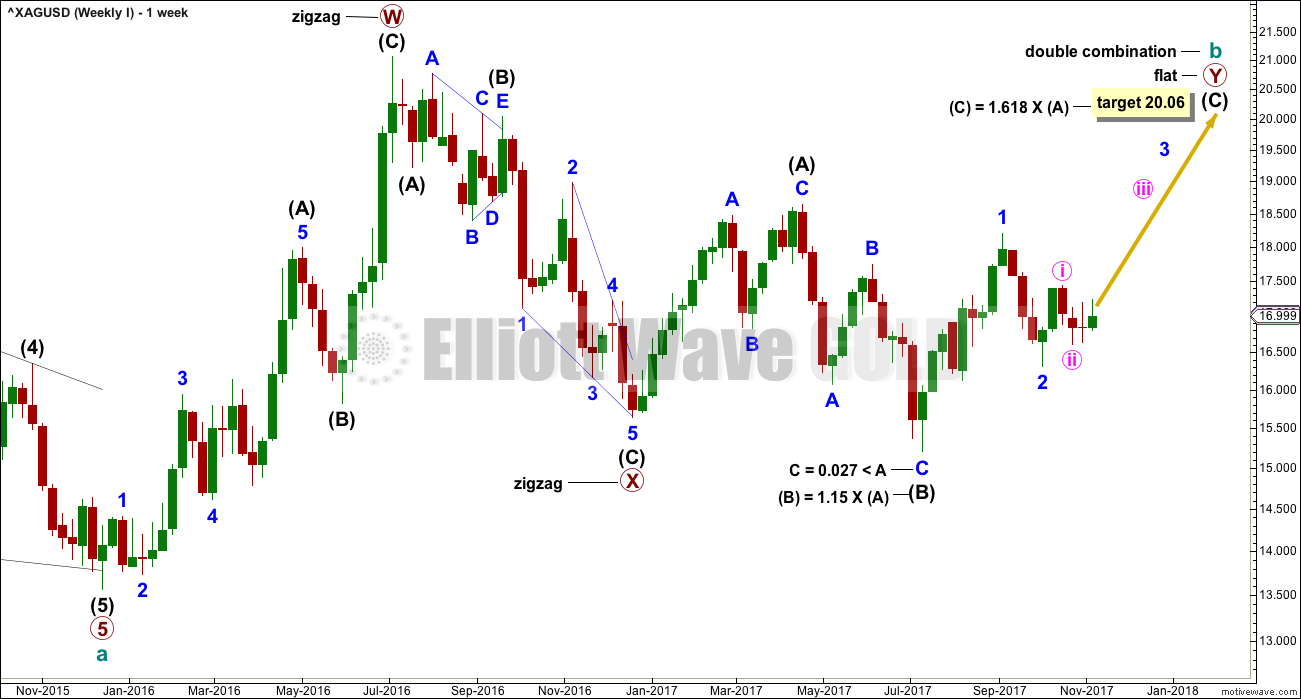
Cycle wave b may be completing as a double combination: zigzag – X – flat. The second structure, a flat correction for primary wave Y, may be underway.
Within a flat correction, intermediate wave (B) must retrace a minimum 0.9 length of intermediate wave (A) at 15.938. Intermediate wave (B) has met this minimum requirement; the rule for a flat correction is met. Intermediate wave (B) is longer than 1.05 times the length of intermediate wave (A) indicating this may be an expanded flat. Expanded flat corrections are the most common type. Normally their C waves are 1.618 or 2.618 the length of their A waves.
The target calculated would see primary wave Y to end close to same level as primary wave W about 21.062. The purpose of combinations is to take up time and move price sideways. To achieve this purpose the second structure in the double normally ends about the same level as the first.
While the combination wave count at the weekly chart level does not currently work for Gold, it does still work for Silver. They do not have to complete the same structures for cycle wave b, and fairly often their structures are different.
DAILY CHART
Click chart to enlarge.
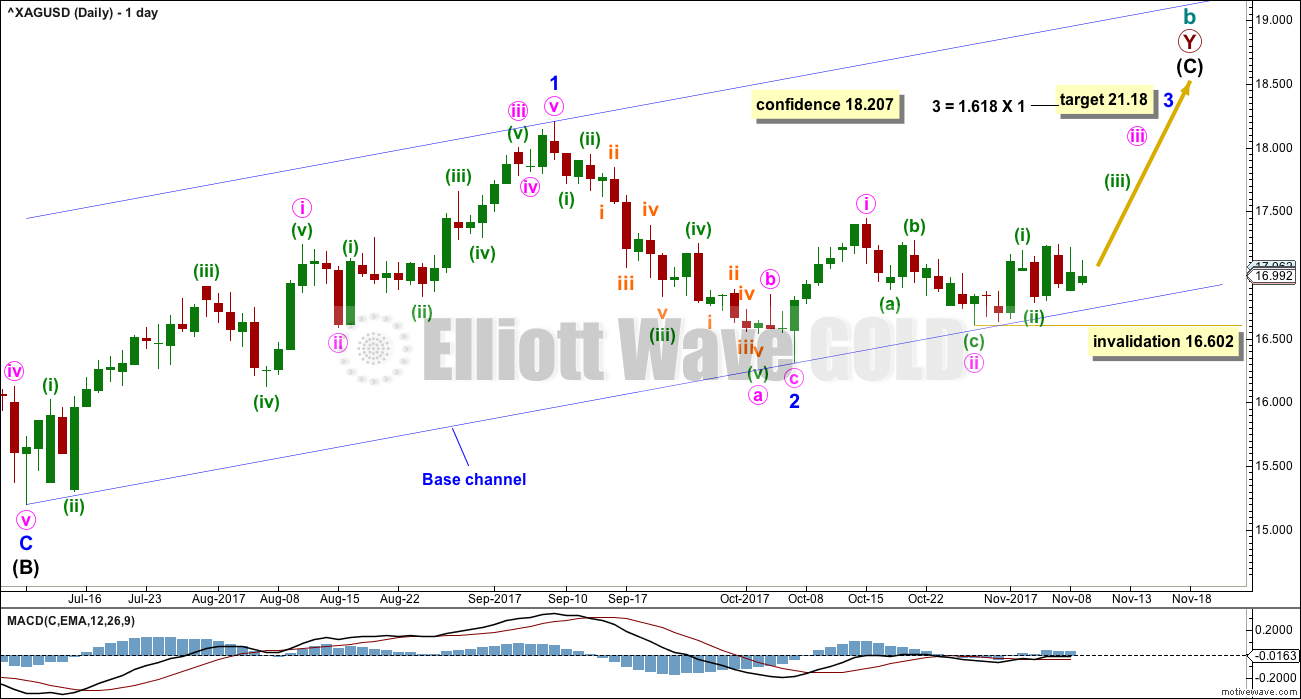
For this first wave count, upwards movement for intermediate wave (C) must subdivide as a five wave structure. It may be unfolding as an impulse.
Within the impulse of intermediate wave (C), only minor wave 1 was over at the last high and now minor wave 2 may now be complete.
Minor wave 2 may have ended very close to the most likely point of the 0.618 Fibonacci ratio of minor wave 1 at 16.347.
Minor wave 1 lasted 44 days. Minor wave 2 may have completed in 20 days, just one short of a Fibonacci 21.
Minor wave 3 may only subdivide as an impulse. It would be very likely to show its subdivisions clearly at the daily chart level. Minute waves ii and iv within it should show up as multi day pullbacks or sideways consolidations. Minute wave ii now shows up at the weekly and daily chart levels.
Within minute wave iii, no second wave correction may move beyond its start below 16.602.
A base channel is added to minor waves 1 and 2. Downwards movement is finding very strong support at the lower edge of this base channel. If price breaks below the base channel, then the probability of this wave count would substantially reduce prior to invalidation.
This wave count now expects to see a strong increase in upwards momentum as a third wave up at three degrees unfolds.
SECOND WAVE COUNT
WEEKLY CHART
Click chart to enlarge.
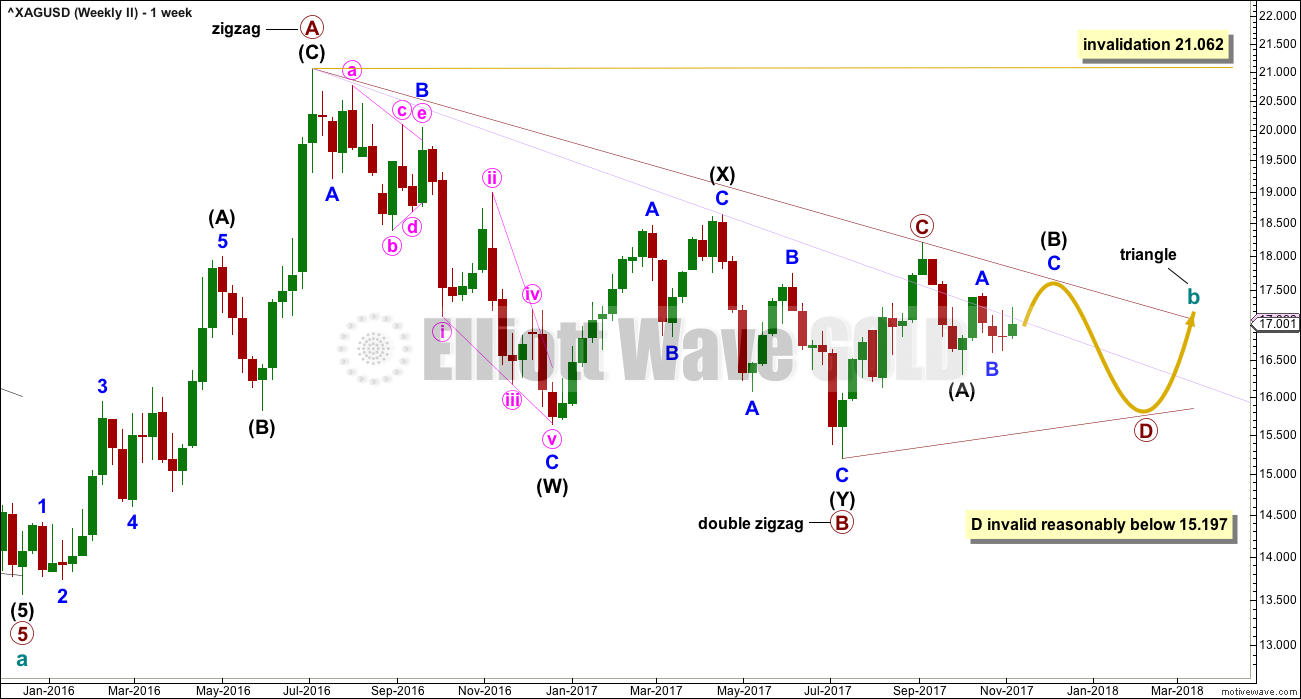
It remains possible for Silver that a large regular contracting or regular barrier triangle may be completing.
Within a triangle, one of the sub-waves must be a more complicated multiple, usually a multiple zigzag. This may be complete for primary wave B.
Primary wave C upwards may now be complete. The upper A-C trend line does have a fairly steep slope though, so it must be accepted that primary wave C may not be over and may continue higher. If it does, it may not move beyond the end of primary wave A above 21.062.
Primary wave C must subdivide as a three wave zigzag.
DAILY CHART
Click chart to enlarge.
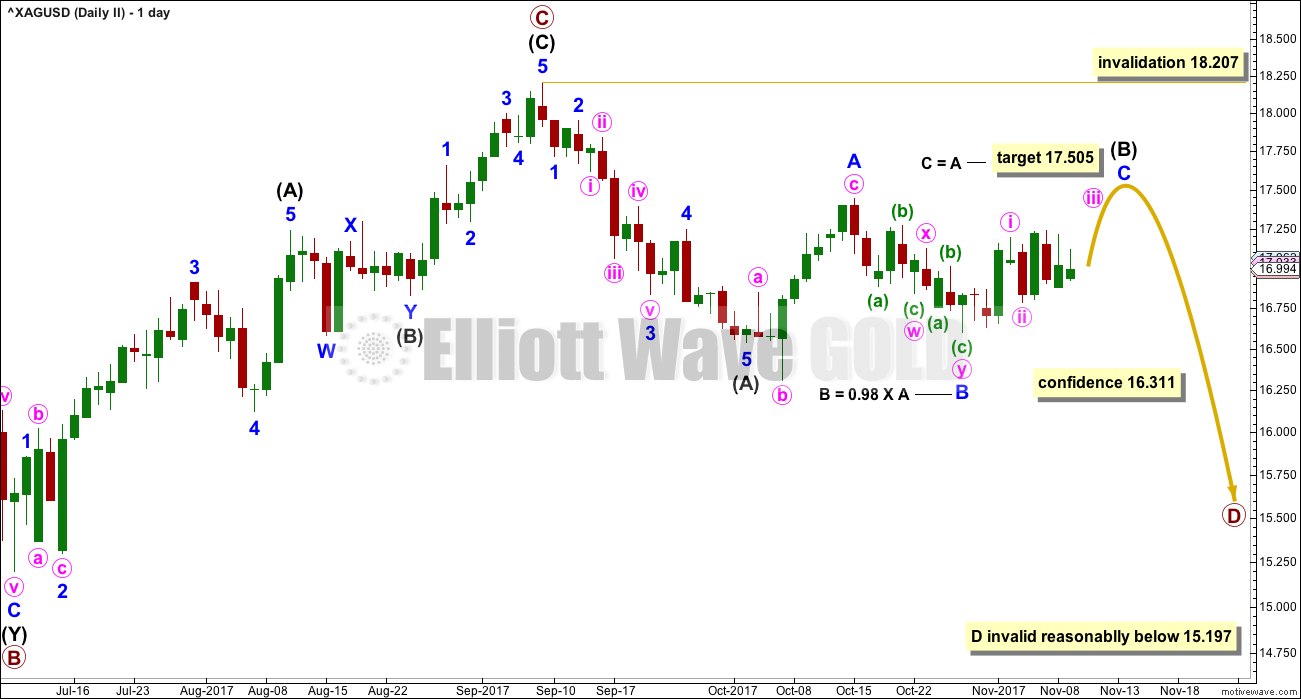
Primary wave C now looks complete and primary wave D downwards looks to have begun for this wave count. Primary wave D downwards must subdivide as a zigzag, which subdivides 5-3-5.
Primary wave D of a contracting triangle may not move beyond the end of primary wave B below 15.197.
Primary wave D of a barrier triangle may end about the same level as primary wave B at 15.197; as long as the B-D trend line is essentially flat, the triangle will remain valid. Unfortunately, there is some subjectivity in this rule; it is not black and white.
Within primary wave D, intermediate wave (A) now looks like a complete impulse.
Intermediate wave (B) does not look complete and may be continuing further sideways as a longer lasting flat correction.
It may also be a combination or triangle, so labelling within it may yet change in coming weeks as the structure becomes clearer.
If intermediate wave (B) is a flat correction, then within it minor wave B must retrace a minimum 0.9 length of minor wave A and may make a new low below the start of minor wave A. At 0.98 the length of minor wave A, minor wave B has met the minimum requirement for a flat correction.
Thereafter, minor wave C should move higher and would most likely end above the end of minor wave A at 17.441 to avoid a truncation.
If intermediate wave (B) is a triangle, then price may move sideways in an ever decreasing range for another two or so weeks.
Intermediate wave (B) may not move beyond the start of intermediate wave (A) above 18.207.
TECHNICAL ANALYSIS
WEEKLY CHART
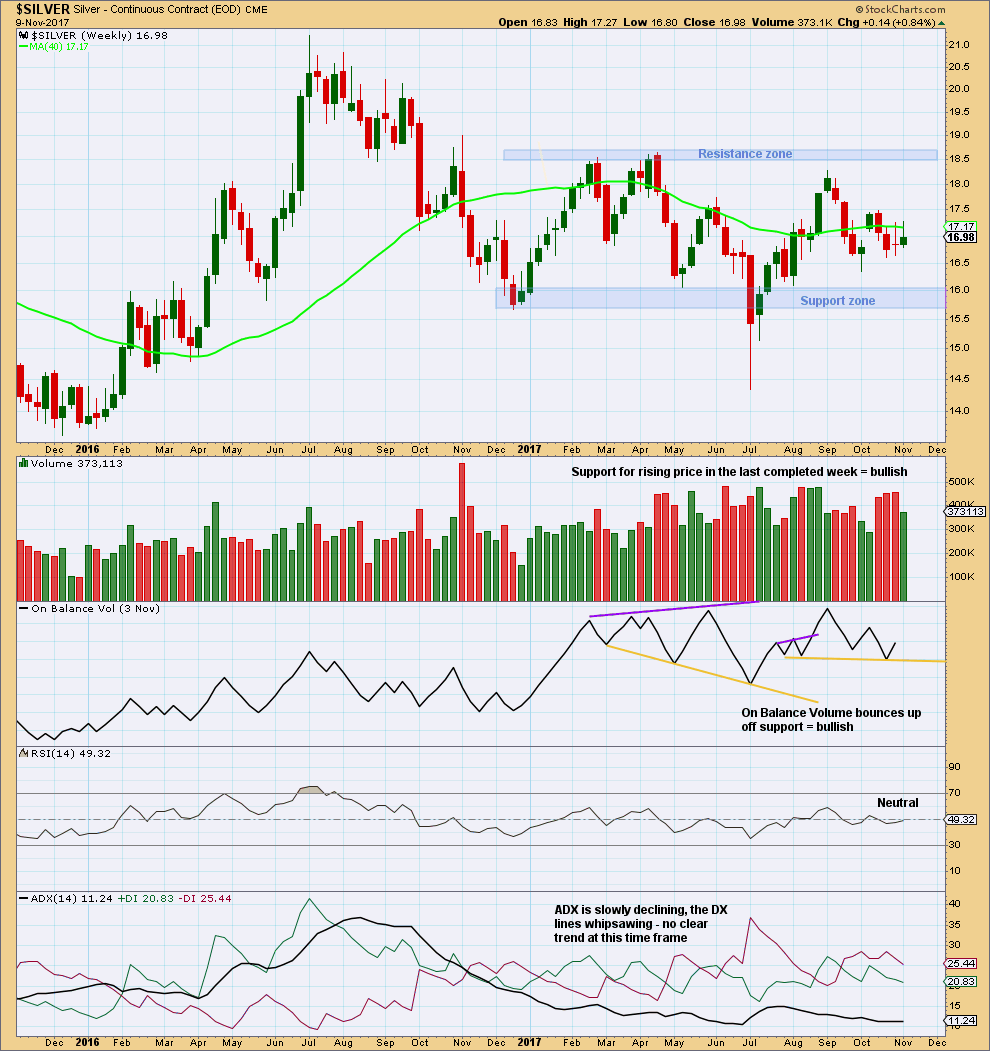
Click chart to enlarge. Chart courtesy of StockCharts.com.
The strongest week during this large consolidation is a downwards week ending 12th of June. However, this is stronger by only a small margin. The next strongest week is an upwards week. It may be better to look at daily volume bars to determine the most likely direction of a breakout from this consolidation.
The last completed week moved price higher with an increase in volume. This is bullish.
The support line for On Balance Volume was not working, so it has been redrawn. This line is now almost horizontal, has been tested three times, and is reasonably long held. It offers reasonable technical significance. The bounce up from support is a reasonable bullish signal.
DAILY CHART

Click chart to enlarge. Chart courtesy of StockCharts.com.
ADX, ATR and Bollinger Bands all indicate a consolidation. It is upwards days during this consolidation which have strongest volume suggesting an upwards breakout is more likely than downwards.
Watch On Balance Volume carefully in the next few days for a signal.
Published @ 07:42 p.m. EST.