
The main Elliott wave count expected more upwards movement.
Price is above 55.24, so the main Elliott wave count is the sole wave count left.
The target has not yet been met.
Summary: A sideways consolidation about here may develop, which may last about 8 sessions. Thereafter, the upwards trend should resume to a target at 61.42.
New updates to this analysis are in bold.
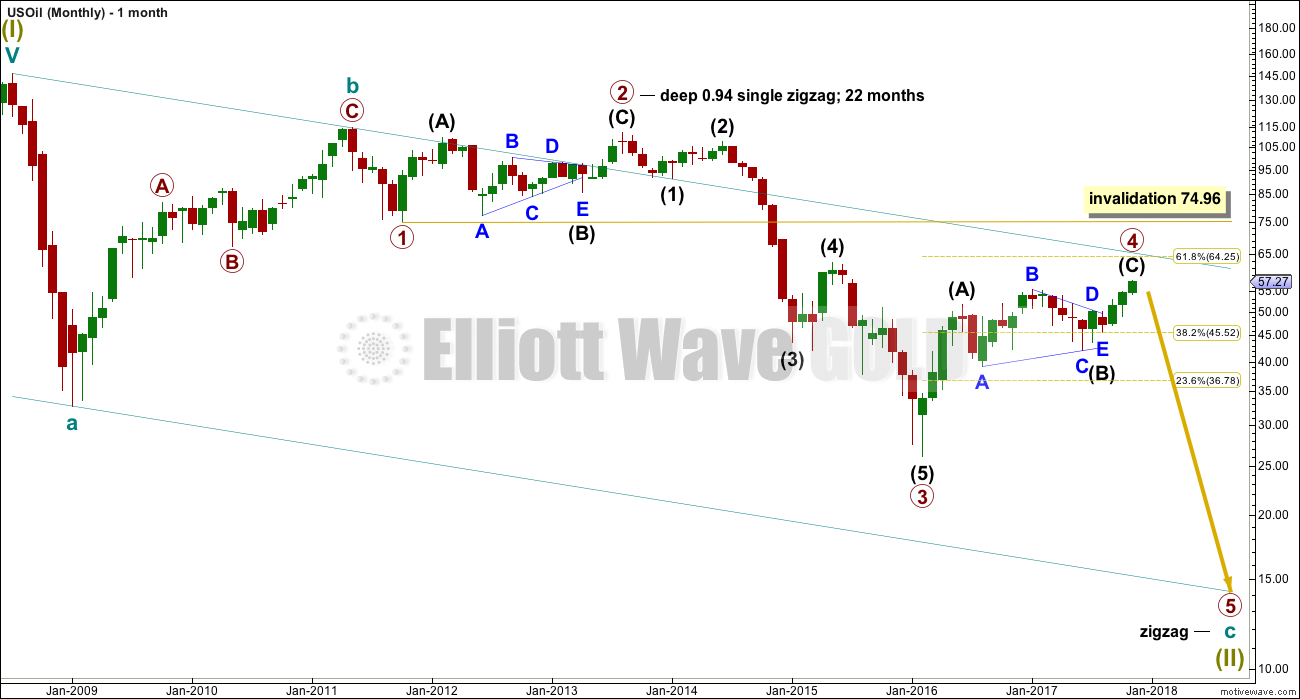
MONTHLY ELLIOTT WAVE COUNT
Click chart to enlarge.
Within the bear market, cycle wave b is seen as ending in May 2011. Thereafter, a five wave structure downwards for cycle wave c begins.
Primary wave 1 is a short impulse lasting five months. Primary wave 2 is a very deep 0.94 zigzag lasting 22 months. Primary wave 3 is a complete impulse with no Fibonacci ratio to primary wave 1. It lasted 30 months.
There is alternation in depth with primary wave 2 very deep and primary wave 4 relatively shallow. There is inadequate alternation in structure, both are zigzags. So far primary wave 4 has lasted 21 months. So far there is good proportion between primary waves 2 and 4.
Primary wave 4 may not move into primary wave 1 price territory above 74.96.
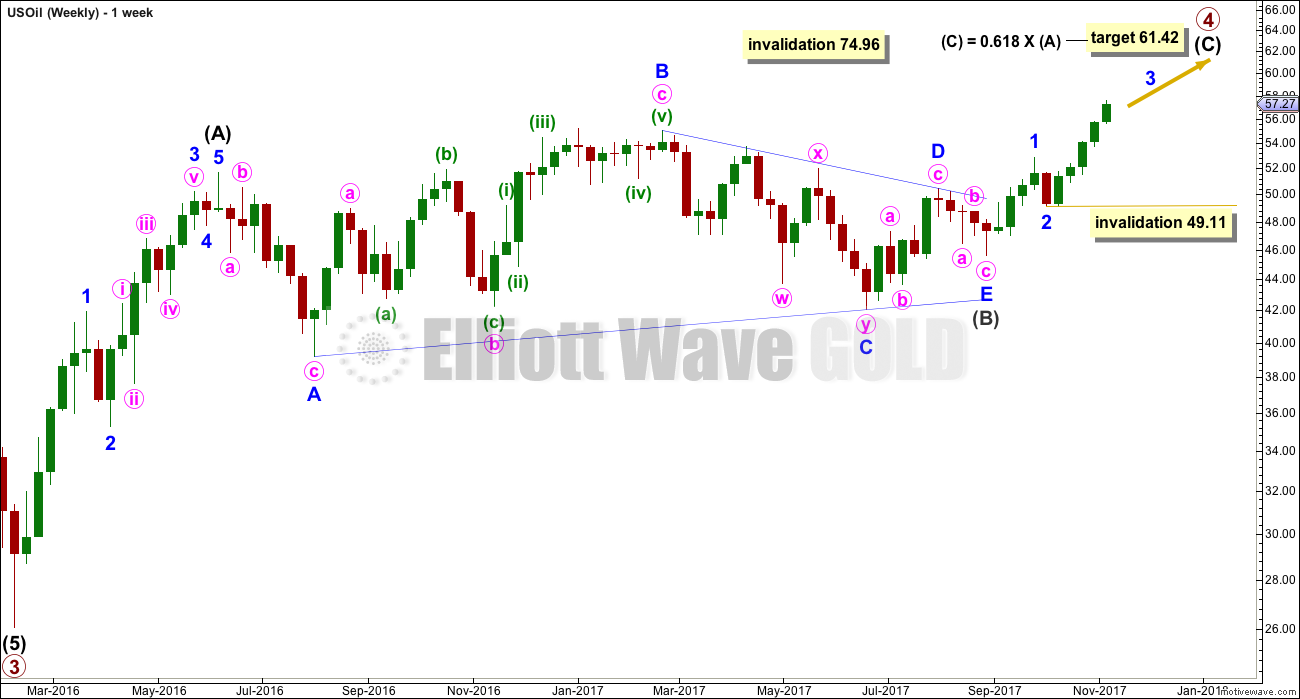
WEEKLY ELLIOTT WAVE COUNT
Click chart to enlarge.
Intermediate wave (C) must subdivide as a five wave structure, either an impulse or an ending diagonal. Within intermediate wave (C), minor waves 1 and 2 may be complete. Within minor wave 3, no second wave correction may move beyond the start of its first wave below 49.11.
When minor wave 3 is complete, then minor wave 4 should last at least one week (and most likely longer) and should show up at the weekly chart level, so that intermediate wave (C) has the right look at this time frame.
When intermediate wave (C) may again be seen as complete, then a trend change would again be expected and a target for primary wave 5 downwards would again be calculated. At this stage, for this wave count, a target cannot be calculated for it to end because the start of primary wave 5 is not known.
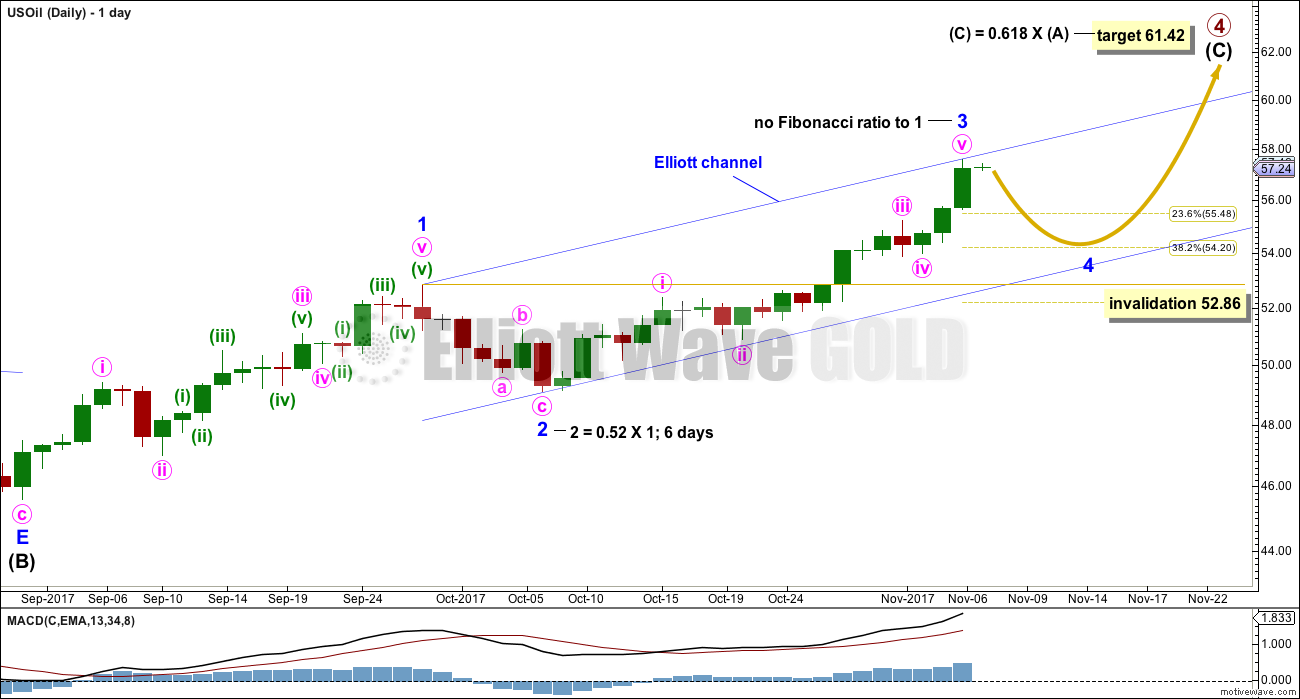
DAILY ELLIOTT WAVE COUNT
Click chart to enlarge.
Intermediate wave (C) must complete as a five wave structure. For this wave count, it looks like a possible impulse.
Minor wave 3 has passed the target for equality in length with minor wave 1.
A strong upwards day for the last day with strong volume looks like a typical blow off top, typical of the end of a third wave. After some consolidation for minor wave 4, then minor wave 5 upwards should complete this structure.
Minor wave 2 was a relatively deep zigzag lasting 6 days. Minor wave 4 may be a shallow flat, combination or triangle. It may last a little longer than minor wave 2 as sideways corrections tend to be a bit longer lasting. A Fibonacci 8 days may be the initial expectation.
The 0.382 Fibonacci ratio of minor wave 3 is within the price territory of minute wave iv. This looks like a reasonable target for minor wave 4 to end. Fourth waves often end within the price territory of the fourth wave of one lesser degree.
TECHNICAL ANALYSIS
DAILY CHART
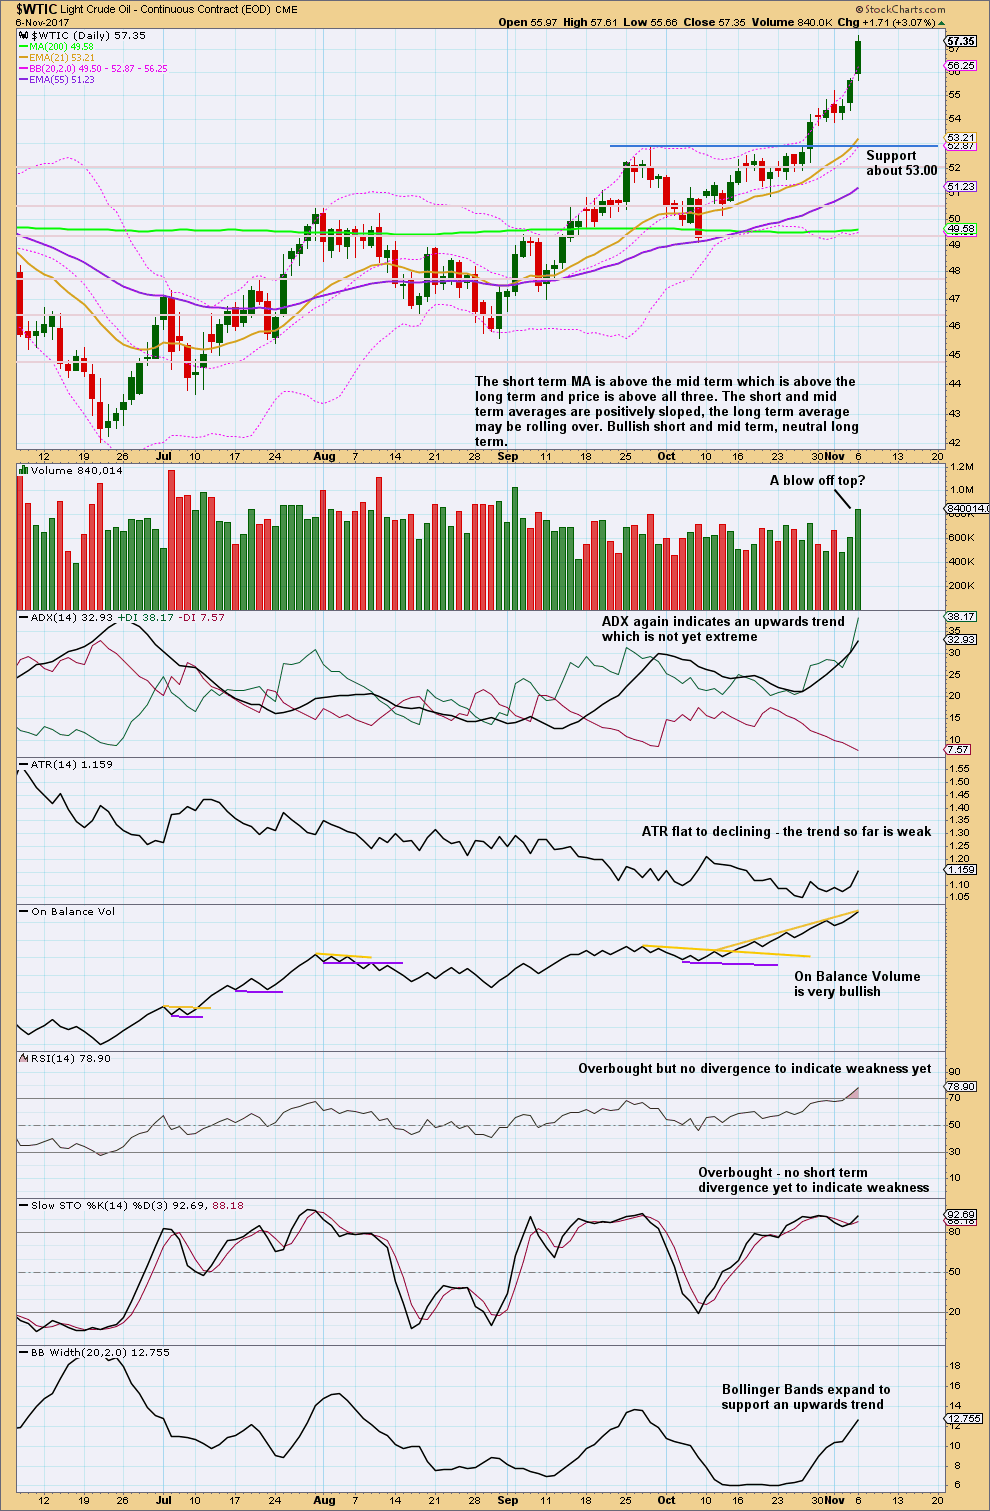
Click chart to enlarge. Chart courtesy of StockCharts.com.
With what looks like a possible blow off top and RSI being extreme, it seems reasonable to expect some consolidation about here.
The trend is up.
VOLATILITY INDEX
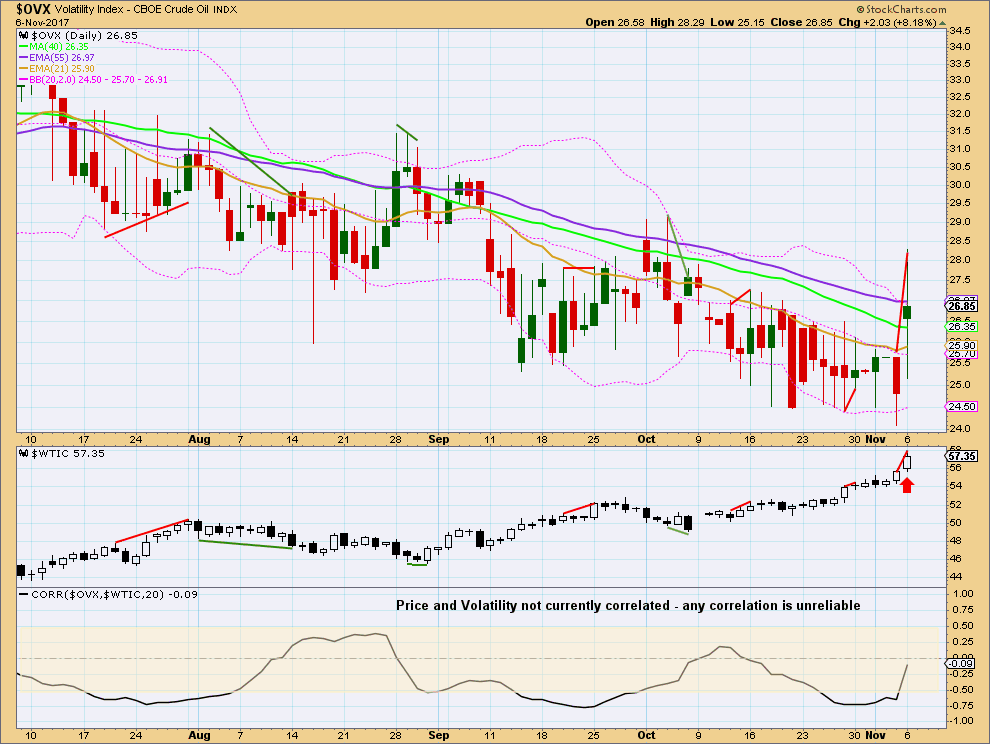
Click chart to enlarge. Chart courtesy of StockCharts.com.
Price moved higher for the last session, but volatility did not show a normal corresponding decline. The increase in volatility today is bearish.
Published @ 03:09 a.m. EST.