
The target for downwards movement to end was at 15.262. Price reached 15.525 and has turned there, 0.263 short of the target.
Summary: Look for upwards movement now for about one to four weeks. The target is at 17.132.
Always trade with stops and invest only 1-5% of equity on any one trade.
New updates to this analysis are in bold.
Last monthly chart is here.
The Elliott wave counts are presented this week in order of probability.
ELLIOTT WAVE COUNTS
MAIN WAVE COUNT
WEEKLY CHART
Click chart to enlarge.
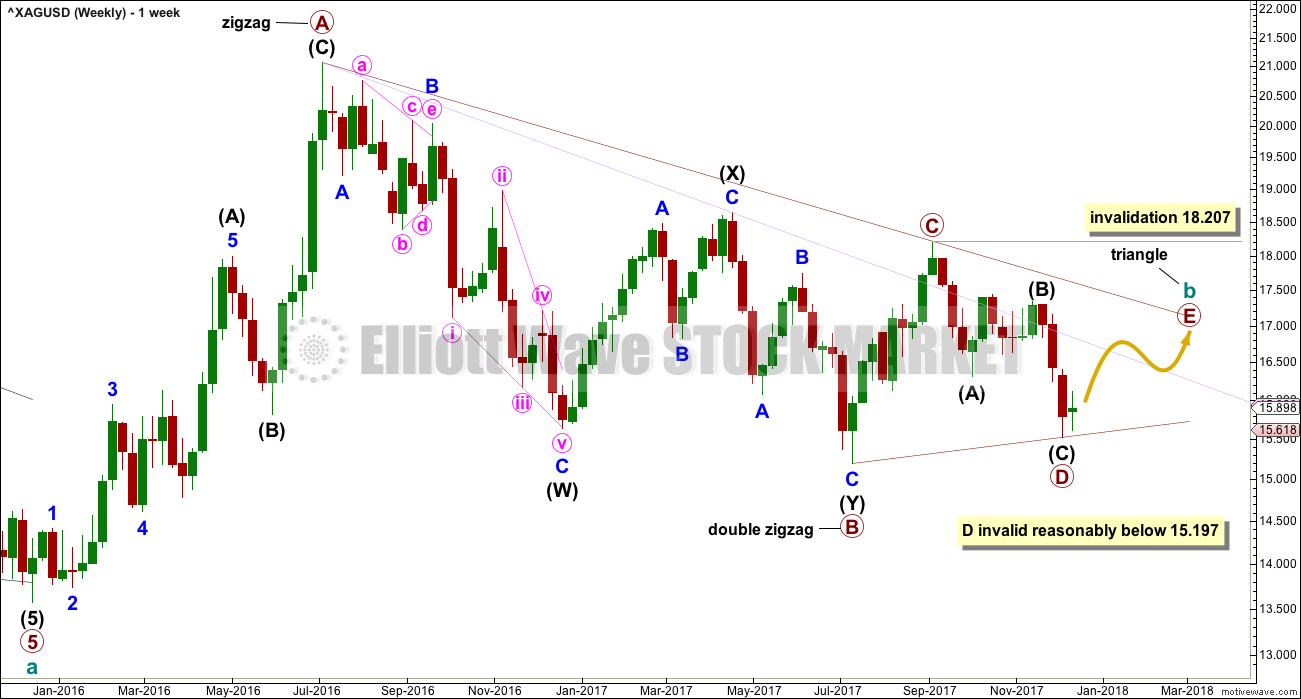
It remains possible for Silver that a large regular contracting triangle may be completing.
Within a triangle, one of the sub-waves must be a more complicated multiple, usually a multiple zigzag. This may be complete for primary wave B.
The triangle may now need only the final sub-wave of primary wave E upwards to complete it. Primary wave E would most likely fall reasonably short of the A-C trend line.
Primary wave E may not move beyond the end of primary wave C above 18.207.
DAILY CHART
Click chart to enlarge.
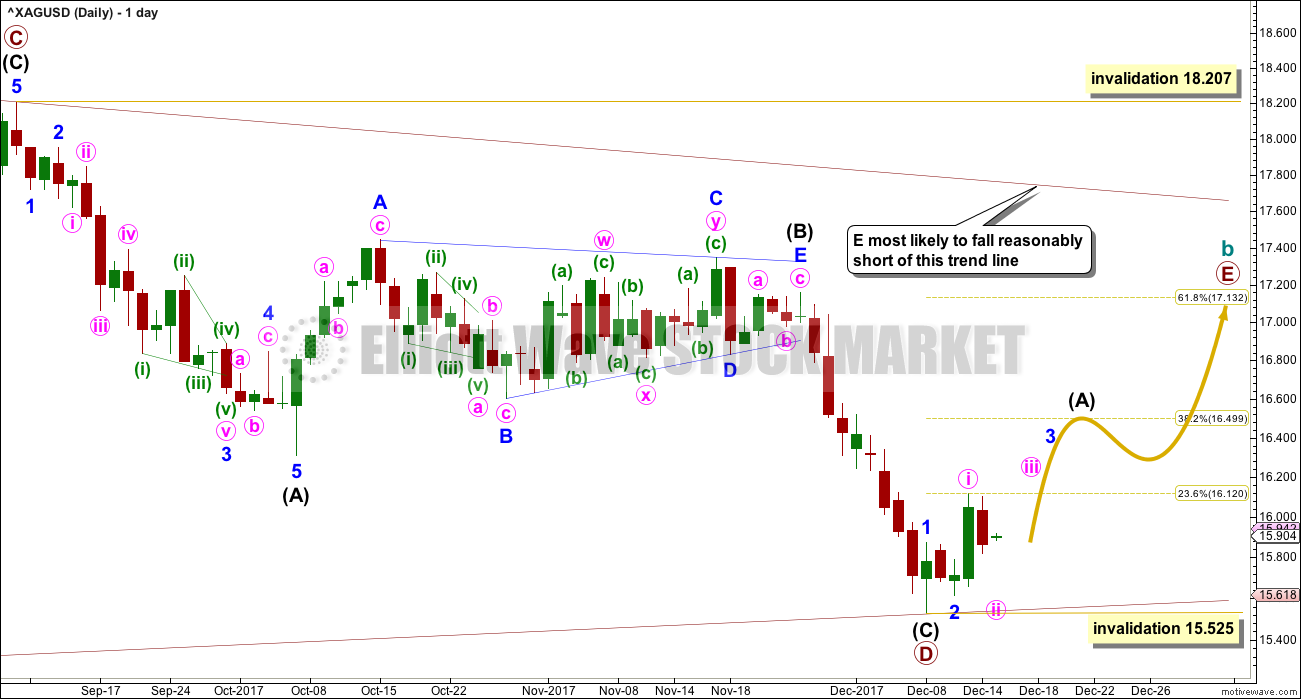
Primary wave D now looks like a completed zigzag. There is no reasonable Fibonacci ratio between intermediate waves (A) and (C) within it.
Primary wave E may end about the 0.618 Fibonacci ratio of primary wave D, at about 17.132. Primary wave E should be an obvious three wave structure, and intermediate wave (B) within it may be complicated and time consuming.
Within the zigzag of primary wave E, intermediate wave (B) may not move beyond the start of intermediate wave (A) below 15.525.
This wave count has the best look and has a very good fit. It is the preferred wave count now for Silver.
FIRST ALTERNATE WAVE COUNT
WEEKLY CHART
Click chart to enlarge.
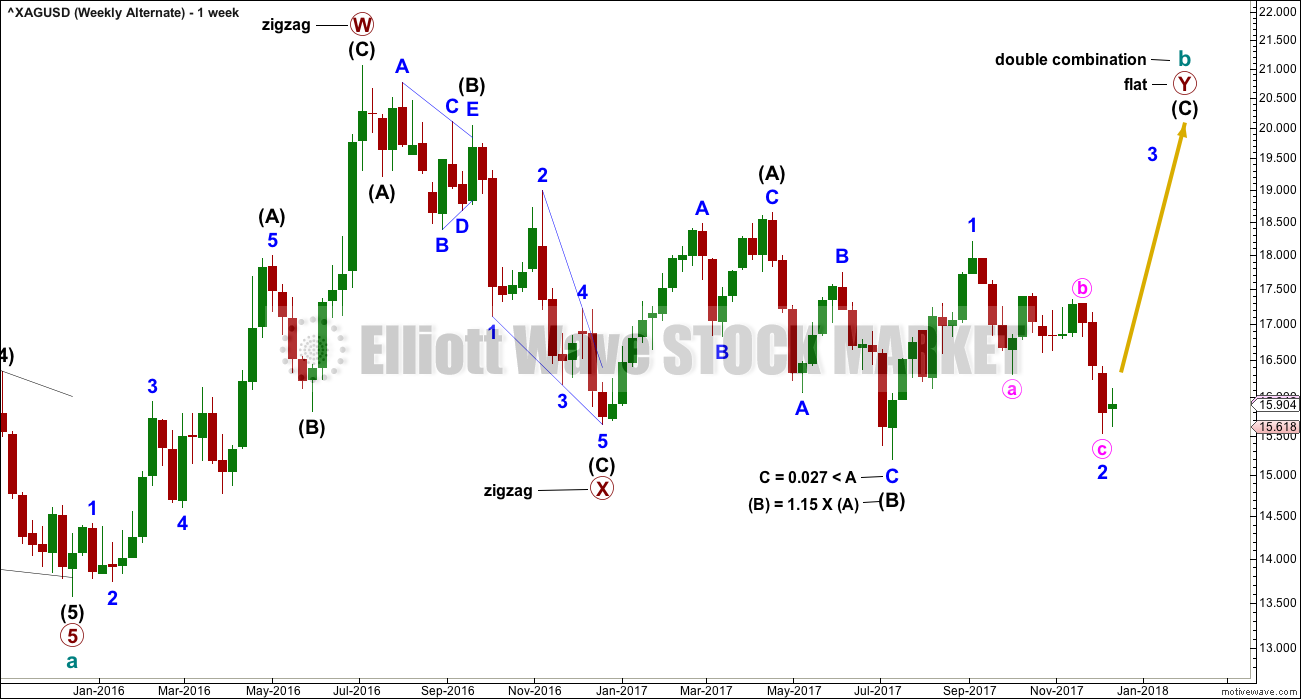
Cycle wave b may be completing as a double combination: zigzag – X – flat. The second structure, a flat correction for primary wave Y, may be underway.
Within a flat correction, intermediate wave (B) must retrace a minimum 0.9 length of intermediate wave (A) at 15.938. Intermediate wave (B) has met this minimum requirement; the rule for a flat correction is met. Intermediate wave (B) is longer than 1.05 times the length of intermediate wave (A) indicating this may be an expanded flat. Expanded flat corrections are the most common type. Normally their C waves are 1.618 or 2.618 the length of their A waves.
The target calculated would see primary wave Y to end close to same level as primary wave W about 21.062. The purpose of combinations is to take up time and move price sideways. To achieve this purpose the second structure in the double normally ends about the same level as the first.
While the combination wave count at the weekly chart level does not currently work for Gold, it does still work for Silver. They do not have to complete the same structures for cycle wave b, and fairly often their structures are different.
At this stage, the duration of minor wave 2 now looks wrong. This wave count is now less likely.
DAILY CHART
Click chart to enlarge.
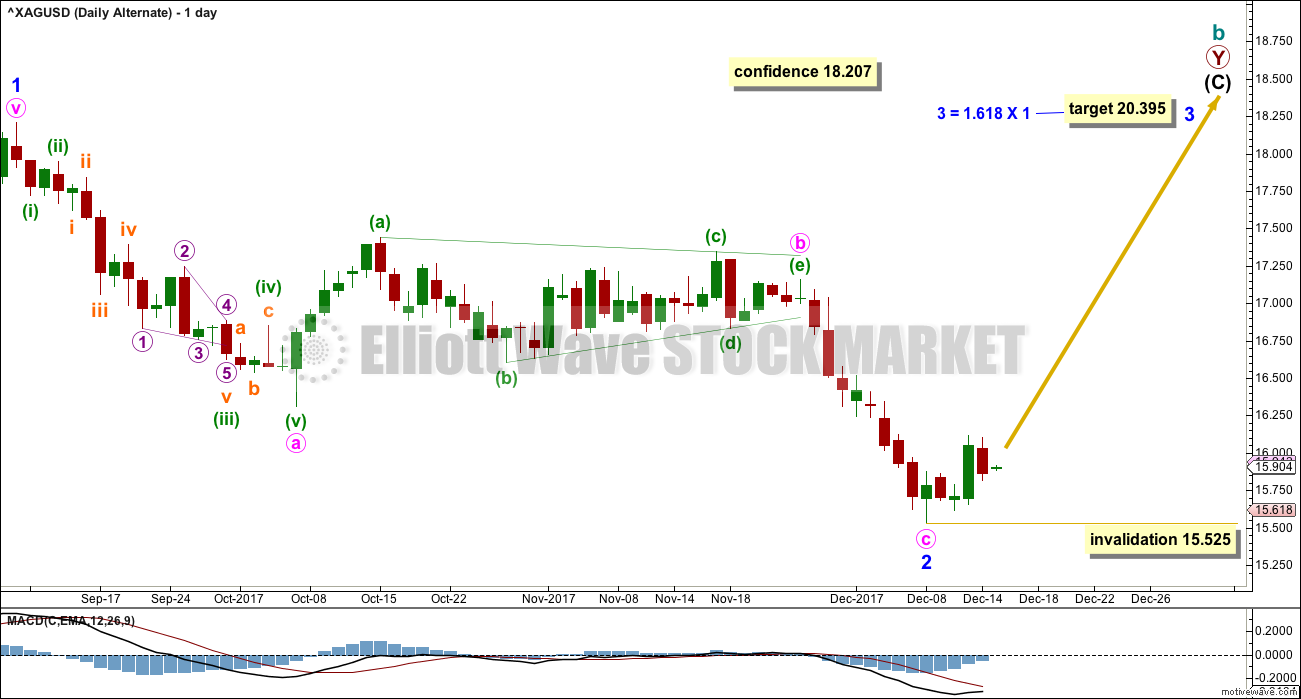
For this wave count, upwards movement for intermediate wave (C) must subdivide as a five wave structure. It may be unfolding as an impulse.
If minor wave 2 continues lower, it may not move beyond the start of minor wave 1 below 15.197.
The target for minor wave 3 is recalculated; it assumes the most common Fibonacci ratio to minor wave 1. If minor wave 2 continues lower, then the target must again be recalculated.
SECOND ALTERNATE WAVE COUNT
WEEKLY CHART
Click chart to enlarge.
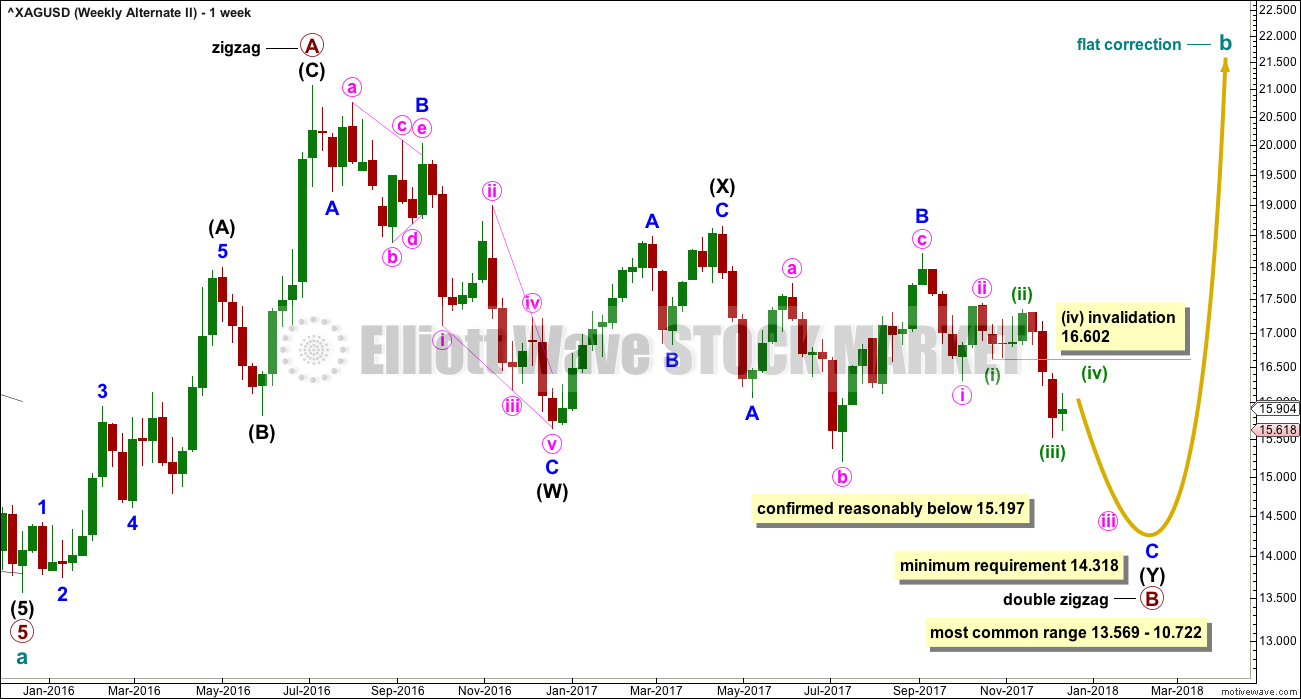
It is still possible that cycle wave b may be unfolding as a flat correction. Within a flat, both primary waves A and B must be three wave structures. A double zigzag is classified as a three.
Within the flat correction, primary wave B must retrace a minimum 0.9 length of primary wave A. Primary wave B may make a new price extreme beyond the start of primary wave A below 13.569, as in an expanded flat. Expanded flats are the most common type of flat correction.
If the first two wave counts are invalidated by a new low reasonably below 15.197, then only this third wave count would remain. It would then require more downwards movement overall to at least 14.318, and it would be likely that price could make a new low below 13.569.
TECHNICAL ANALYSIS
WEEKLY CHART
Click chart to enlarge. Chart courtesy of StockCharts.com.
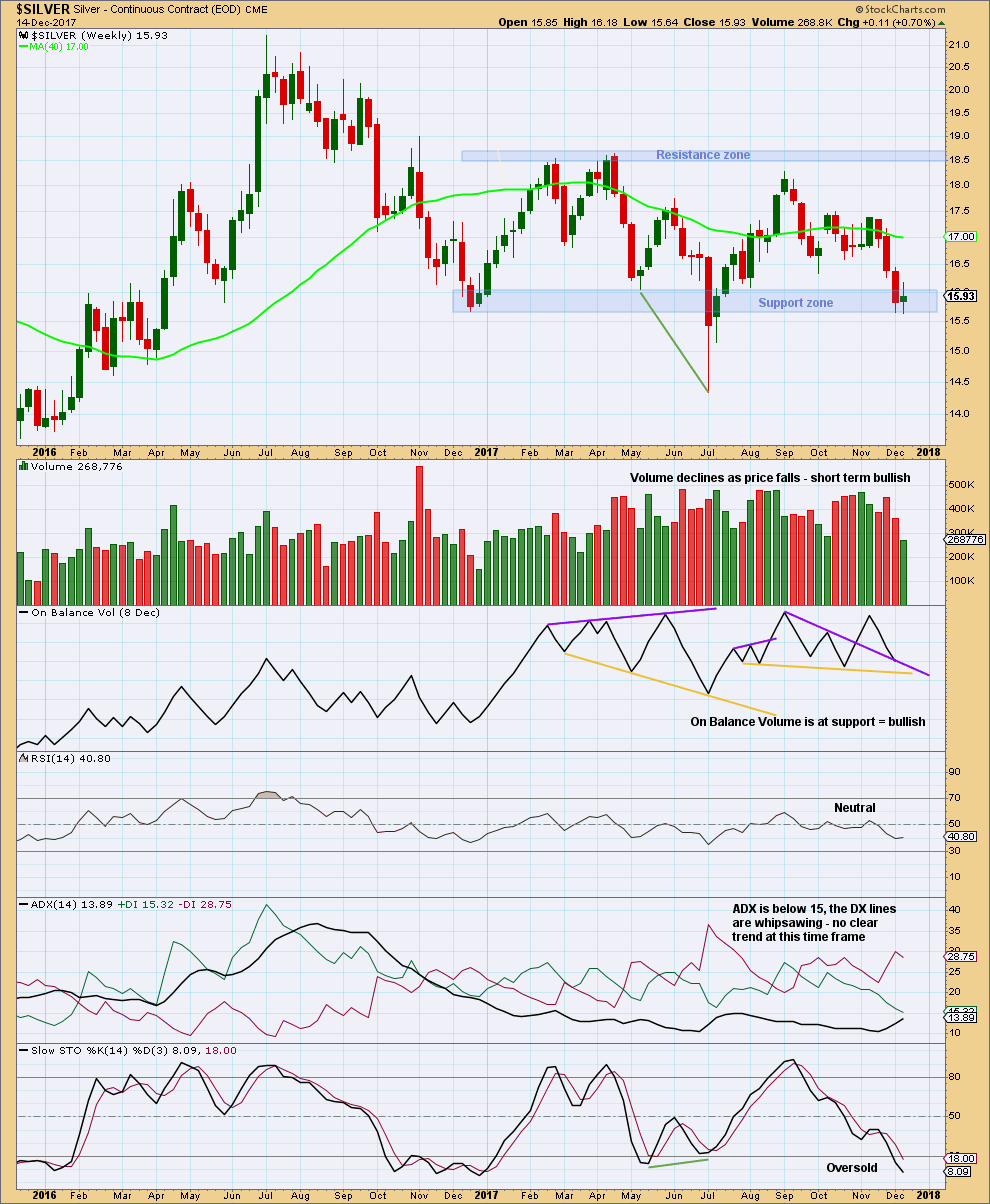
It looks like price may be bouncing up again off support. On Balance Volume is also at support. Stochastics is oversold.
DAILY CHART
Click chart to enlarge. Chart courtesy of StockCharts.com.
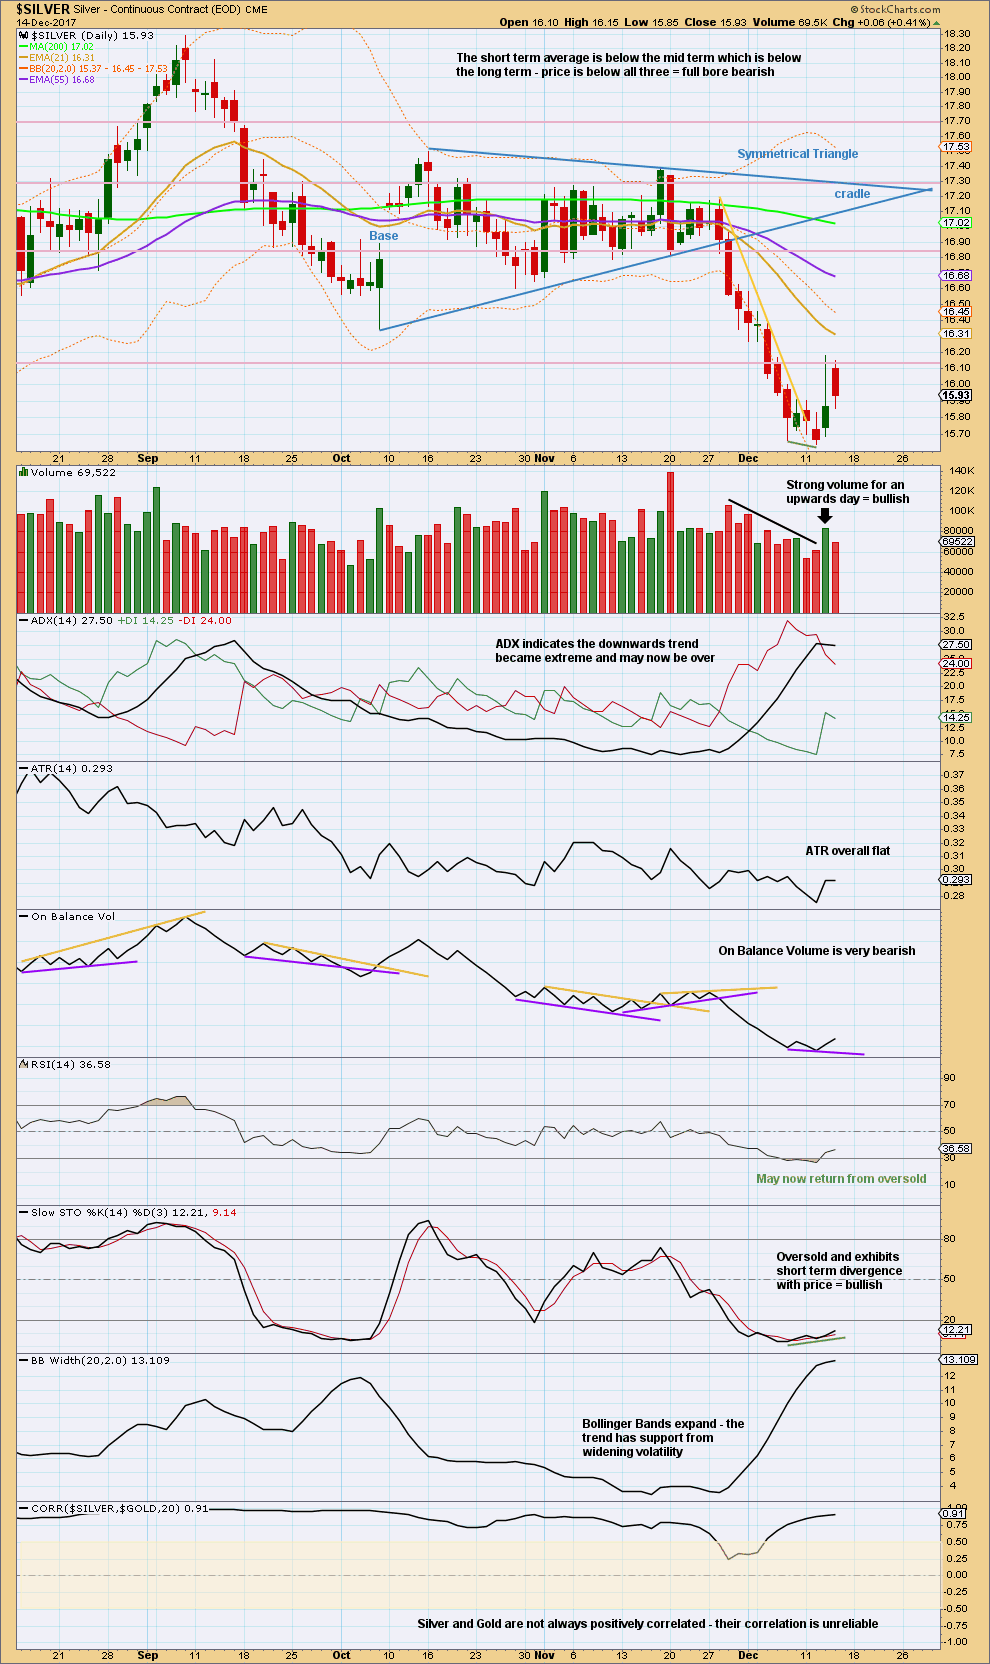
Price is bouncing up off support, which is about 15.68. Stochastics is oversold and exhibits divergence. RSI has reached oversold. For the short term, the volume profile is somewhat bullish.
It looks like Silver has found a low and may now move higher.
Published @ 01:45 a.m. EST.