
A downwards breakout was expected to be about a week or two away. The downwards breakout has come, about a week earlier than expected.
Summary: The classic analysis target is 15.74. The Elliott wave target is 15.262.
A second wave bounce may offer an entry point to join the downwards trend.
New updates to this analysis are in bold.
Last monthly chart is here.
ELLIOTT WAVE COUNTS
FIRST WAVE COUNT
WEEKLY CHART
Click chart to enlarge.
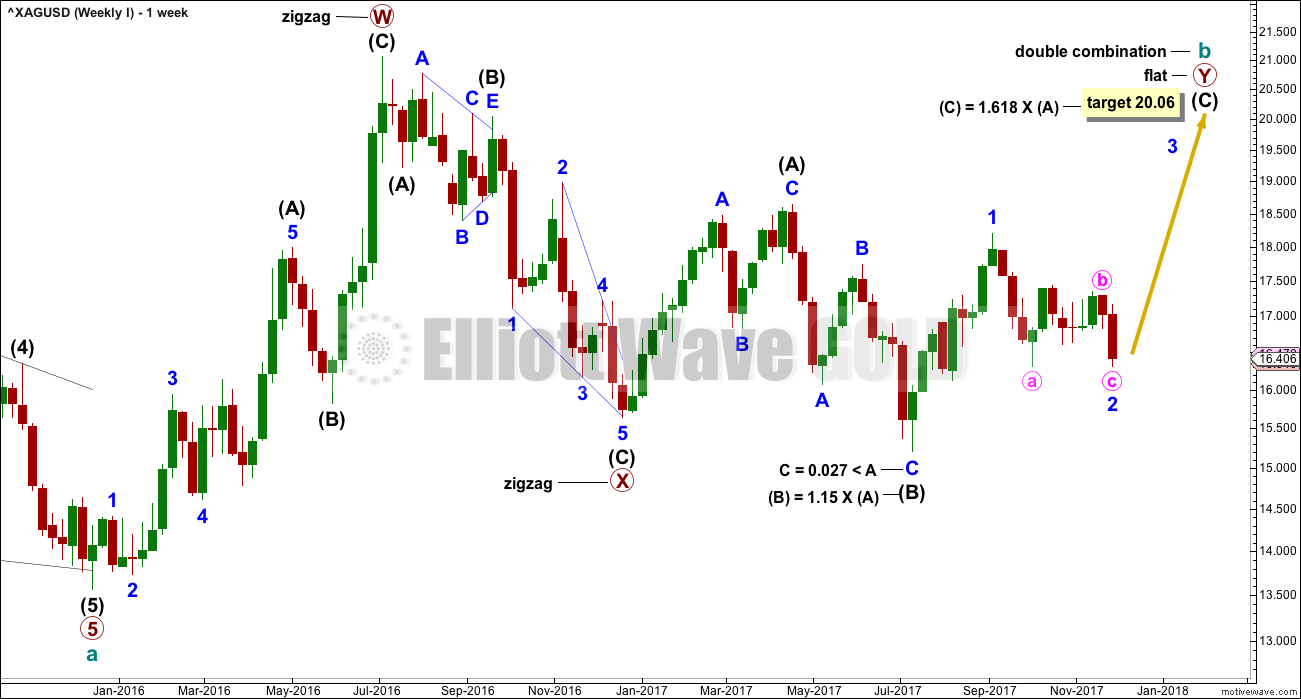
Cycle wave b may be completing as a double combination: zigzag – X – flat. The second structure, a flat correction for primary wave Y, may be underway.
Within a flat correction, intermediate wave (B) must retrace a minimum 0.9 length of intermediate wave (A) at 15.938. Intermediate wave (B) has met this minimum requirement; the rule for a flat correction is met. Intermediate wave (B) is longer than 1.05 times the length of intermediate wave (A) indicating this may be an expanded flat. Expanded flat corrections are the most common type. Normally their C waves are 1.618 or 2.618 the length of their A waves.
The target calculated would see primary wave Y to end close to same level as primary wave W about 21.062. The purpose of combinations is to take up time and move price sideways. To achieve this purpose the second structure in the double normally ends about the same level as the first.
While the combination wave count at the weekly chart level does not currently work for Gold, it does still work for Silver. They do not have to complete the same structures for cycle wave b, and fairly often their structures are different.
DAILY CHART
Click chart to enlarge.
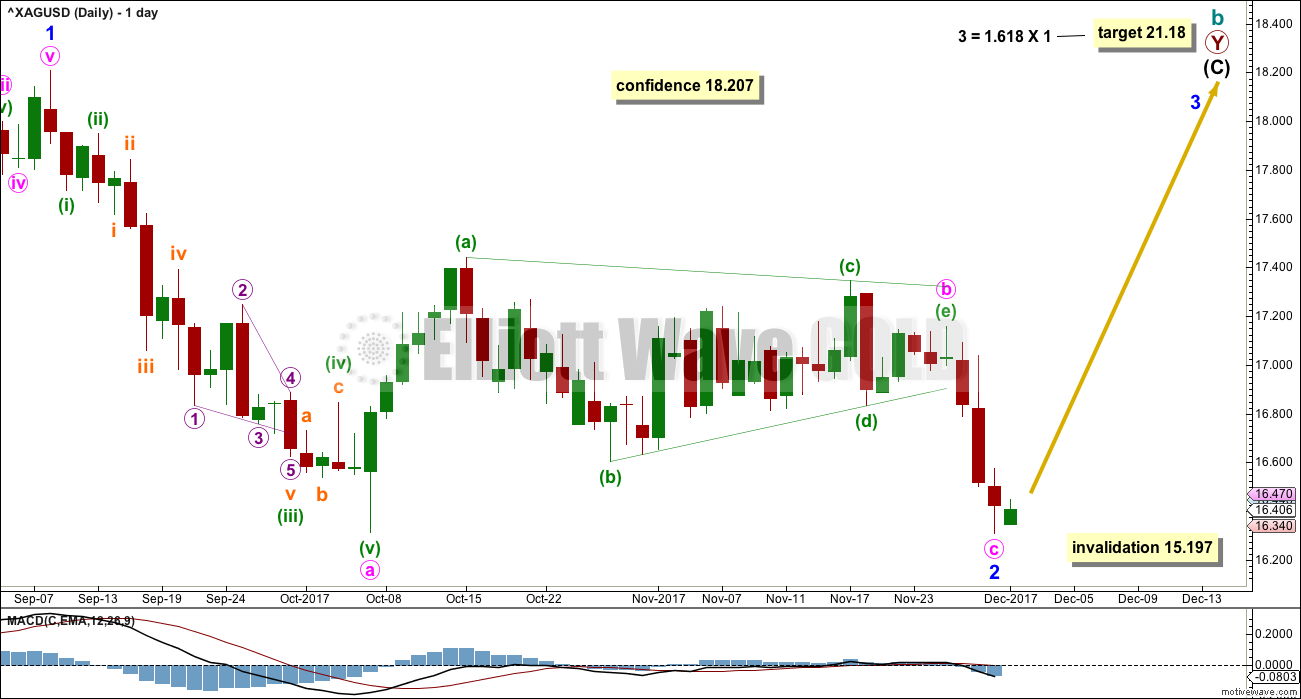
For this first wave count, upwards movement for intermediate wave (C) must subdivide as a five wave structure. It may be unfolding as an impulse.
Within the impulse of intermediate wave (C), only minor wave 1 was over at the last high and now minor wave 2 may now be complete.
Minor wave 2 may have ended very close to the most likely point of the 0.618 Fibonacci ratio of minor wave 1 at 16.347.
Minor wave 2 still subdivides as a zigzag, even though it moved lower. Within minor wave 2, minute wave b subdivides as a triangle.
If minor wave 2 continues lower, it may not move beyond the start of minor wave 1 below 15.197.
SECOND WAVE COUNT
WEEKLY CHART
Click chart to enlarge.
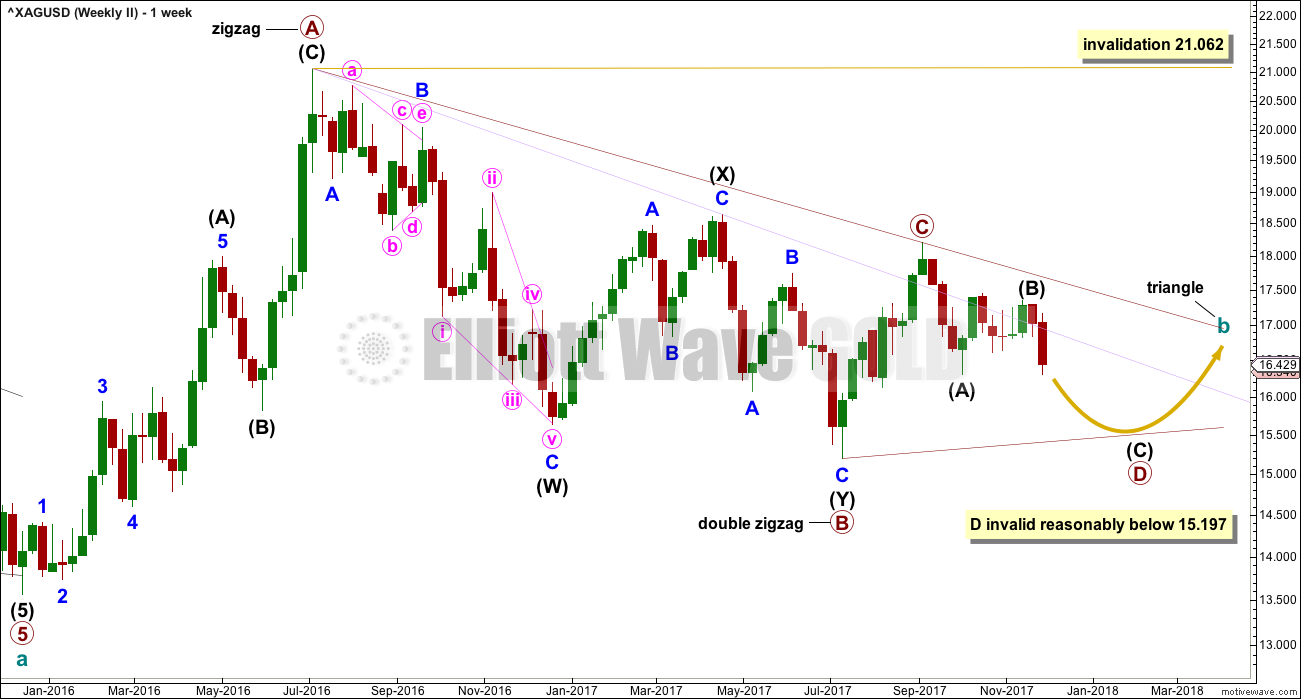
It remains possible for Silver that a large regular contracting or regular barrier triangle may be completing.
Within a triangle, one of the sub-waves must be a more complicated multiple, usually a multiple zigzag. This may be complete for primary wave B.
Primary wave C upwards may now be complete. The upper A-C trend line does have a fairly steep slope though, so it must be accepted that primary wave C may not be over and may continue higher. If it does, it may not move beyond the end of primary wave A above 21.062.
Primary wave C must subdivide as a three wave zigzag.
This triangle wave count now expects that primary wave D downwards may now be underway.
Primary wave D of a contracting triangle may not move beyond the end of primary wave B below 15.197.
Primary wave D of a barrier triangle may end about the same level as primary wave B at 15.197; as long as the B-D trend line is essentially flat, the triangle will remain valid. Unfortunately, there is some subjectivity in this rule; it is not black and white.
DAILY CHART
Click chart to enlarge.
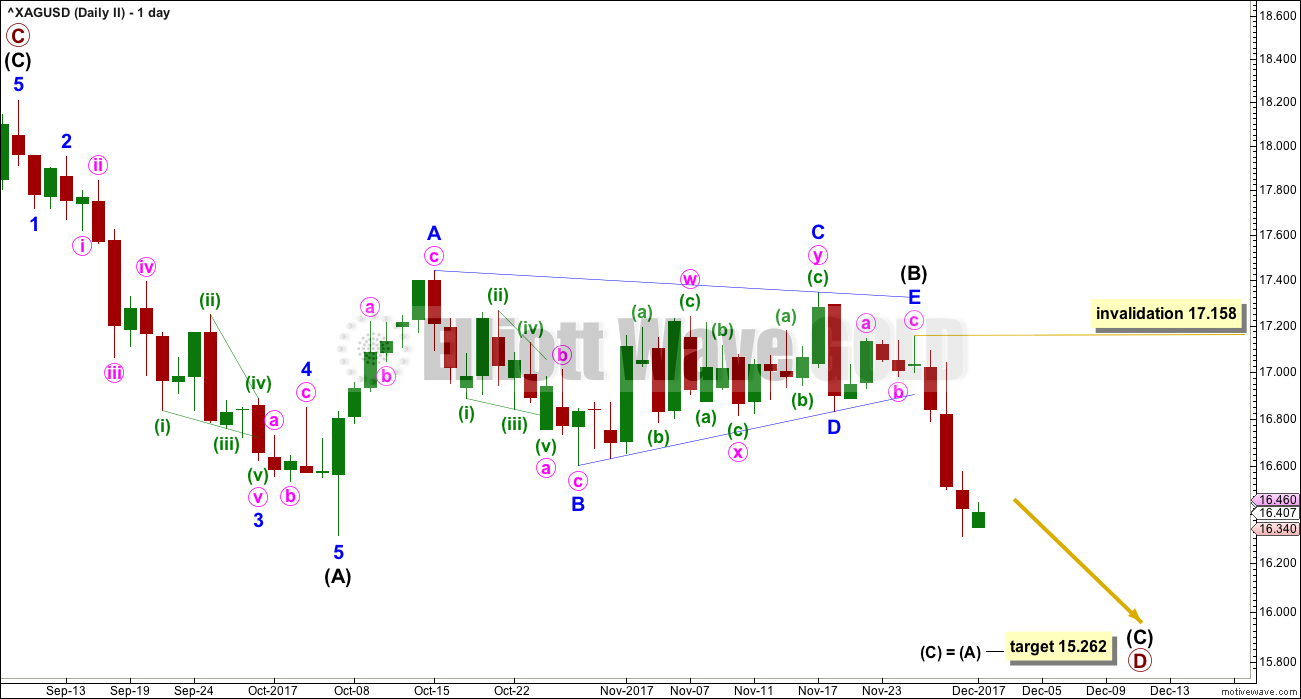
Primary wave D must subdivide as a zigzag. Within the zigzag, intermediate wave (B) may be a complete regular contracting triangle.
Within the triangle for intermediate wave (B), minor wave C sub-divides as a more complicated multiple, which is the most common sub-wave of a triangle to do so. Minor wave E has fallen reasonably short of the A-C trend line; this looks typical.
The target expects to see the most common Fibonacci ratio between intermediate waves (A) and (C).
TECHNICAL ANALYSIS
WEEKLY CHART
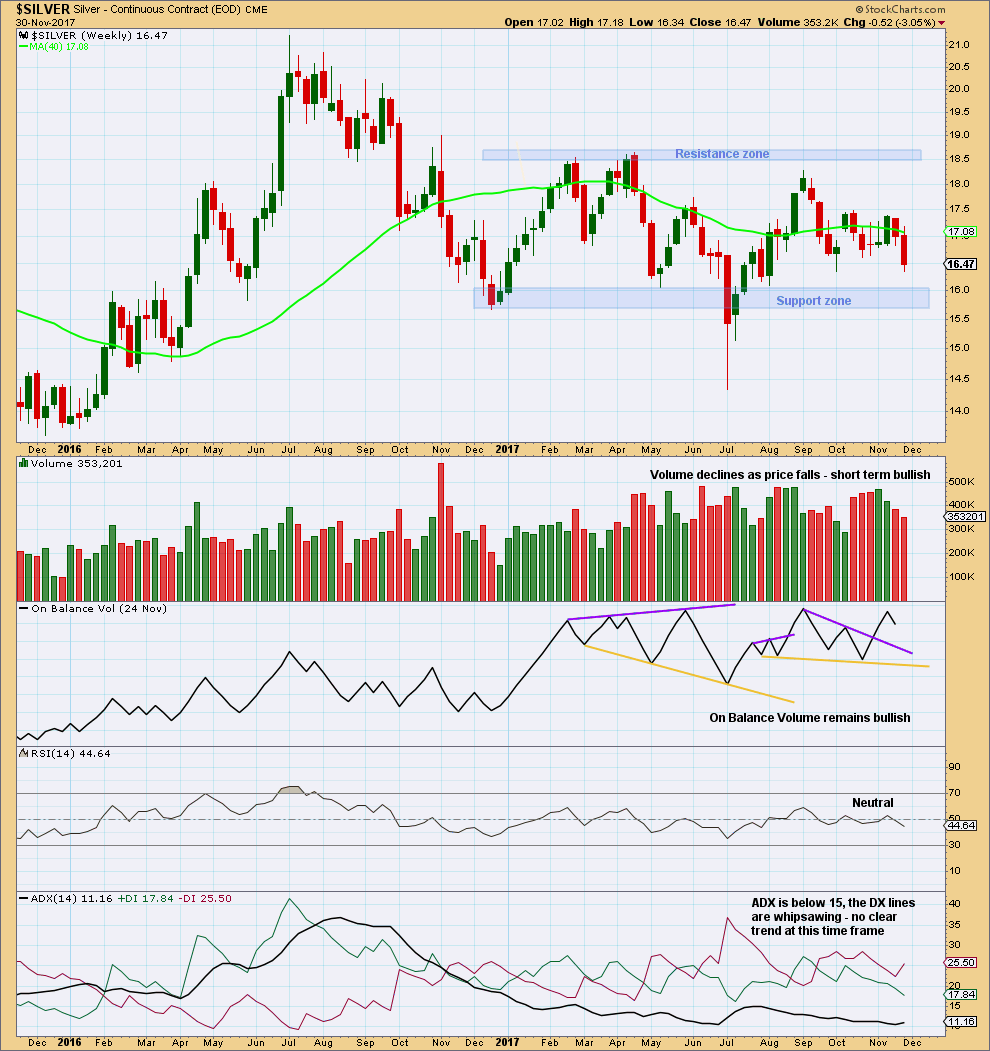
Click chart to enlarge. Chart courtesy of StockCharts.com.
There is very strong support below at 16.0 to 15.7.
DAILY CHART
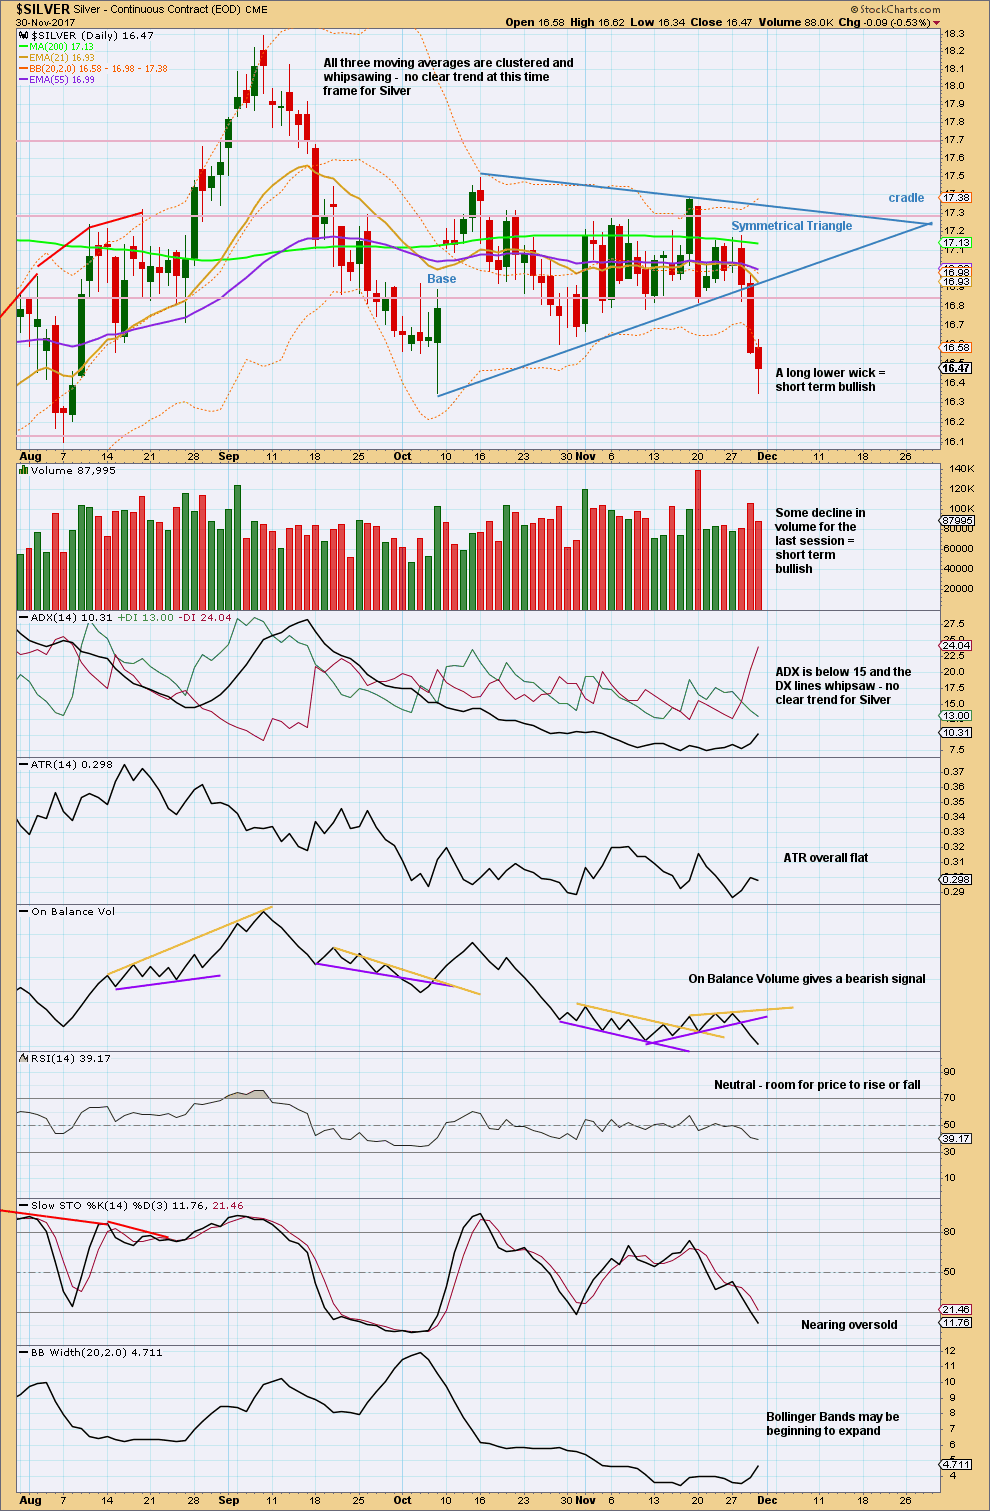
Click chart to enlarge. Chart courtesy of StockCharts.com.
A target using the width of the triangle deducted from the breakout point is 15.74. The downwards breakout had some support from volume.
The bearish signal from On Balance Volume adds confidence to the Elliott wave analysis.
Published @ 01:46 a.m. EST.