
Last analysis expected more downwards movement from Silver for the week, and this is exactly what has happened.
The classic analysis target has been met and exceeded. Price is continuing lower towards the Elliott wave target.
Summary: The target is at 15.262. This may be reached in five more sessions.
Use the yellow trend line on the technical analysis chart. If price closes clearly above it, then exit short positions.
Always trade with stops and invest only 1-5% of equity on any one trade.
New updates to this analysis are in bold.
Last monthly chart is here.
ELLIOTT WAVE COUNTS
FIRST WAVE COUNT
WEEKLY CHART
Click chart to enlarge.
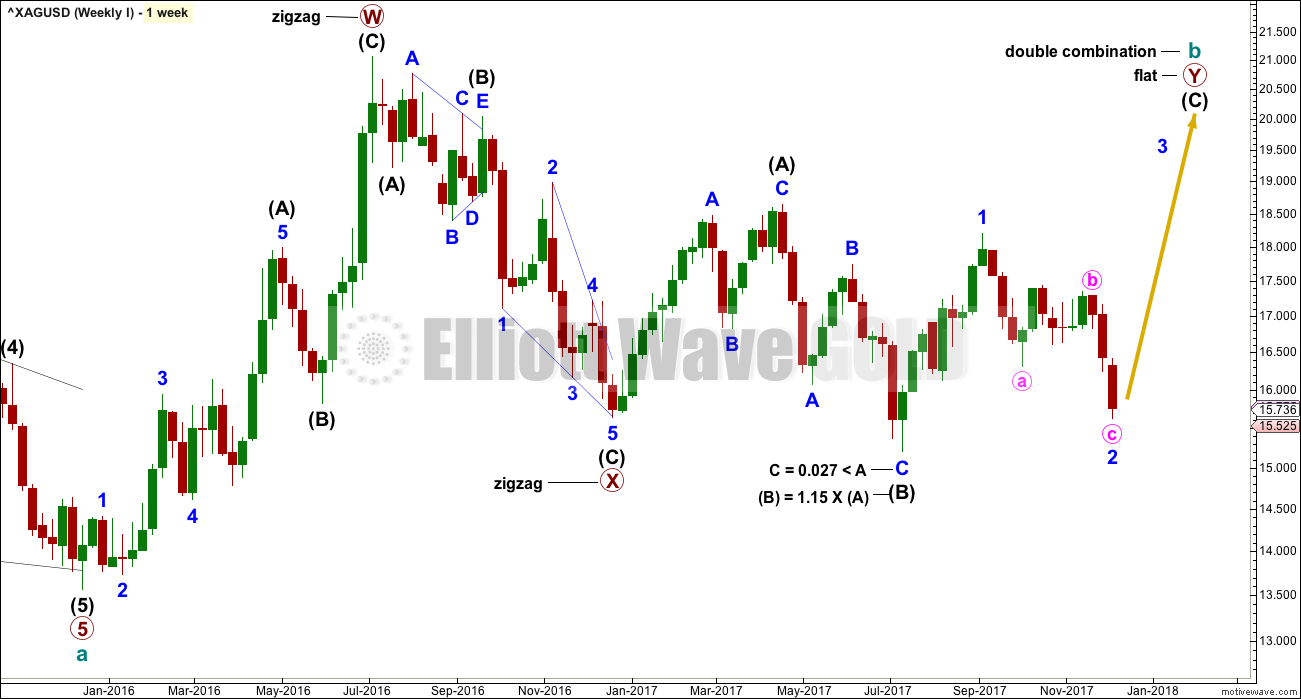
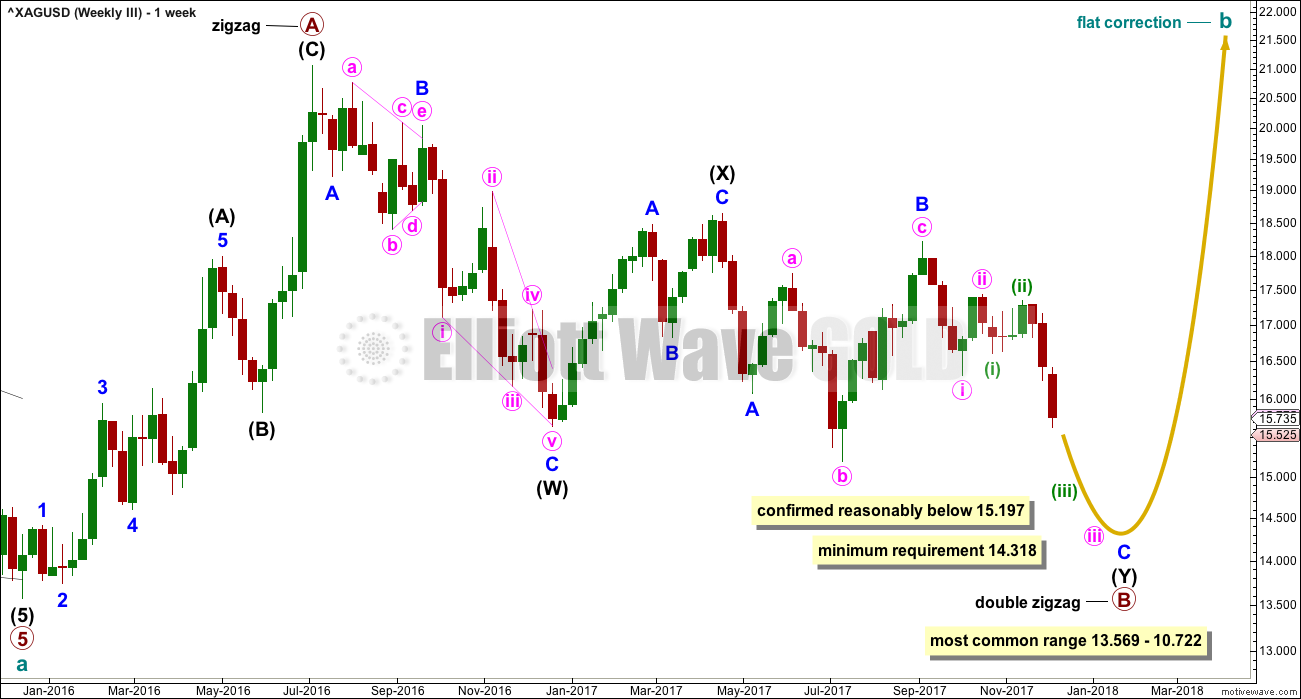
Cycle wave b may be completing as a double combination: zigzag – X – flat. The second structure, a flat correction for primary wave Y, may be underway.
Within a flat correction, intermediate wave (B) must retrace a minimum 0.9 length of intermediate wave (A) at 15.938. Intermediate wave (B) has met this minimum requirement; the rule for a flat correction is met. Intermediate wave (B) is longer than 1.05 times the length of intermediate wave (A) indicating this may be an expanded flat. Expanded flat corrections are the most common type. Normally their C waves are 1.618 or 2.618 the length of their A waves.
The target calculated would see primary wave Y to end close to same level as primary wave W about 21.062. The purpose of combinations is to take up time and move price sideways. To achieve this purpose the second structure in the double normally ends about the same level as the first.
While the combination wave count at the weekly chart level does not currently work for Gold, it does still work for Silver. They do not have to complete the same structures for cycle wave b, and fairly often their structures are different.
At this stage, the duration of minor wave 2 now looks wrong. This first wave count is now less likely. The second wave count below has a much better look.
DAILY CHART
Click chart to enlarge.
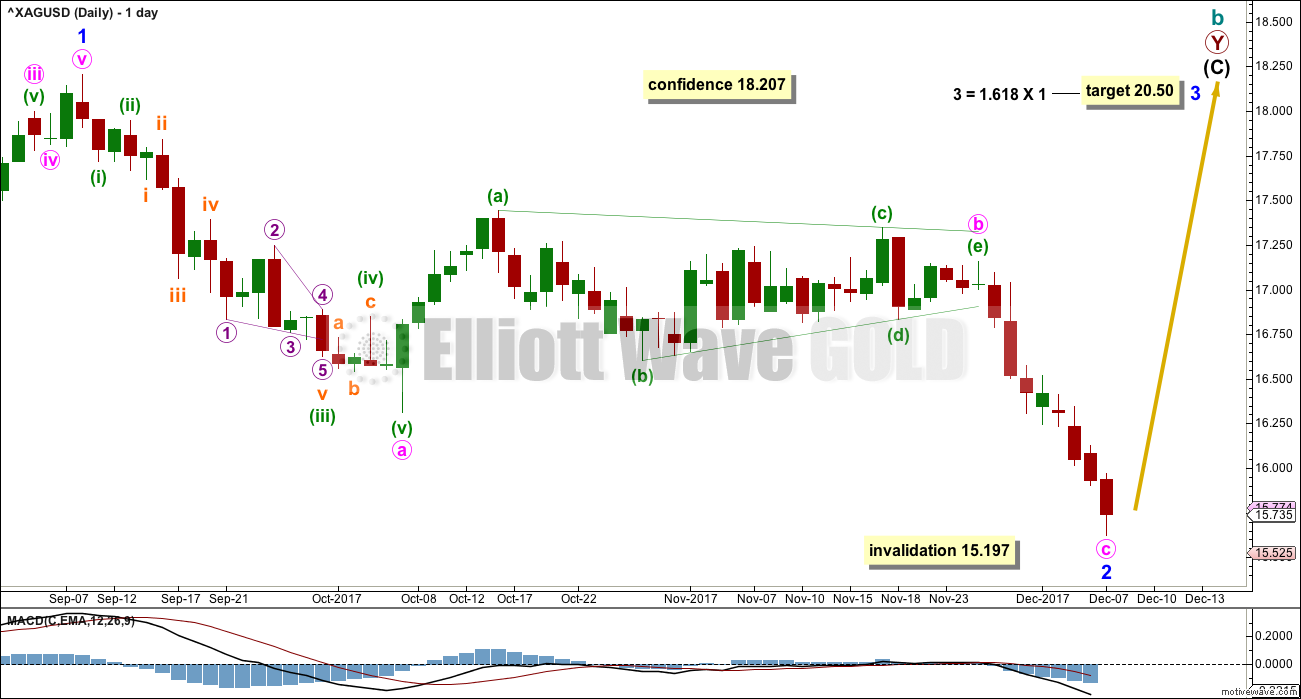
For this first wave count, upwards movement for intermediate wave (C) must subdivide as a five wave structure. It may be unfolding as an impulse.
If minor wave 2 continues lower, it may not move beyond the start of minor wave 1 below 15.197.
The target for minor wave 3 is recalculated; it assumes the most common Fibonacci ratio to minor wave 1. If minor wave 2 continues lower, then the target must again be recalculated. The target for intermediate wave (C) is removed and will be calculated again when minor wave 2 ends.
SECOND WAVE COUNT
WEEKLY CHART
Click chart to enlarge.
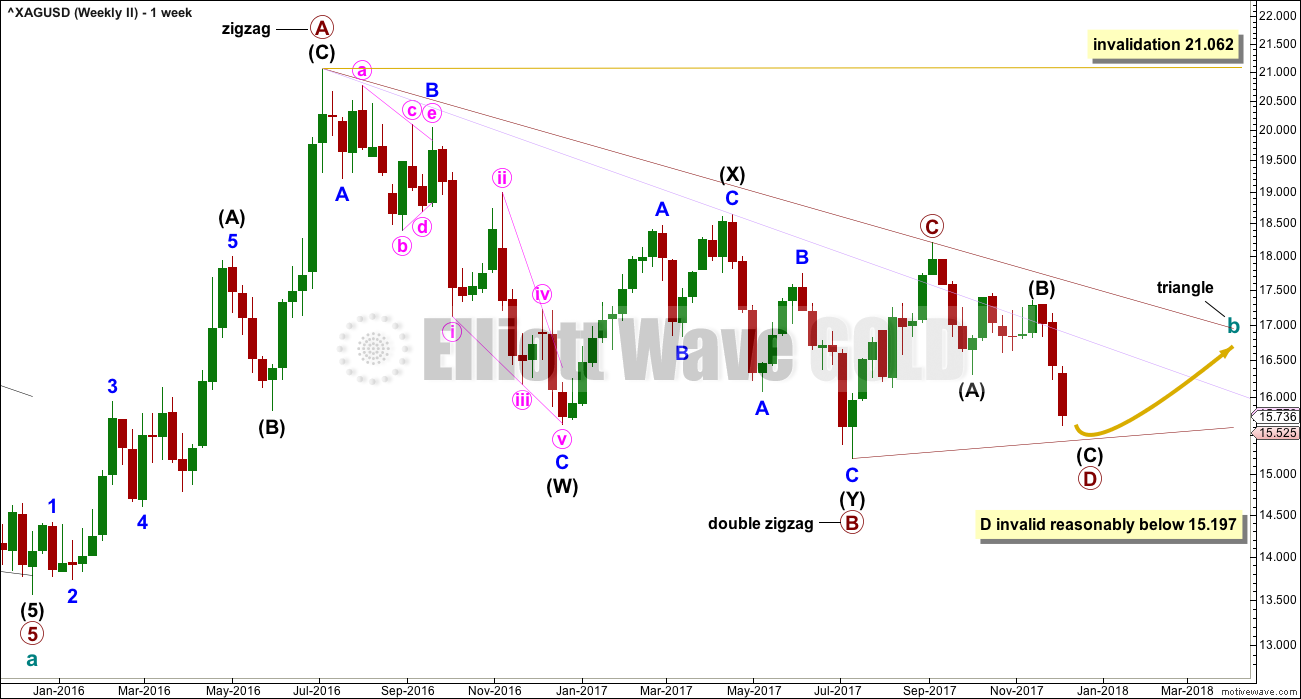
It remains possible for Silver that a large regular contracting or regular barrier triangle may be completing.
Within a triangle, one of the sub-waves must be a more complicated multiple, usually a multiple zigzag. This may be complete for primary wave B.
Primary wave C upwards may now be complete. The upper A-C trend line does have a fairly steep slope though, so it must be accepted that primary wave C may not be over and may continue higher. If it does, it may not move beyond the end of primary wave A above 21.062.
Primary wave C must subdivide as a three wave zigzag.
This triangle wave count now expects that primary wave D downwards may now be underway.
Primary wave D of a contracting triangle may not move beyond the end of primary wave B below 15.197.
Primary wave D of a barrier triangle may end about the same level as primary wave B at 15.197; as long as the B-D trend line is essentially flat, the triangle will remain valid. Unfortunately, there is some subjectivity in this rule; it is not black and white. For Silver, because the A-C trend line has a good slope, a barrier triangle here would still have the right look.
DAILY CHART
Click chart to enlarge.
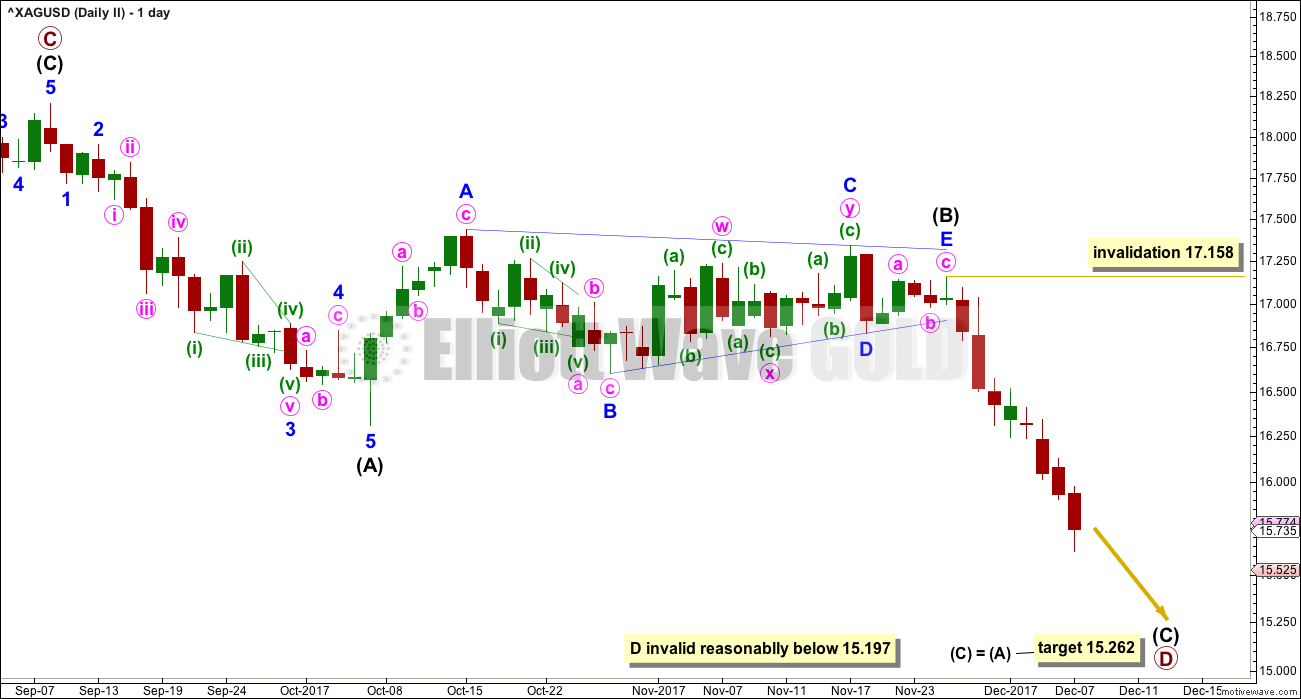
Primary wave D must subdivide as a zigzag. Within the zigzag, intermediate wave (B) may be a complete regular contracting triangle.
Within the triangle for intermediate wave (B), minor wave C sub-divides as a more complicated multiple, which is the most common sub-wave of a triangle to do so. Minor wave E has fallen reasonably short of the A-C trend line; this looks typical.
The target expects to see the most common Fibonacci ratio between intermediate waves (A) and (C).
THIRD WAVE COUNT
WEEKLY CHART
Click chart to enlarge.
This wave count is new this week.
It is still possible that cycle wave b may be unfolding as a flat correction. Within a flat, both primary waves A and B must be three wave structures. A double zigzag is classified as a three.
Within the flat correction, primary wave B must retrace a minimum 0.9 length of primary wave A. Primary wave B may make a new price extreme beyond the start of primary wave A below 13.569, as in an expanded flat. Expanded flats are the most common type of flat correction.
If the first two wave counts are invalidated by a new low reasonably below 15.197, then only this third wave count would remain. It would then require more downwards movement overall to at least 14.318, and it would be likely that price could make a new low below 13.569.
TECHNICAL ANALYSIS
WEEKLY CHART
Click chart to enlarge. Chart courtesy of StockCharts.com.
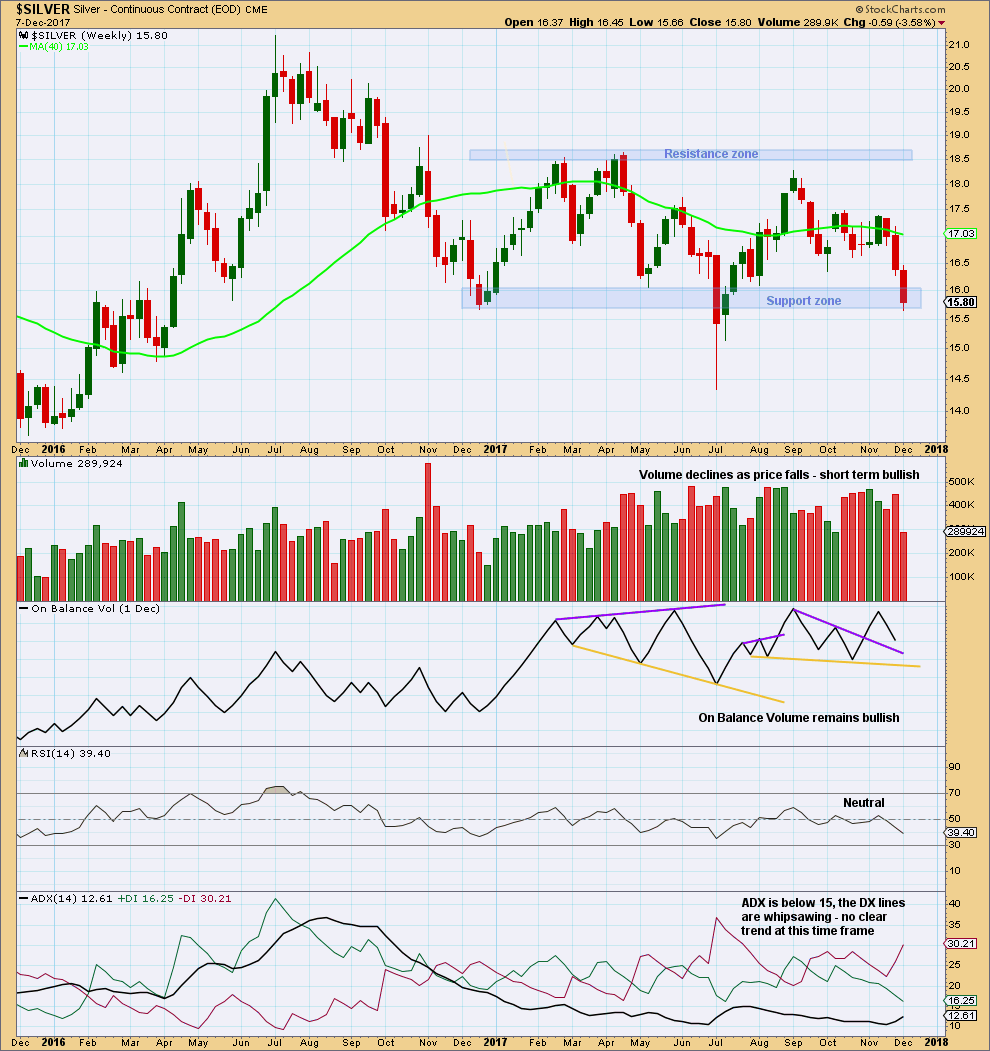
Price is back down at a zone of strong support. However, this zone was breached in July and then price returned back above it. The significance of support here has been weakened.
The last completed week saw volume support downwards movement. Unless Friday’s session this week is particularly strong, it looks like this week volume may not support the fall in price.
DAILY CHART
Click chart to enlarge. Chart courtesy of StockCharts.com.
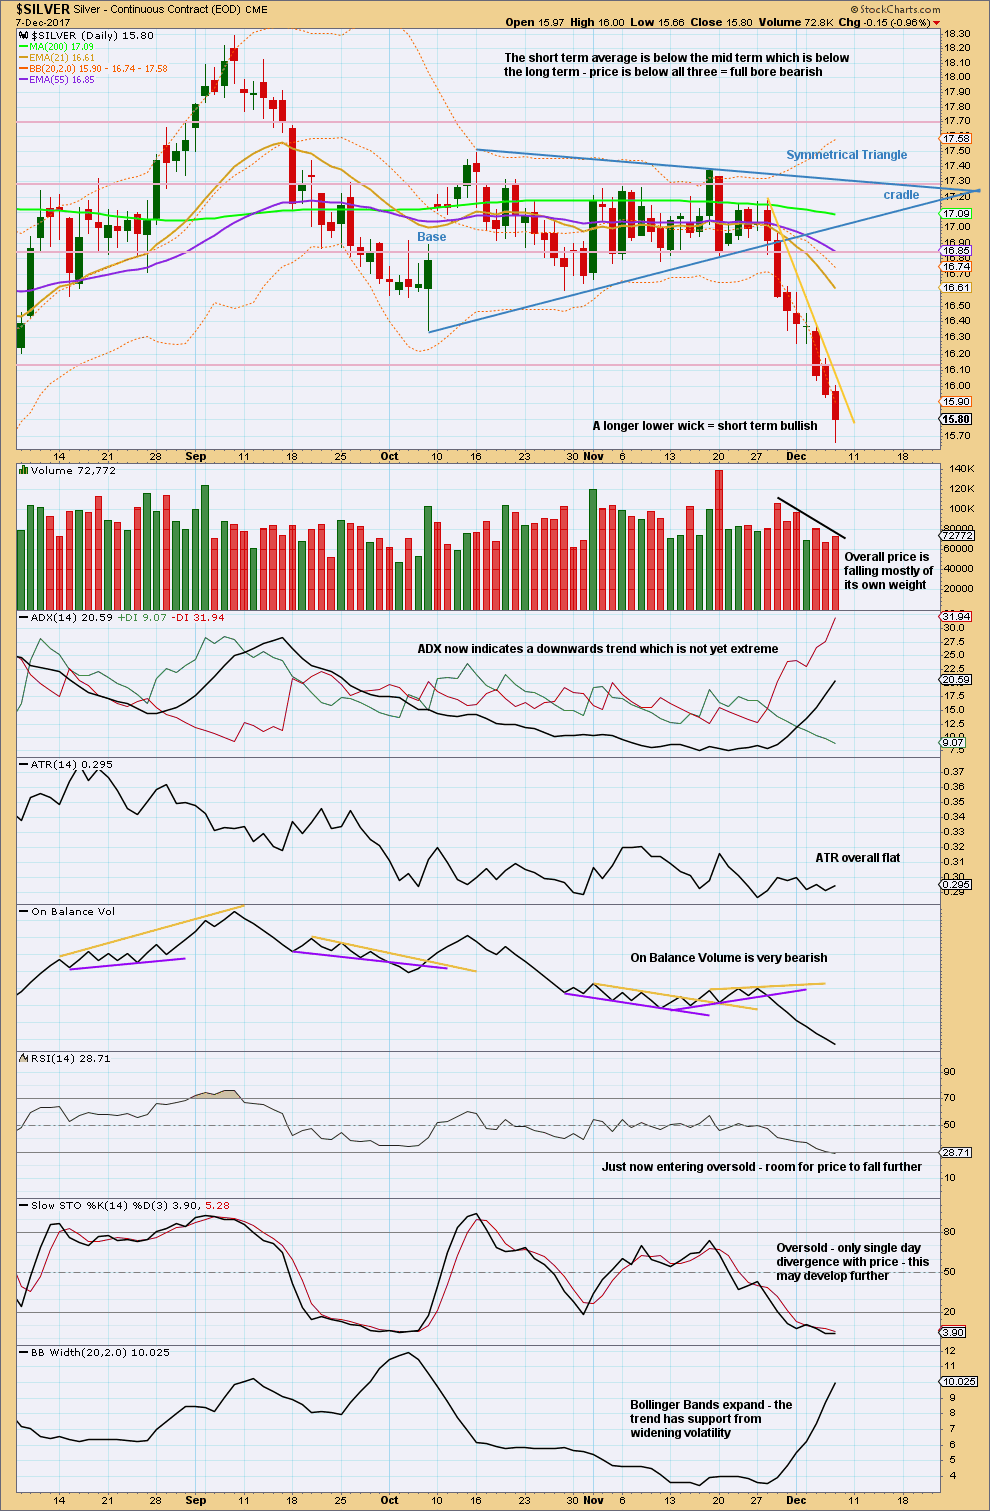
Silver had a very strong fall in price in April of this year. Price closed below the lower edge of Bollinger Bands for nine days in a row. Volume fluctuated and mostly the market fell of its own weight. At the low on the 9th of May, RSI was deeply oversold and Stochastics had been oversold and did not exhibit strong divergence with price (it was flat). ADX only just reached extreme at the end of the fall.
This could happen again. I draw members attention to it because it illustrates how extreme trends in Silver can be.
At this time, price has closed below Bollinger Bands for seven days in a row. This could continue further.
The market is again falling of its own weight; volume does not support the fall in price. This could continue further.
ADX is not extreme. This trend could continue further.
RSI is only just now dipping into oversold. Stochastics is oversold and does not yet exhibit reasonable divergence with price. There is a little room for price to fall further.
While this trend looks stretched, it does not look to be complete yet.
There is support here about 15.80. Look for next support at: 15.68, 14.70, 14.34 and a cluster about 14.00 to 13.60. At each area of support, look to see if RSI is oversold and exhibits divergence and / or Stochastics is deeply oversold and has exhibited divergence that is more than just one day. If these conditions are met, then a low may be in place.
When Silver trends strongly like this, another method is to use a trend line. A line is provided this week in yellow. If price breaks clearly above that line, then short positions should be closed for a profit.
Published @ 09:52 p.m. EST.