
Price has continued higher towards the new target, which has not been met yet.
Summary: The target for upwards movement to end is now at 67.86. If this target is wrong, it may now be too high.
New updates to this analysis are in bold.
MONTHLY ELLIOTT WAVE COUNT
Click chart to enlarge.
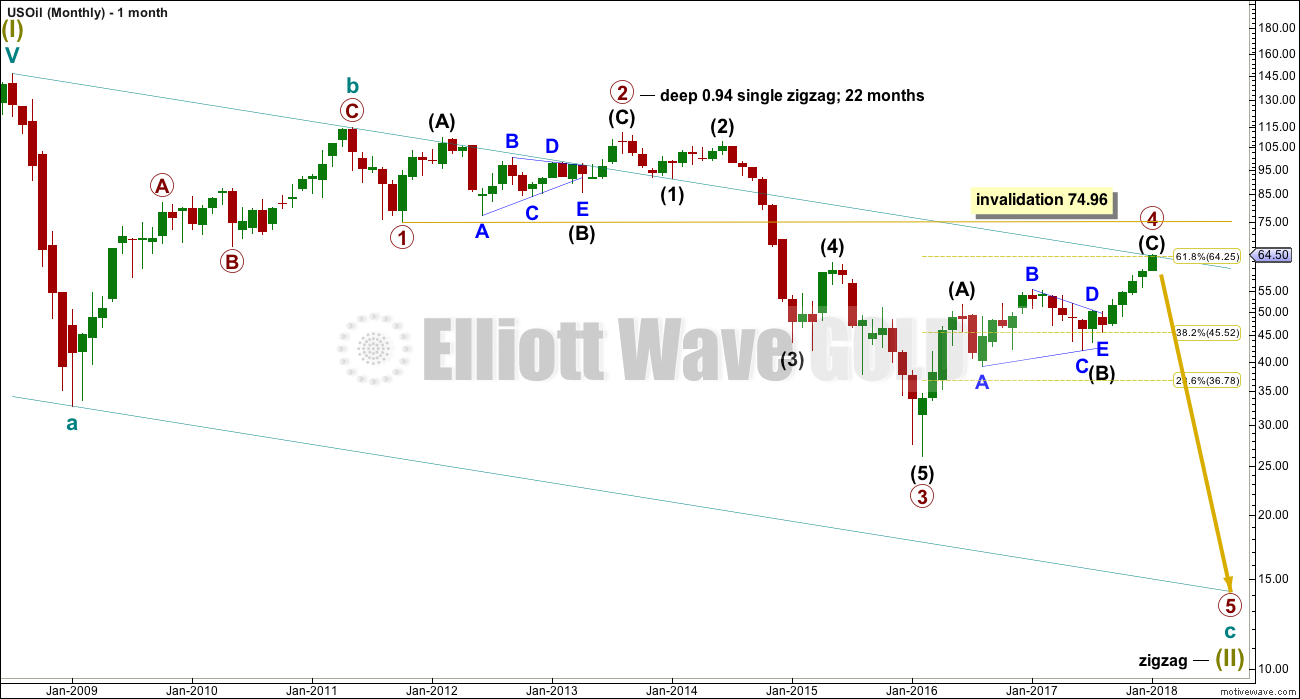
Within the bear market, cycle wave b is seen as ending in May 2011. Thereafter, a five wave structure downwards for cycle wave c begins.
Primary wave 1 is a short impulse lasting five months. Primary wave 2 is a very deep 0.94 zigzag lasting 22 months. Primary wave 3 is a complete impulse with no Fibonacci ratio to primary wave 1. It lasted 30 months.
There is alternation in depth with primary wave 2 very deep and primary wave 4 relatively shallow. There is inadequate alternation in structure, both are zigzags. So far primary wave 4 has lasted 23 months. At this stage, there is almost perfect proportion between primary waves 2 and 4.
Primary wave 4 may not move into primary wave 1 price territory above 74.96.
WEEKLY ELLIOTT WAVE COUNT
Click chart to enlarge.
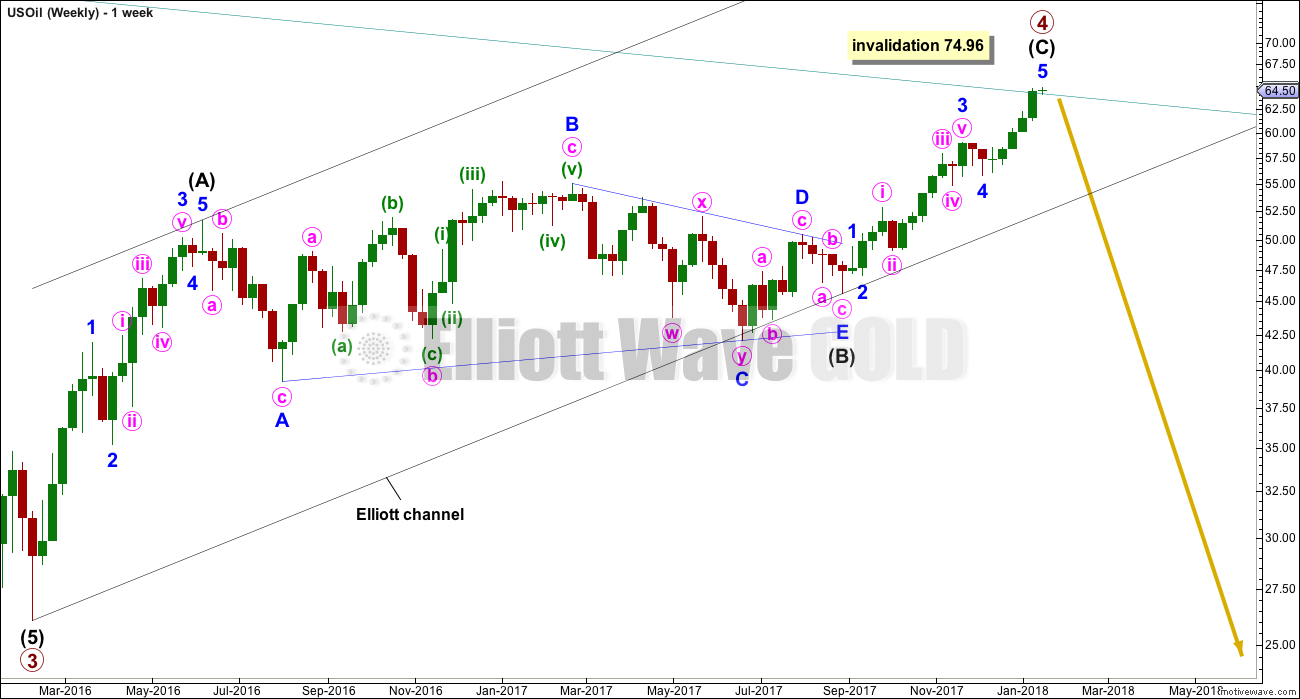
Intermediate wave (C) must subdivide as a five wave structure, either an impulse or an ending diagonal. Within intermediate wave (C), minor waves 1 through to 3 may now be complete. Minor wave 4 may or may not be complete. It may not move into minor wave 1 price territory below 49.82.
When intermediate wave (C) may again be seen as complete, then a trend change would be expected and a target for primary wave 5 downwards would be calculated. At this stage, for this wave count, a target cannot be calculated for it to end because the start of primary wave 5 is not known.
An Elliott channel is added to this possible zigzag for primary wave 4. A breach of the lower edge of this channel would provide a very strong indication that primary wave 4 should be over and primary wave 5 should be underway.
DAILY ELLIOTT WAVE COUNT
Click chart to enlarge.
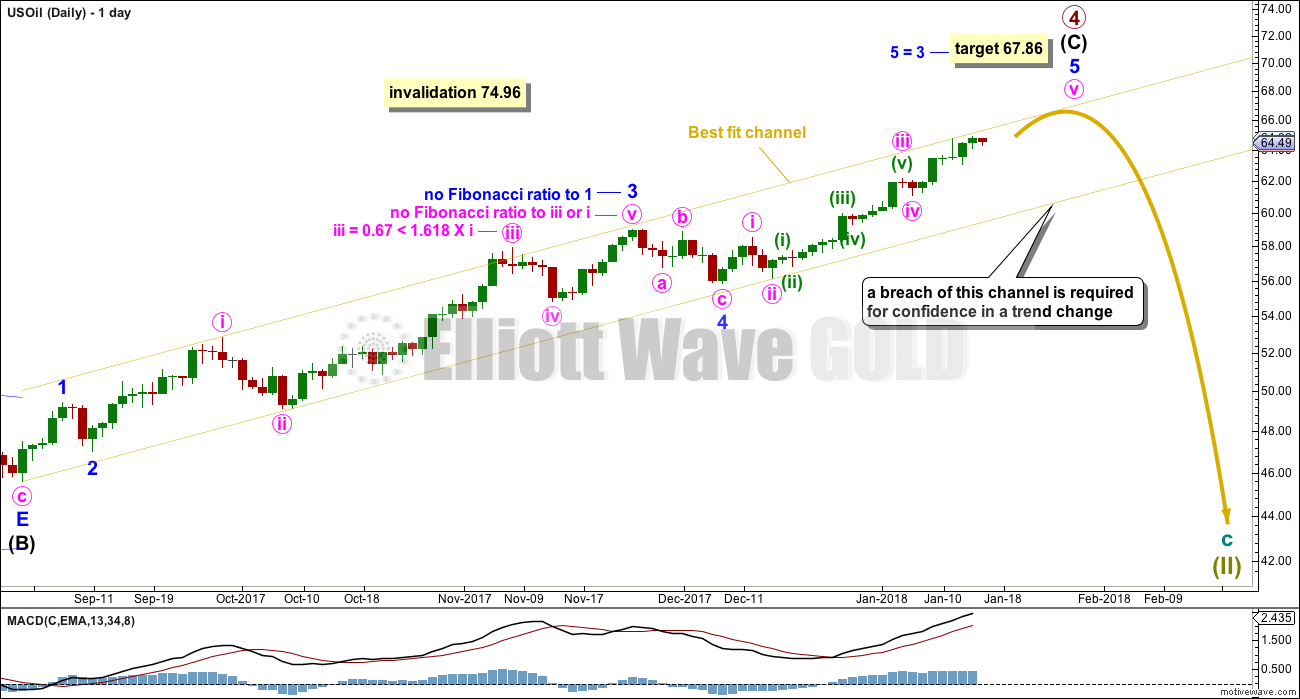
Intermediate wave (C) must complete as a five wave structure. For this wave count, it looks like a possible impulse.
Within intermediate wave (C), minor wave 5 has passed equality in length with minor wave 1 and 1.618 the length of minor wave 1. Equality with minor wave 3 is now used to calculate a target.
Price is about the upper edge of the best fit channel. This may offer resistance. If the target is wrong, it may be too high. It is possible that price may turn here.
While price remains within the best fit channel, assume that the trend remains the same: up. Only when price has breached the channel may confidence be had in this wave count.
TECHNICAL ANALYSIS
MONTHLY CHART
Click chart to enlarge. Chart courtesy of StockCharts.com.
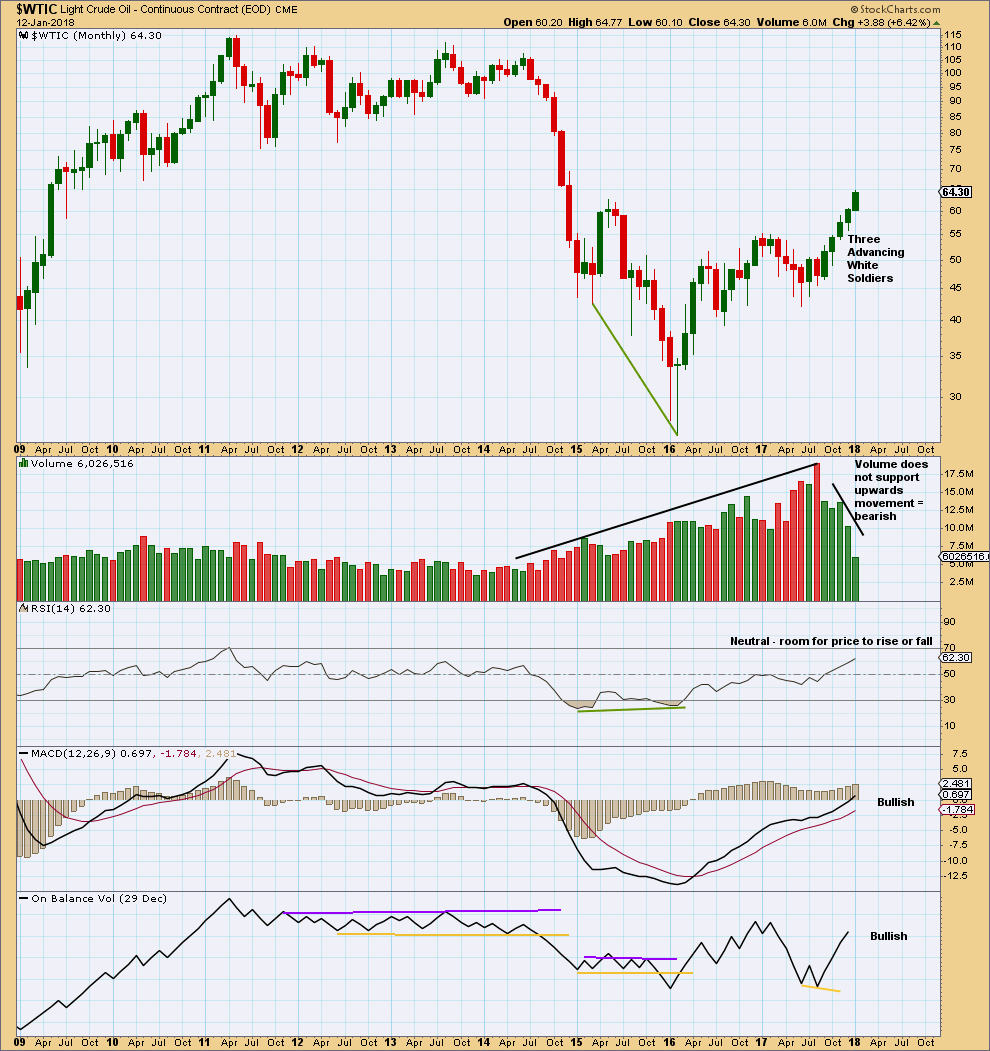
The strongest recent monthly volume is for the downwards month of August 2017. This is bearish.
Price is currently rising on declining volume at this time frame. While that could change, at this time it looks unsustainable.
RSI indicates there is room for upwards movement to continue.
DAILY CHART
Click chart to enlarge. Chart courtesy of StockCharts.com.
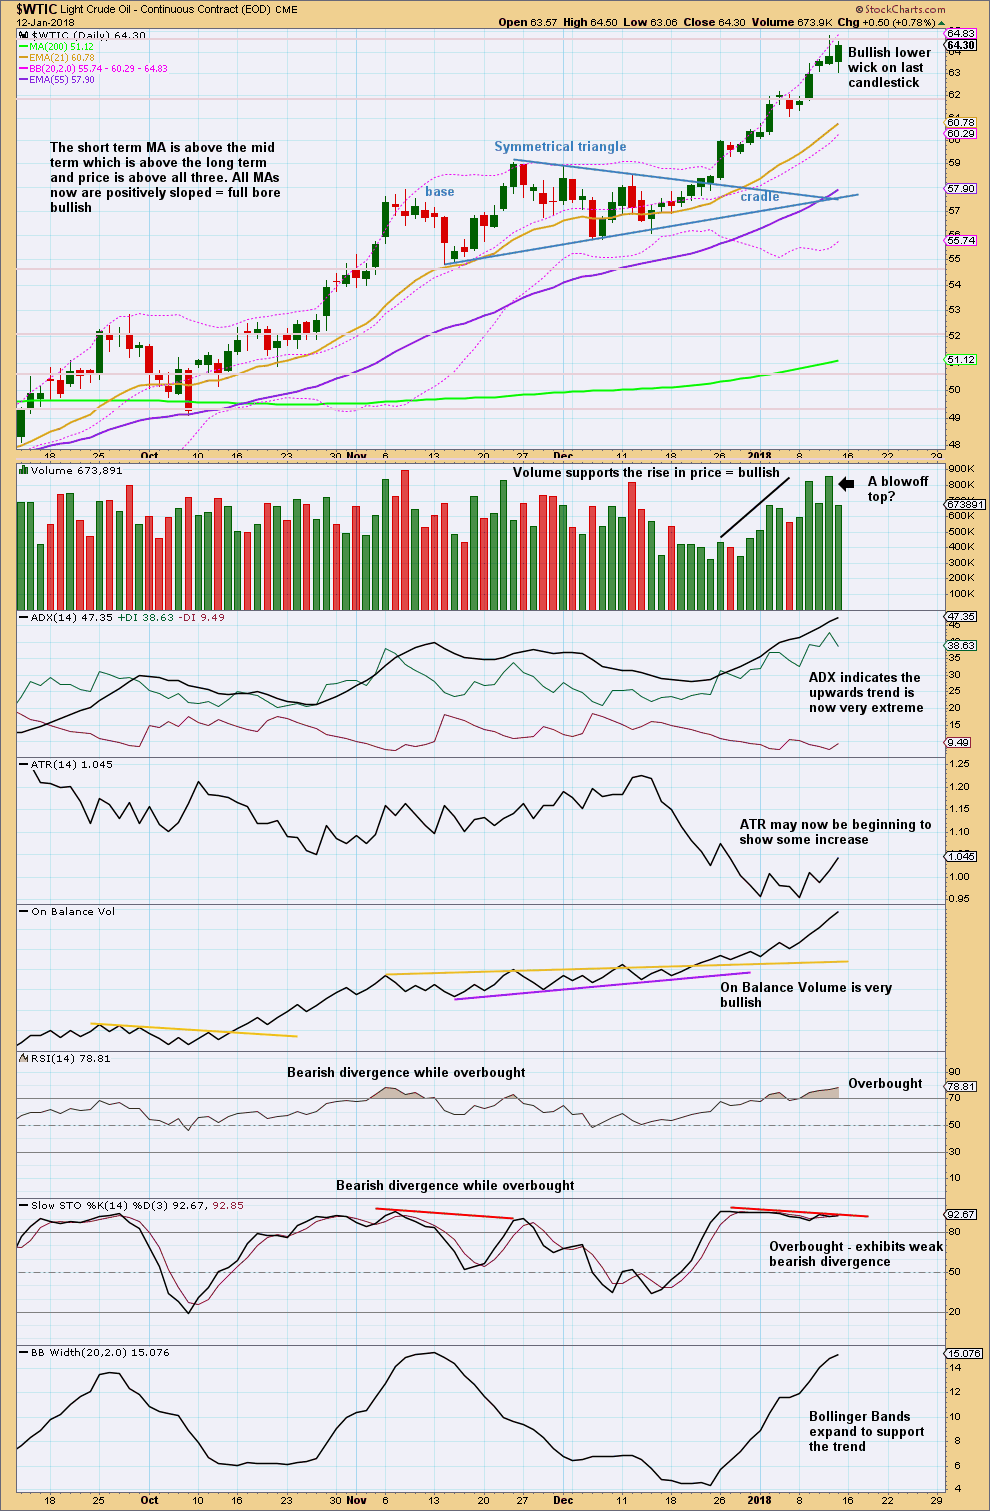
For the short term, price is now rising on increasing volume.
RSI is overbought but does not exhibit divergence with price. At this stage, there is room for price to keep rising. ATR can remain very extreme for long periods of time when Oil trends.
This chart this week does not offer support to the Elliott wave count. This chart is bullish.
VOLATILITY INDEX
Click chart to enlarge. Chart courtesy of StockCharts.com.
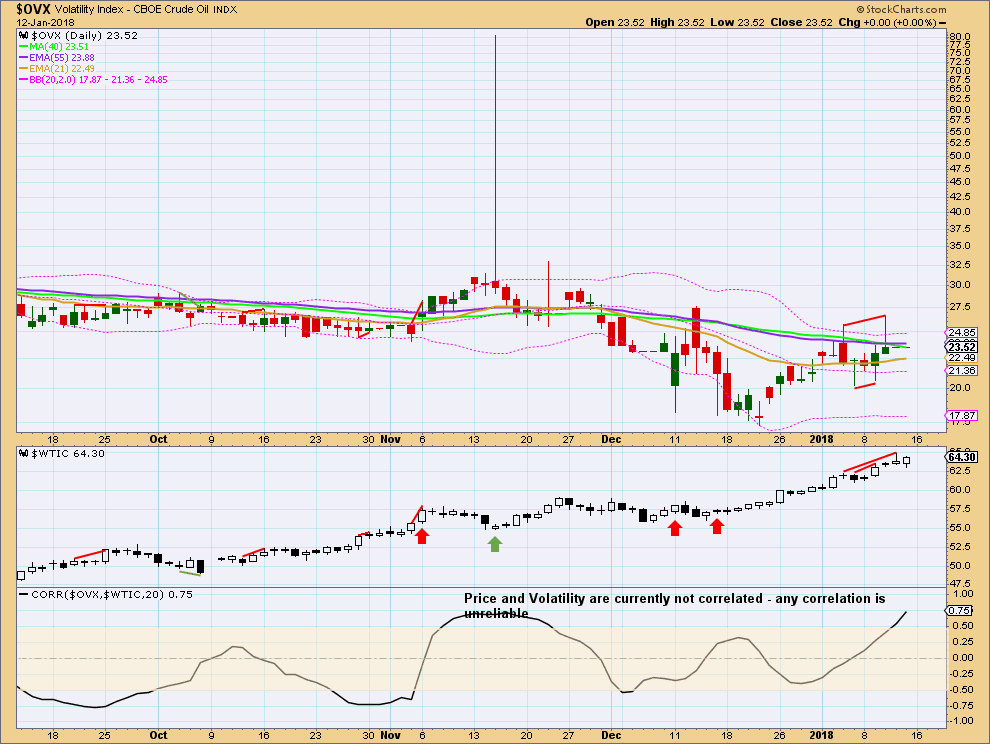
There is a second short term bearish divergence: price has made a new high, but volatility has not shown a normal corresponding decline. This again supports the idea of a high in place here or within a very few days.
Published @ 00:05 a.m. EST.