
Upwards movement has continued towards the target, which was at 67.86, and which has not yet been met.
A new alternate wave count is considered this week.
Summary: Assume the upwards trend remains intact while price remains within the yellow channel on the daily chart. Only if that channel is breached by downwards movement should a high be assumed to be in place.
A new high now above 74.96 would provide a strong indication that Oil may be in a long term bull market. The target would be at 80.64, but a large correction for a big fourth wave would be expected prior to the target being reached.
New updates to this analysis are in bold.
MAIN WAVE COUNT
MONTHLY CHART
Click chart to enlarge.
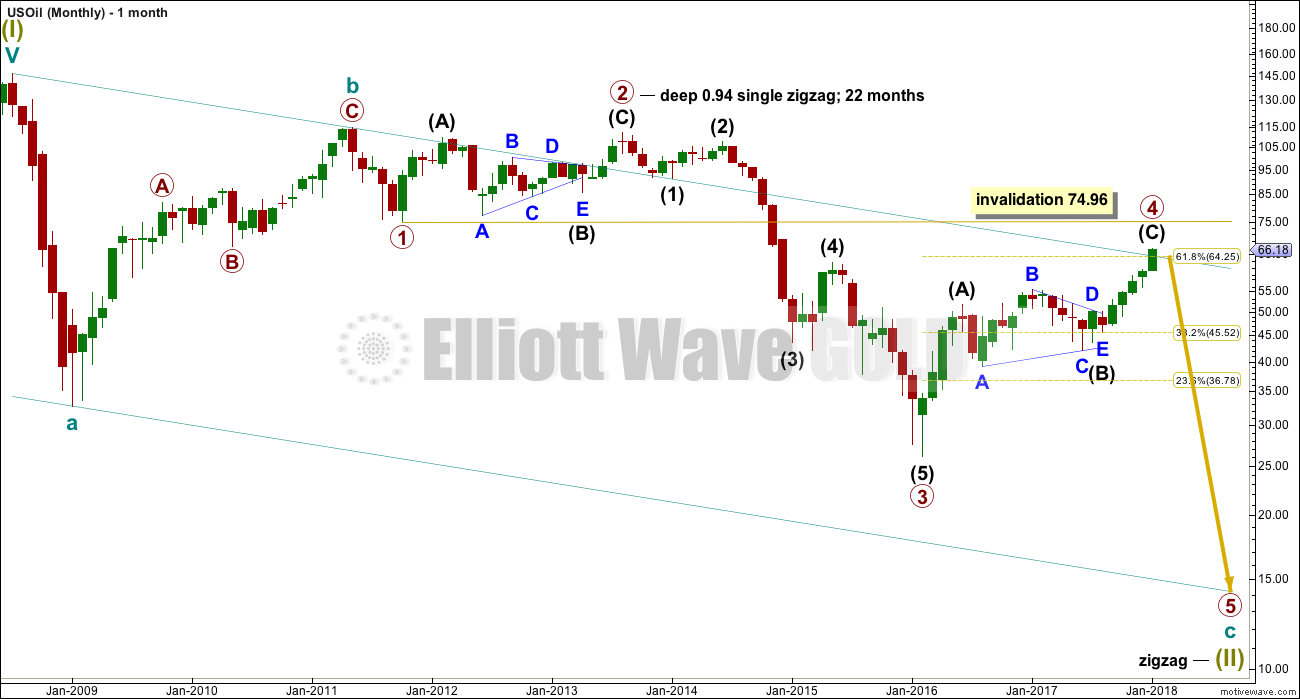
Within the bear market, cycle wave b is seen as ending in May 2011. Thereafter, a five wave structure downwards for cycle wave c begins.
Primary wave 1 is a short impulse lasting five months. Primary wave 2 is a very deep 0.94 zigzag lasting 22 months. Primary wave 3 is a complete impulse with no Fibonacci ratio to primary wave 1. It lasted 30 months.
There is alternation in depth with primary wave 2 very deep and primary wave 4 relatively shallow. There is inadequate alternation in structure, both are zigzags. So far primary wave 4 has lasted 23 months. At this stage, there is almost perfect proportion between primary waves 2 and 4.
Primary wave 4 may not move into primary wave 1 price territory above 74.96.
Price this week has closed above the teal resistance line, the upper edge of this very wide channel. This wave count expected it would be fairly likely that primary wave 4 should have found resistance there. Because this line is now breached on the daily chart a new alternate is considered below.
WEEKLY CHART
Click chart to enlarge.
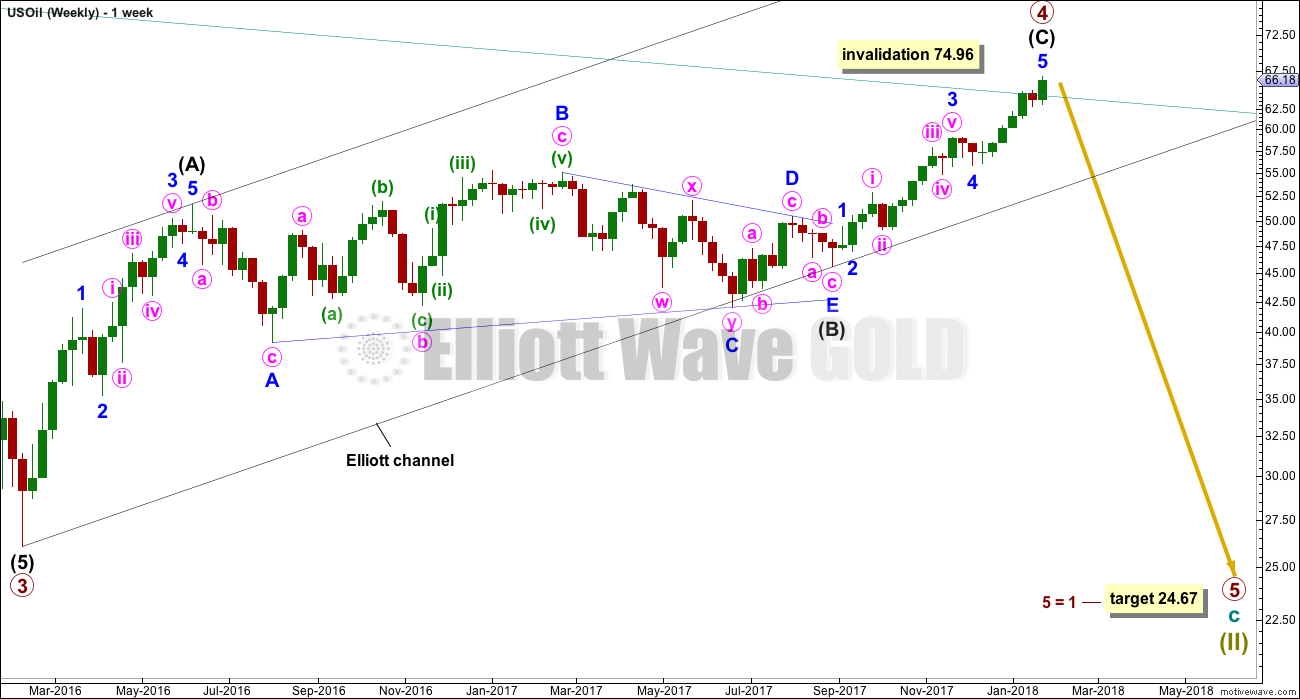
Primary wave 4 subdivides as a zigzag, and within it intermediate wave (C) may now be complete. A new target is calculated for primary wave 5 to exhibit the most common Fibonacci ratio to primary wave 1.
An Elliott channel is added to this possible zigzag for primary wave 4. A breach of the lower edge of this channel would provide a very strong indication that primary wave 4 should be over and primary wave 5 should be underway.
DAILY CHART
Click chart to enlarge.
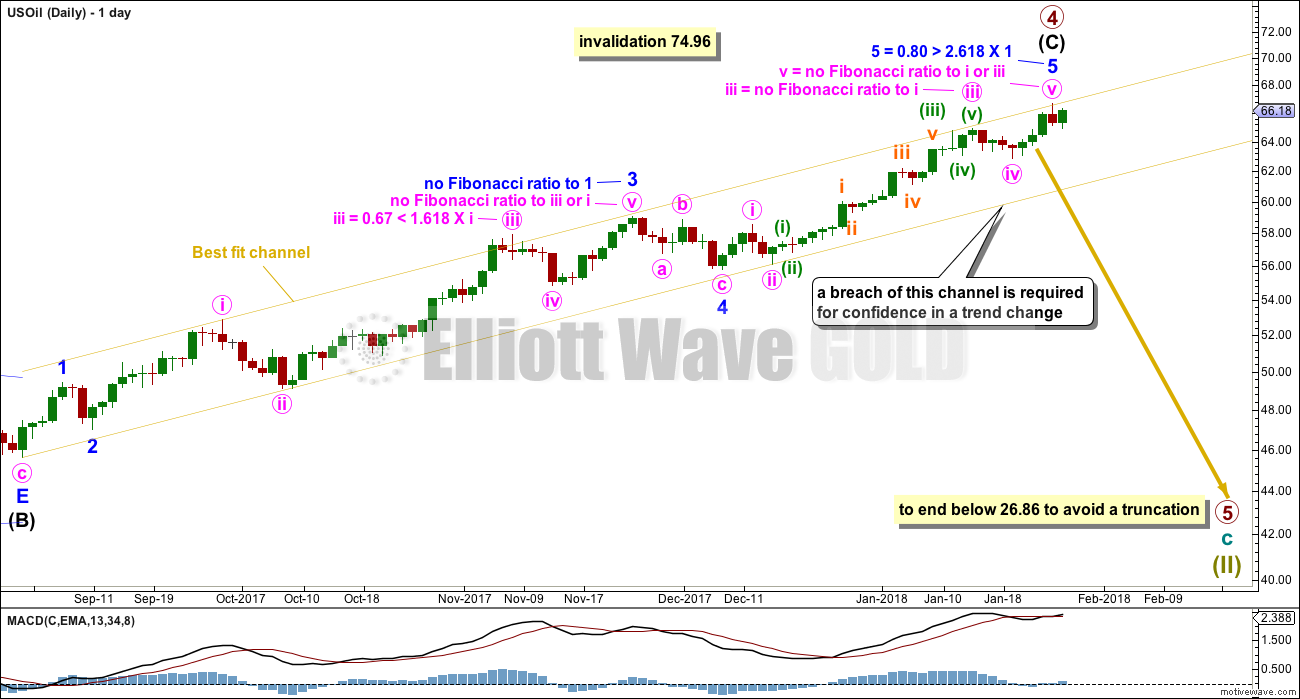
Intermediate wave (C) may now be complete at all degrees. However, the yellow best fit channel must absolutely be breached by downwards movement before any confidence that a high is in place may be had.
Assume the trend remains the same, upwards, while price remains within the channel. This wave count is at the point now where it requires channel confirmation.
If primary wave 4 continues any higher, it may not move into primary wave 1 price territory above 74.96.
ALTERNATE WAVE COUNT
MONTHLY CHART
Click chart to enlarge.
This alternate is new.
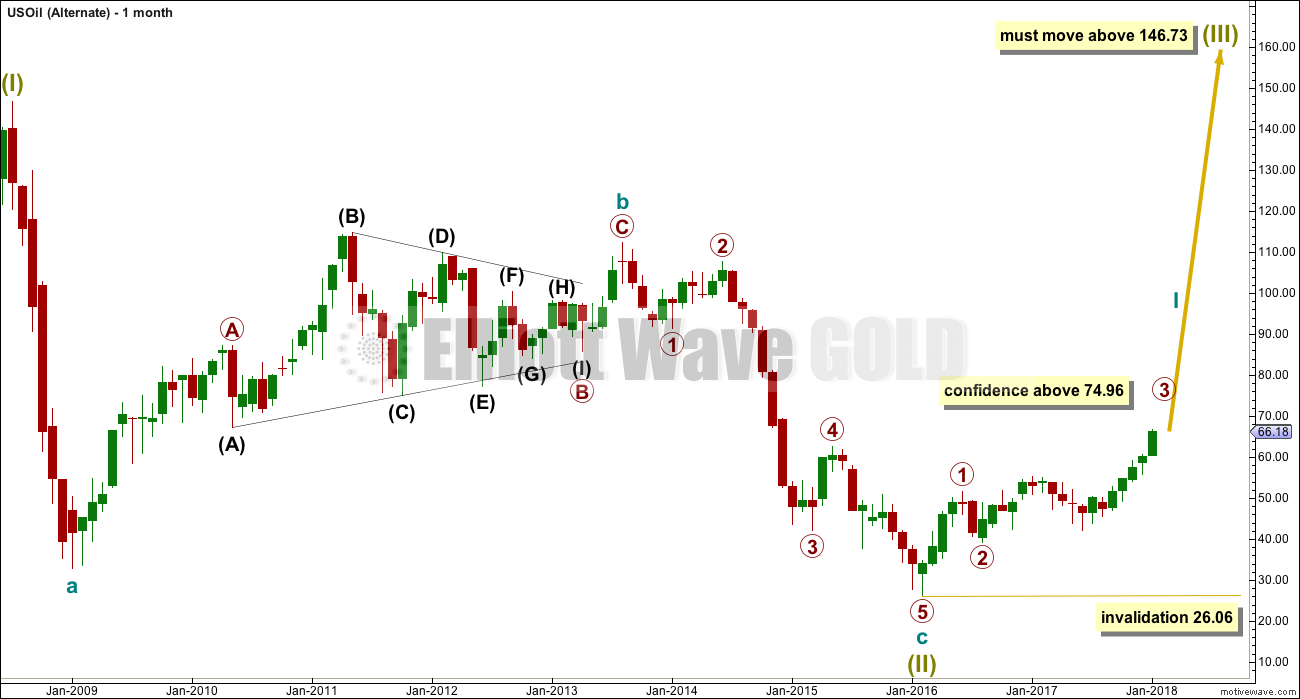
It is possible that the bear market for Oil is over and a new bull market is in the very early stages.
A huge zigzag down to the last low may be complete and is labelled here Super Cycle wave (II).
Cycle wave b must be seen as complete in August 2013 for this wave count to work. It cannot be seen as complete at the prior major swing high in May 2011.
Cycle wave b is seen as a zigzag, and within it primary wave B is seen as a running contracting triangle. These are fairly common structures.
Primary wave C moves beyond the end of primary wave A, so it avoids a truncation. But it does not have to move above the price territory of primary wave B to avoid a truncation, which is an important distinction.
If cycle wave b begins there, then cycle wave c may be seen as a complete five wave impulse.
Super Cycle wave (III) must move beyond the end of Super Cycle wave (I). It must move far enough above that point to allow room for a subsequent Super Cycle wave (IV) to unfold and remain above Super Cycle wave (I) price territory.
WEEKLY CHART
Click chart to enlarge.
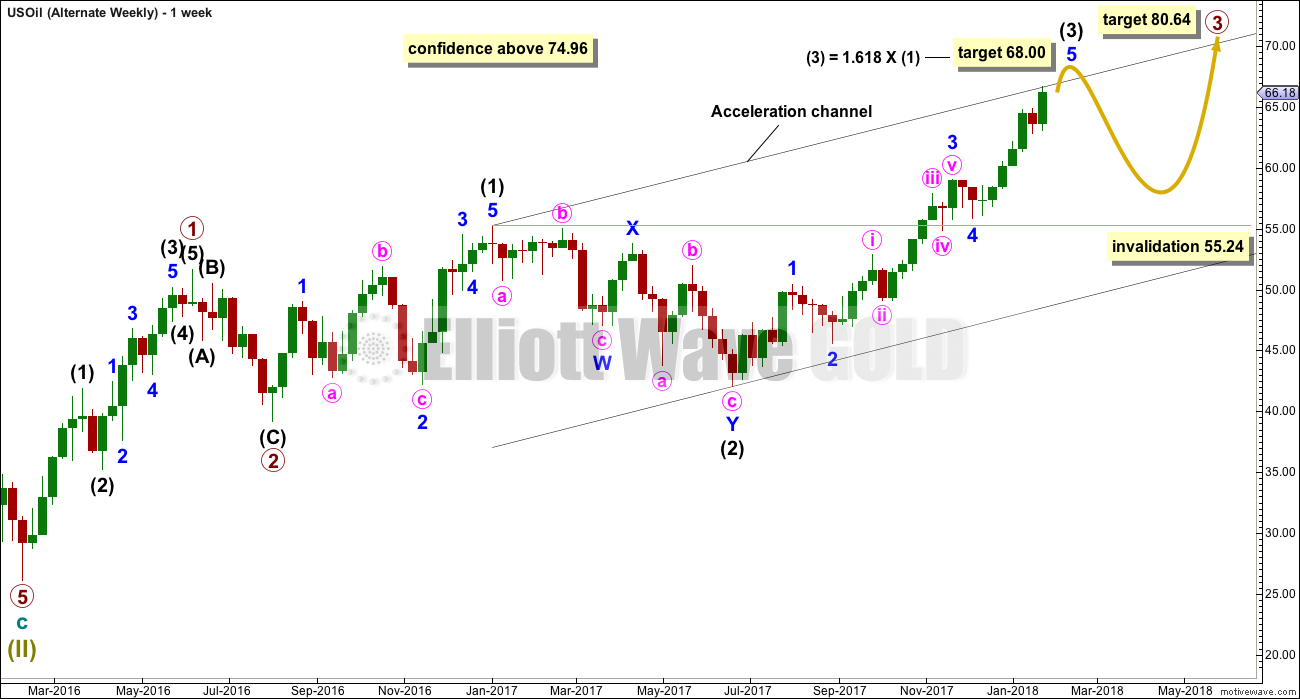
If a new bull market is in the very early stages for Oil, then it may have begun with two overlapping first and second waves at primary then at intermediate degree.
Primary wave 3 may only subdivide as an impulse, and within it intermediate wave (3) may be incomplete. The target assumes the most common Fibonacci ratio to intermediate wave (1).
Intermediate wave (4) may not move into intermediate wave (1) price territory below 55.24.
TECHNICAL ANALYSIS
MONTHLY CHART
Click chart to enlarge. Chart courtesy of StockCharts.com.
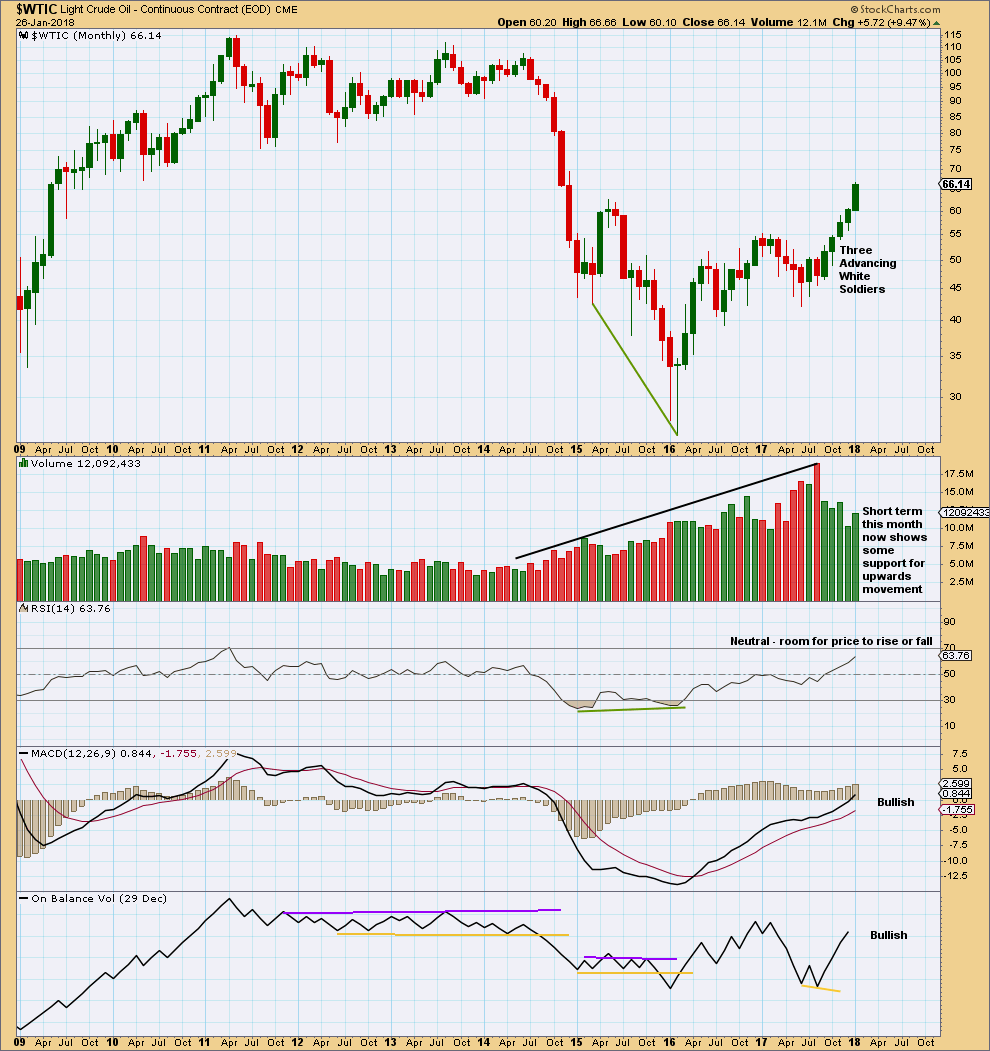
The strongest recent monthly volume is for the downwards month of August 2017. This is bearish.
Price is currently rising on declining volume at this time frame. However, the incomplete month of January is now stronger than the month prior. Volume now offers some support to rising price at least for the short term.
RSI indicates there is room for upwards movement to continue.
DAILY CHART
Click chart to enlarge. Chart courtesy of StockCharts.com.
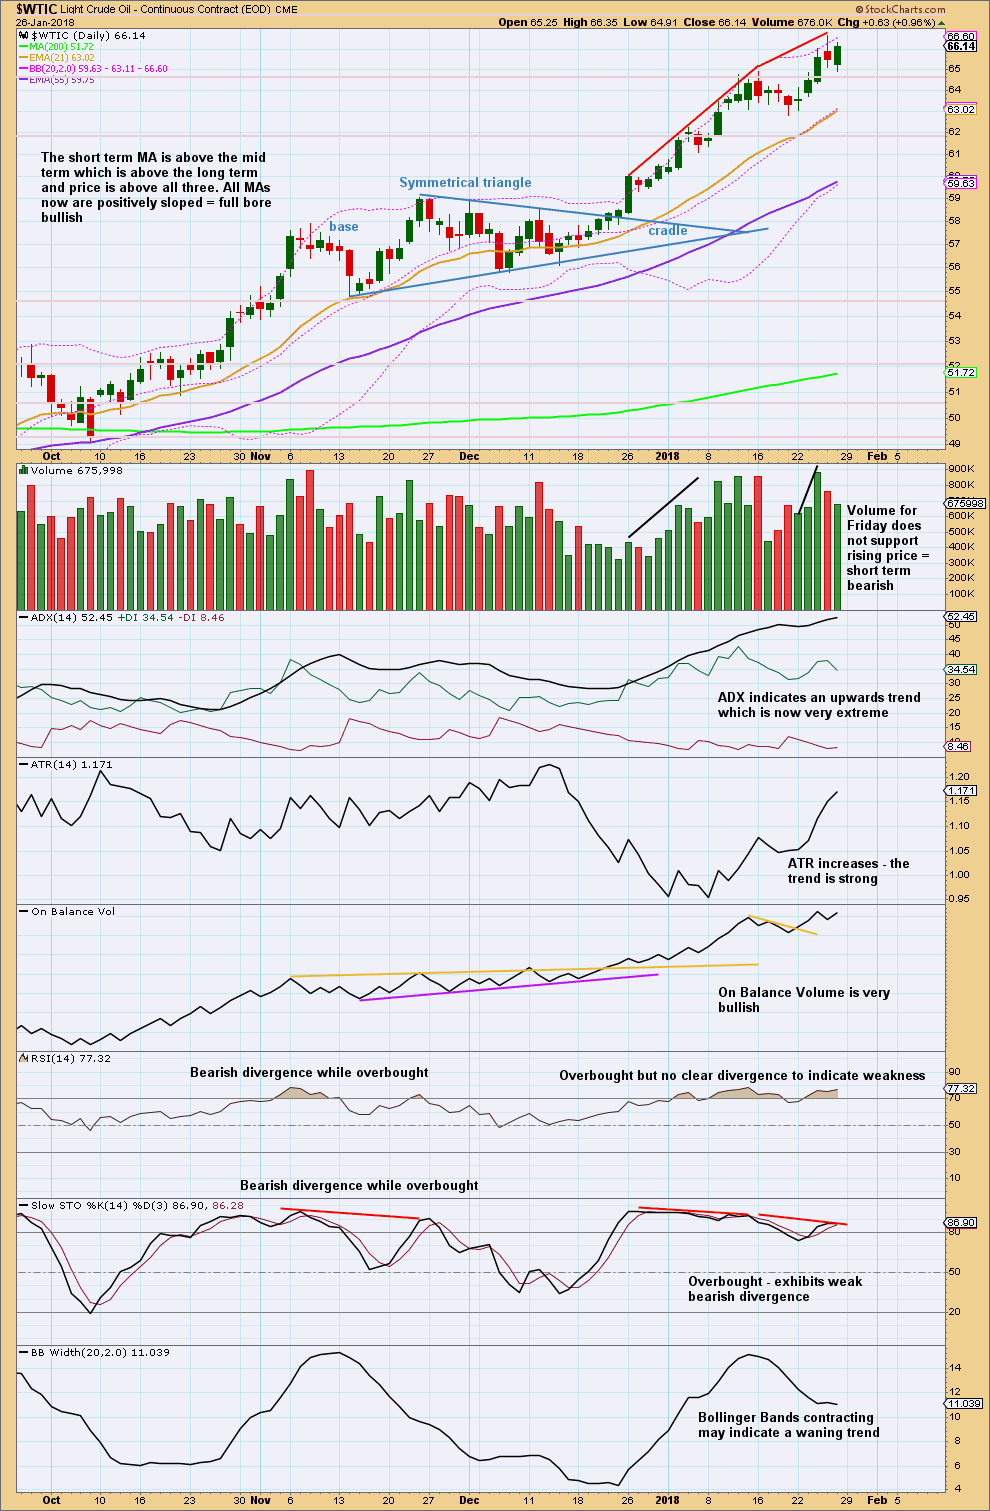
Friday’s session moved price lower with a lower low and a lower high, but the candlestick closed green and the balance of volume during the session was upwards. Volume shows a decline, and so the very short term volume profile is interpreted as bearish.
There is not enough divergence with price and RSI to indicate an end to this trend here. Bullish trends may remain extreme for reasonable periods of time, particularly for commodities. This chart remains bullish.
VOLATILITY INDEX
Click chart to enlarge. Chart courtesy of StockCharts.com.
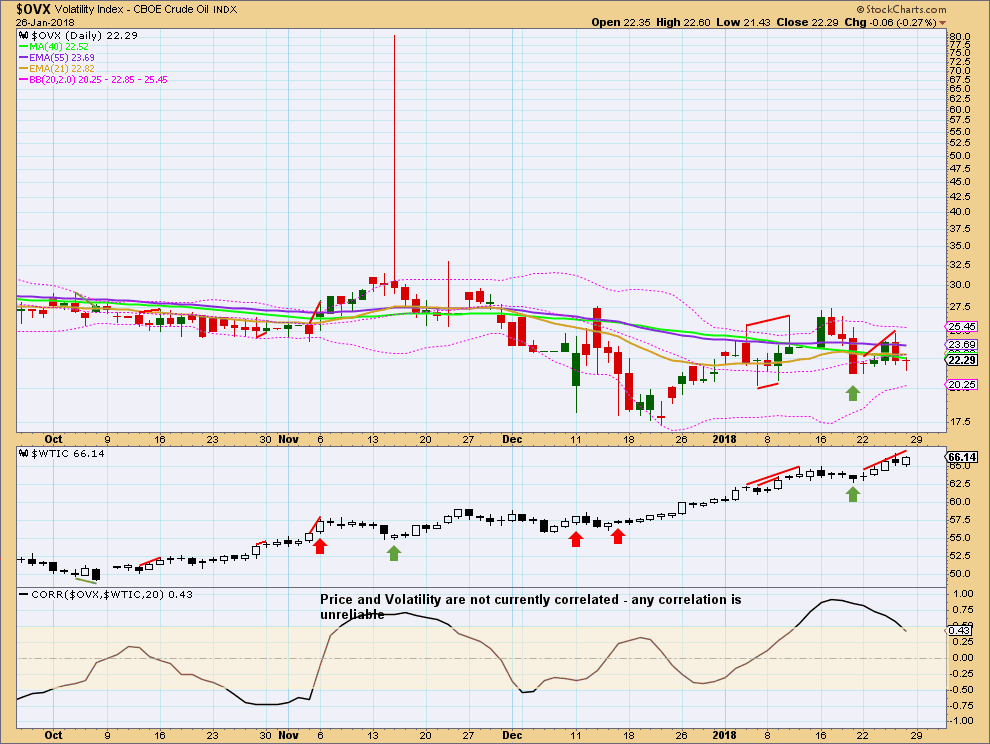
Price moved higher for three sessions in a row to the last high, but this did not come with a normal corresponding decline in volatility. Volatility has increased for those three sessions. This divergence is interpreted as bearish.
Published @ 10:25 p.m. EST on 27th January, 2018.