
Price has bounced over the last week exactly as last analysis expected it to.
Is the bounce now over?
Summary: Expect price for the short term to overall continue higher to reach about 17.100. There may be a pullback to last a few days along the way up to the target.
But if the bounce takes price above 17.680, then have confidence in an upwards breakout. The target would be at 20.395.
A new low below 16.173 now would indicate an ongoing bear market for Silver. The target would be at 3.858.
Last monthly charts can be viewed here.
New updates to this analysis are in bold.
ELLIOTT WAVE COUNTS
MAIN WAVE COUNT
WEEKLY CHART
Click chart to enlarge.
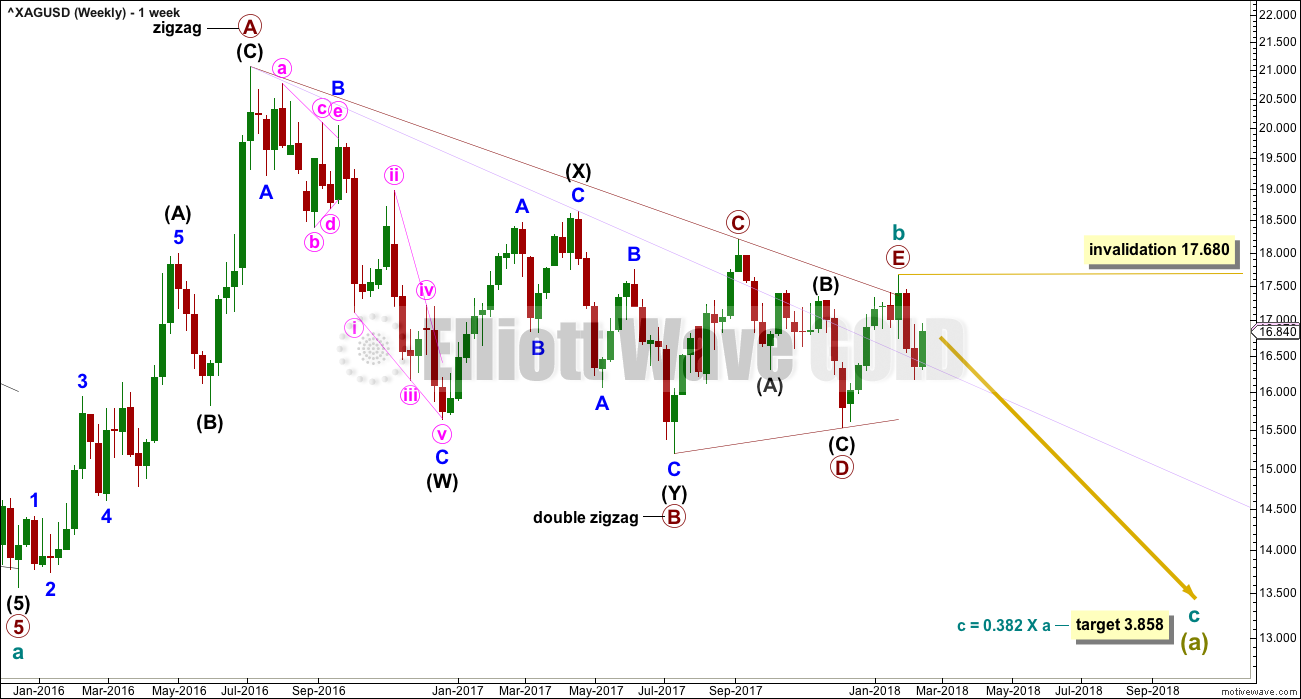
The main wave count expects that the bear market, which began from the April 2011 high, is incomplete.
Cycle wave a is seen as a five wave impulse for this main wave count. There are multiple corrective structures possible still for cycle wave b.
This first weekly chart sees cycle wave b as a now possibly complete regular contracting triangle.
Primary wave E of the triangle may have ended with an overshoot of the A-C trend line. If this wave count is correct, then price should have reversed already. Within the new downwards trend, no second wave correction may move beyond the start of the first wave above 17.680.
DAILY CHART
Click chart to enlarge.
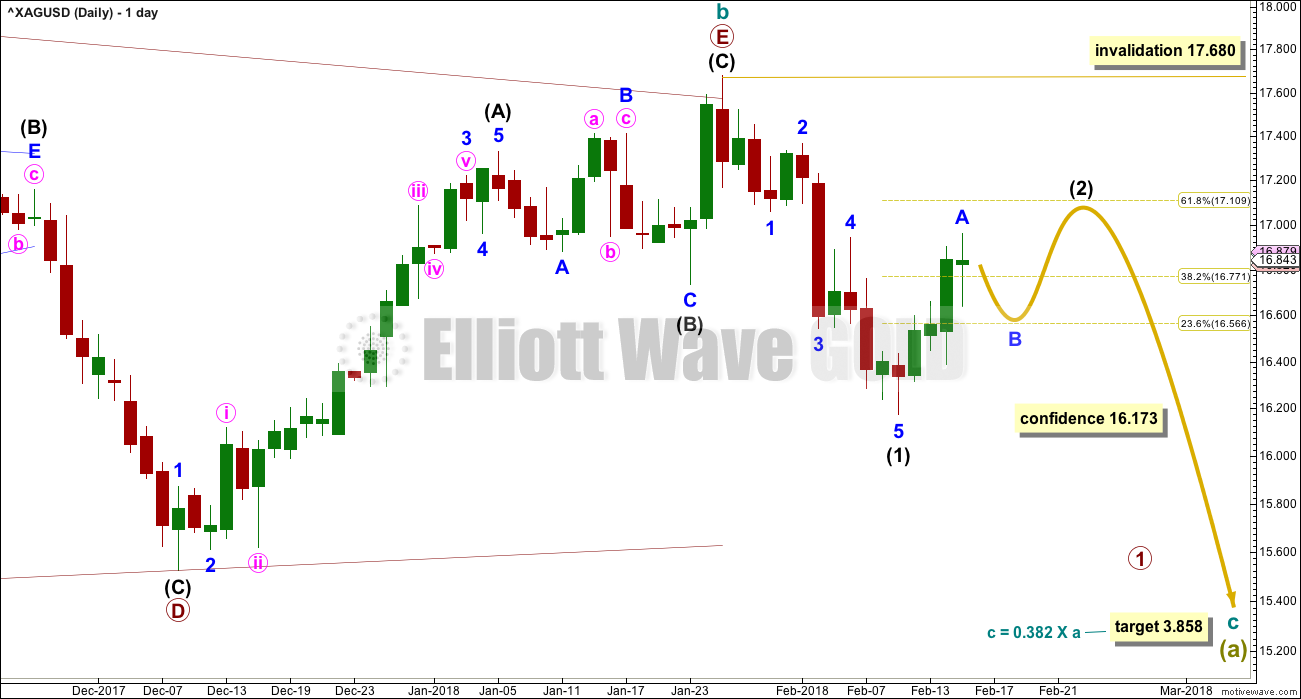
A five down may now be complete. Minor wave 1 subdivides very well as a leading contracting diagonal on the hourly chart. Minor wave 3 exhibits strong momentum. Minor wave 4 does not overlap minor wave 1 price territory.
A five down may be followed by a three up. Intermediate wave (2) would most likely end about the 0.618 Fibonacci ratio of intermediate wave (1) about 17.100. At this stage, intermediate wave (2) looks to be too brief in relation to intermediate wave (1) for it to be over at the high today. With some support from volume for upwards movement, it looks likely to continue.
A new high by any amount at any time frame above 17.680 would invalidate this wave count for Silver. Intermediate wave (2) may not move beyond the start of intermediate wave (1).
SECOND WAVE COUNT
WEEKLY CHART
Click chart to enlarge.
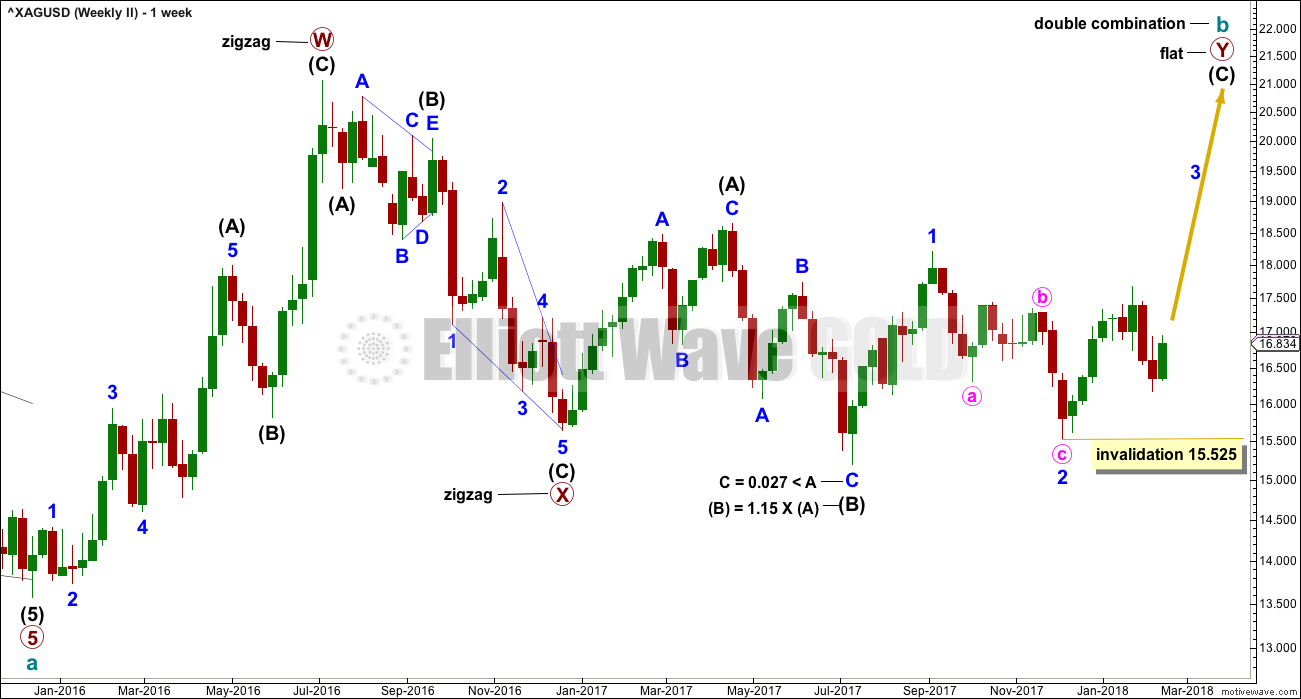
Cycle wave b may be completing as a double combination: zigzag – X – flat. The second structure, a flat correction for primary wave Y, may be underway.
Within a flat correction, intermediate wave (B) must retrace a minimum 0.9 length of intermediate wave (A) at 15.938. Intermediate wave (B) has met this minimum requirement; the rule for a flat correction is met. Intermediate wave (B) is longer than 1.05 times the length of intermediate wave (A) indicating this may be an expanded flat. Expanded flat corrections are the most common type. Normally their C waves are 1.618 or 2.618 the length of their A waves.
The target calculated would see primary wave Y to end close to same level as primary wave W about 21.062. The purpose of combinations is to take up time and move price sideways. To achieve this purpose the second structure in the double normally ends about the same level as the first.
While the combination wave count at the weekly chart level does not currently work for Gold, it does still work for Silver. They do not have to complete the same structures for cycle wave b, and fairly often their structures are different.
At this stage, the duration of minor wave 2 now looks wrong. This wave count is now less likely.
DAILY CHART
Click chart to enlarge.
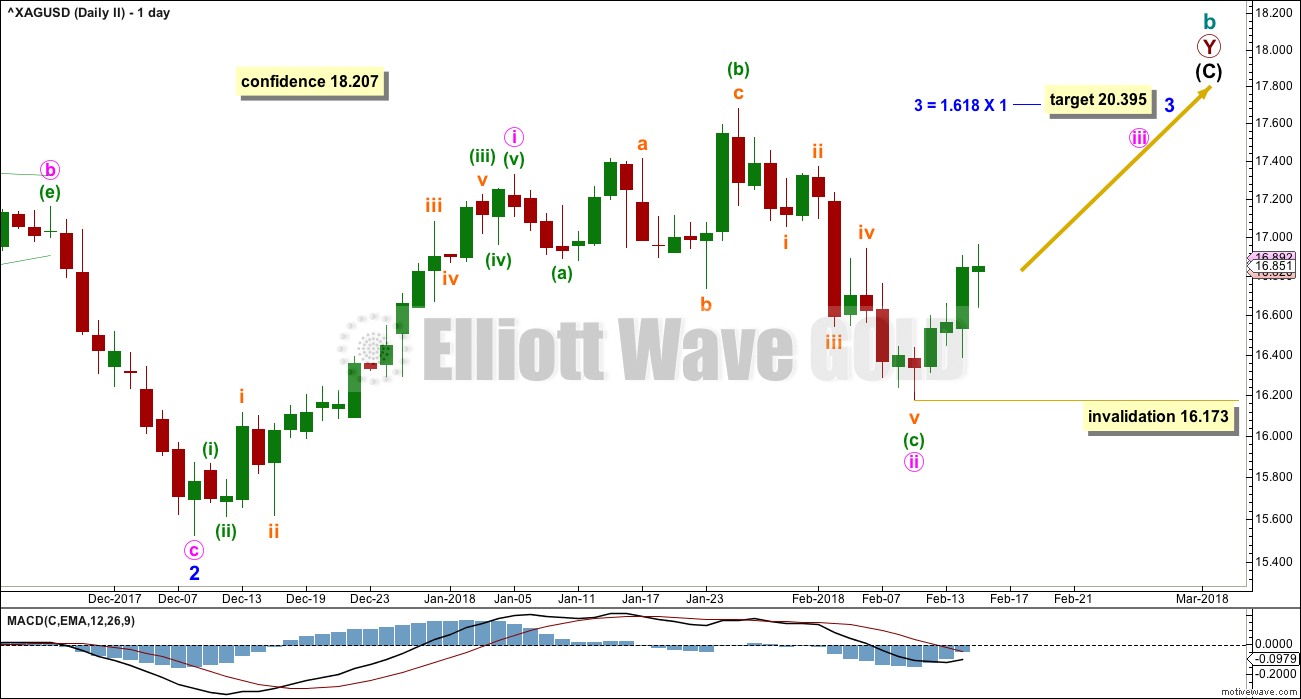
Minor wave 3 may only subdivide as an impulse and must move above the end of minor wave 1 at 18.207.
Within minor wave 3, minute waves i and now also ii may be complete. Minute wave ii is very close to the 0.618 Fibonacci ratio of minute wave i. Within minute wave iii, no second wave correction may move beyond the start of its first wave below 16.173.
Minor wave 3 must move beyond the end of minor wave 1 above 18.207. A new high above this point would meet the Elliott wave rule and add confidence to the wave count.
The target for minor wave 3 expects the most common Fibonacci ratio to minor wave 1.
ALTERNATE WAVE COUNT
WEEKLY CHART
Click chart to enlarge.
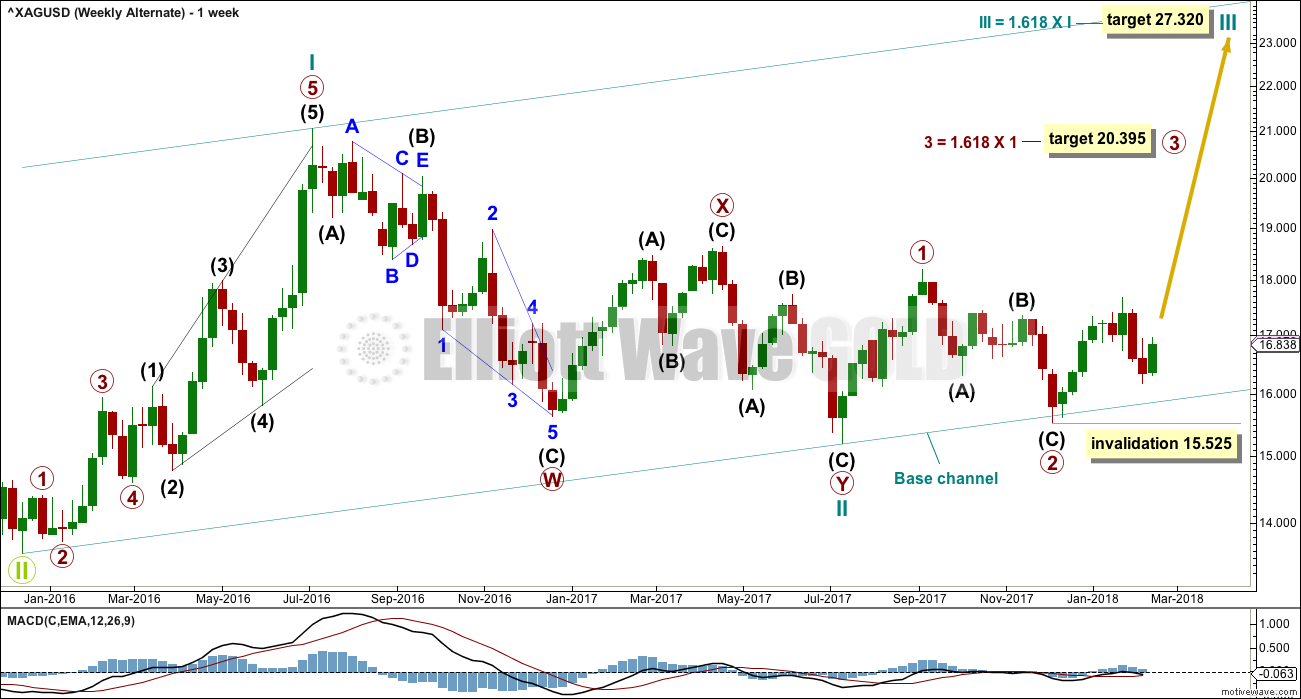
This alternate wave count looks at the possibility that the bear market may be over for Silver and a new bull market may have begun.
A series of two overlapping first and second waves may now be complete for cycle waves I and II, and primary waves 1 and 2.
A third wave now at two large degrees may be beginning.
Targets calculated for third waves assume the most common Fibonacci ratios to their respective first waves. As price approaches each target, if the structure is incomplete or price keeps rising through the target, then the next Fibonacci ratio in the sequence would be used to calculate a new target.
Within primary wave 3, no second wave correction may move beyond the start of its first wave below 15.525.
The large base channel about cycle waves I and II nicely shows where primary wave 2 found support. A lower degree second wave correction should find support (in a bull market) about a base channel drawn about a first and second wave one or more degrees higher.
DAILY CHART
Click chart to enlarge.
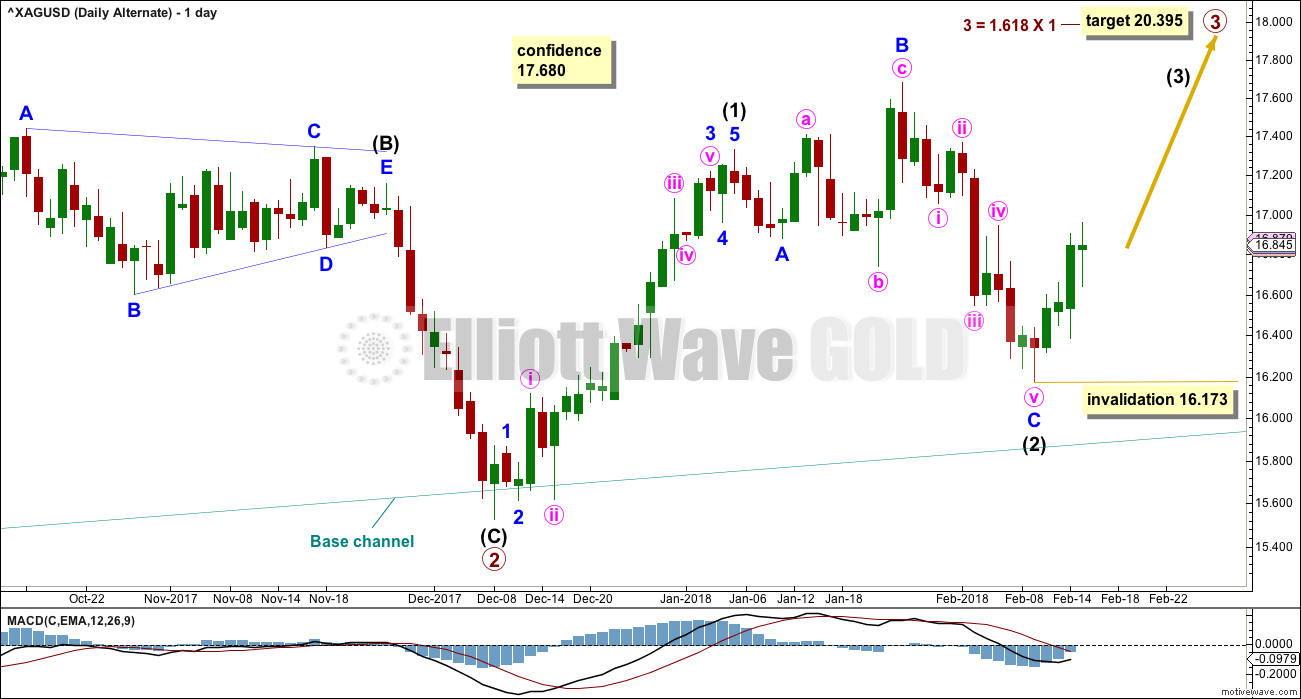
The expanded flat correction for intermediate wave (2) may be complete. If this is correct, then a third wave up at three large degrees may be in the very early days for Silver.
Within intermediate wave (3), no second wave correction may move beyond the start of its first wave below 16.173.
TECHNICAL ANALYSIS
WEEKLY CHART
Click chart to enlarge. Chart courtesy of StockCharts.com.
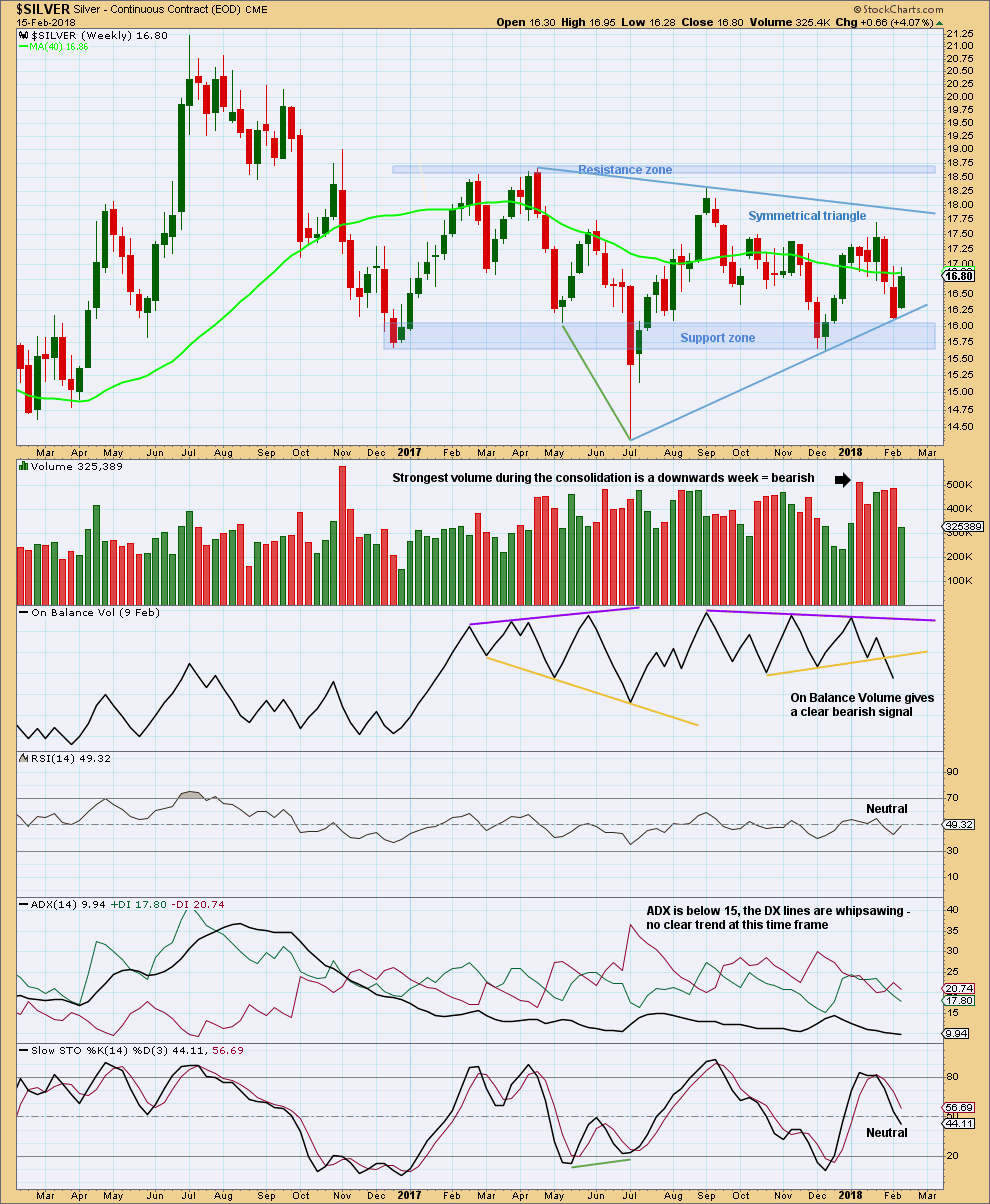
Silver is still range bound. A large symmetrical triangle may be completing. It is a downwards week during this triangle which has strongest volume suggesting a downwards breakout may be more likely than upwards.
The bearish signal from On Balance Volume is now clear. This adds support to the idea that the breakout from this consolidation may be more likely downwards. This favours the first Elliott wave count.
Price is at support. Expect a bounce here to resistance.
DAILY CHART
Click chart to enlarge. Chart courtesy of StockCharts.com.
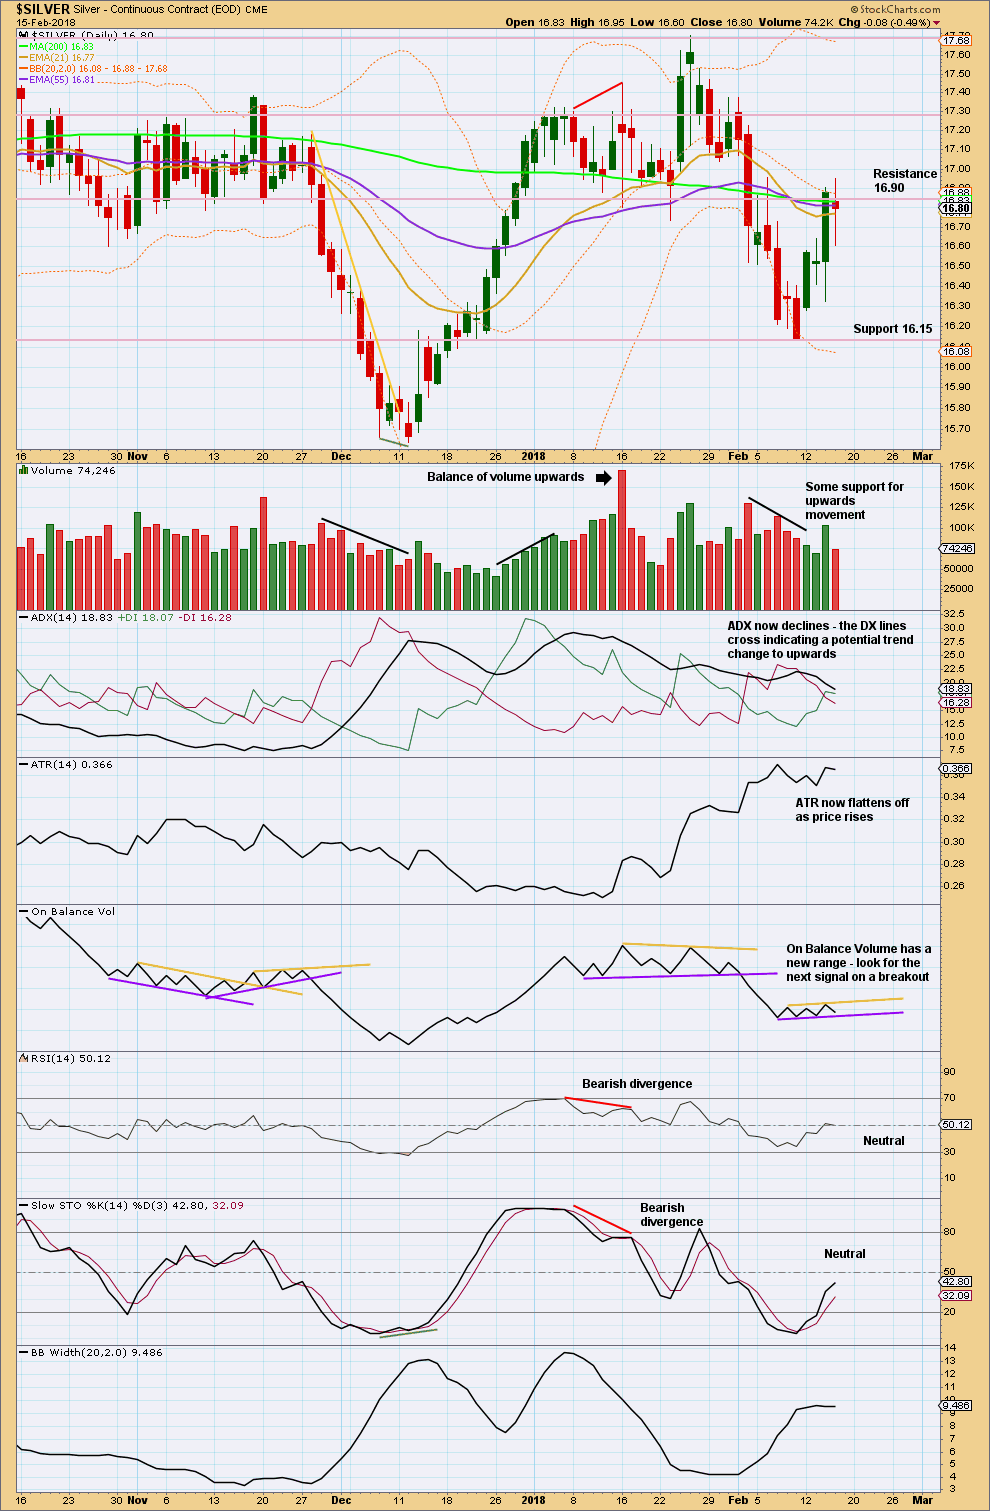
At neither weekly nor daily time frames is there a clear trend.
Price may now be returning from support in an upwards swing. Expect it to continue until price reaches resistance and Stochastics is overbought at the same time.
After prices breaks through resistance, at about 16.90, the next resistance is about 17.30 and after that about 17.70.
Price does not move in straight lines when it consolidates and swings from support to resistance and back again. Typically, consolidations are characterised by choppy and overlapping movement. For the short term, look to a signal from On Balance Volume for the next move within this upwards swing.
Published @ 8:05 p.m. EST.