
A bounce was expected for the last week, which is exactly what has happened.
Summary: The target is at 13.39. A new low below 55.24 would add confidence to the main bearish wave count.
The bounce may be over at Friday’s high. Volume is declining and there is a candlestick reversal pattern.
Always practice good risk management as the most important aspect of trading. Always trade with stops and invest only 1-5% of equity on any one trade. Failure to manage risk is the most common mistake new traders make.
New updates to this analysis are in bold.
MAIN WAVE COUNT
MONTHLY CHART
Click chart to enlarge.
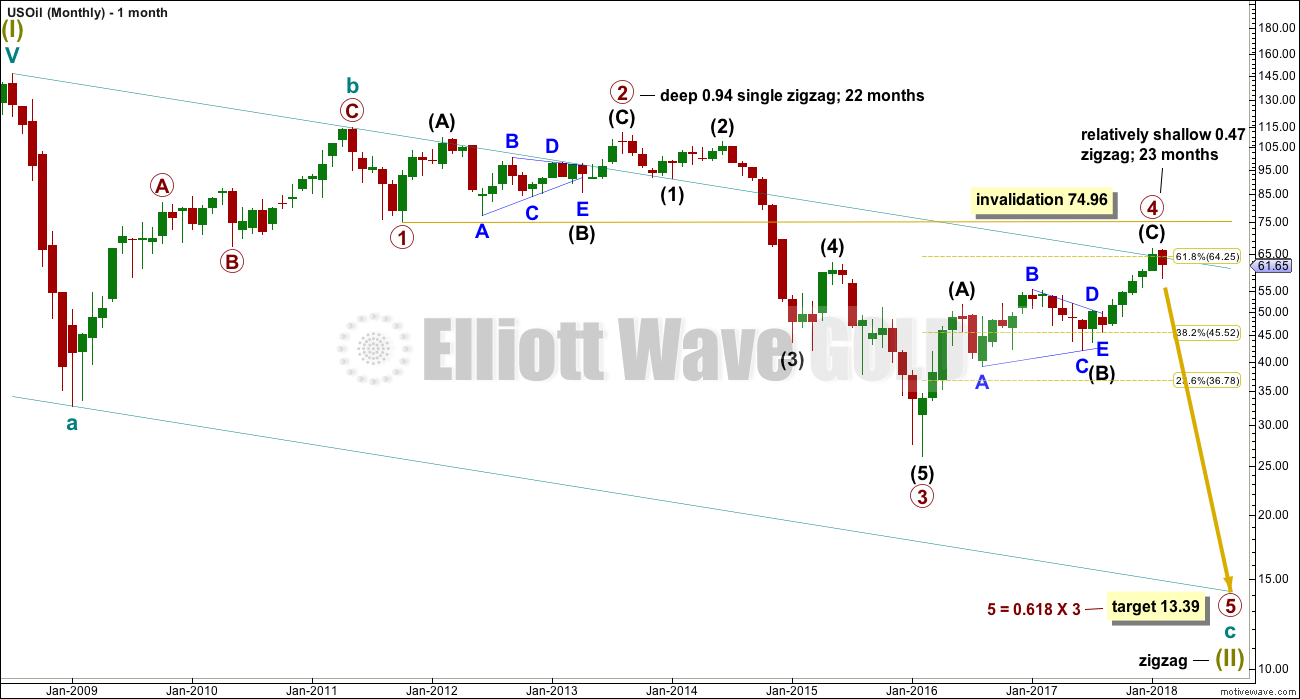
Within the bear market, cycle wave b is seen as ending in May 2011. Thereafter, a five wave structure downwards for cycle wave c begins.
Primary wave 1 is a short impulse lasting five months. Primary wave 2 is a very deep 0.94 zigzag lasting 22 months. Primary wave 3 is a complete impulse with no Fibonacci ratio to primary wave 1. It lasted 30 months.
There is alternation in depth with primary wave 2 very deep and primary wave 4 relatively shallow. There is inadequate alternation in structure, both are zigzags. So far primary wave 4 has lasted 23 months. At this stage, there is almost perfect proportion between primary waves 2 and 4.
Primary wave 4 may not move into primary wave 1 price territory above 74.96.
The wider Elliott channel (teal) about this whole movement may offer support to primary wave 5.
Price closed above the teal resistance line, the upper edge of this very wide channel. This wave count expected it would be fairly likely that primary wave 4 should have found resistance there. Because this line is now breached on the daily chart a new alternate is considered below.
WEEKLY CHART
Click chart to enlarge.
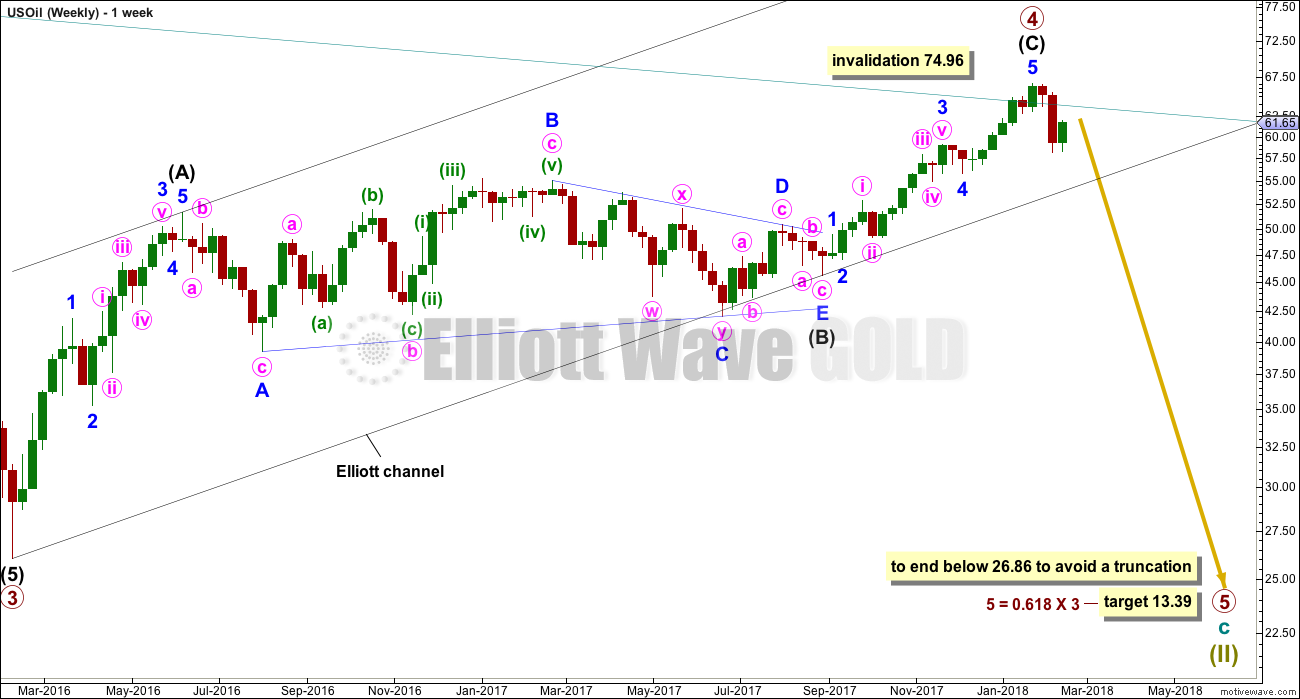
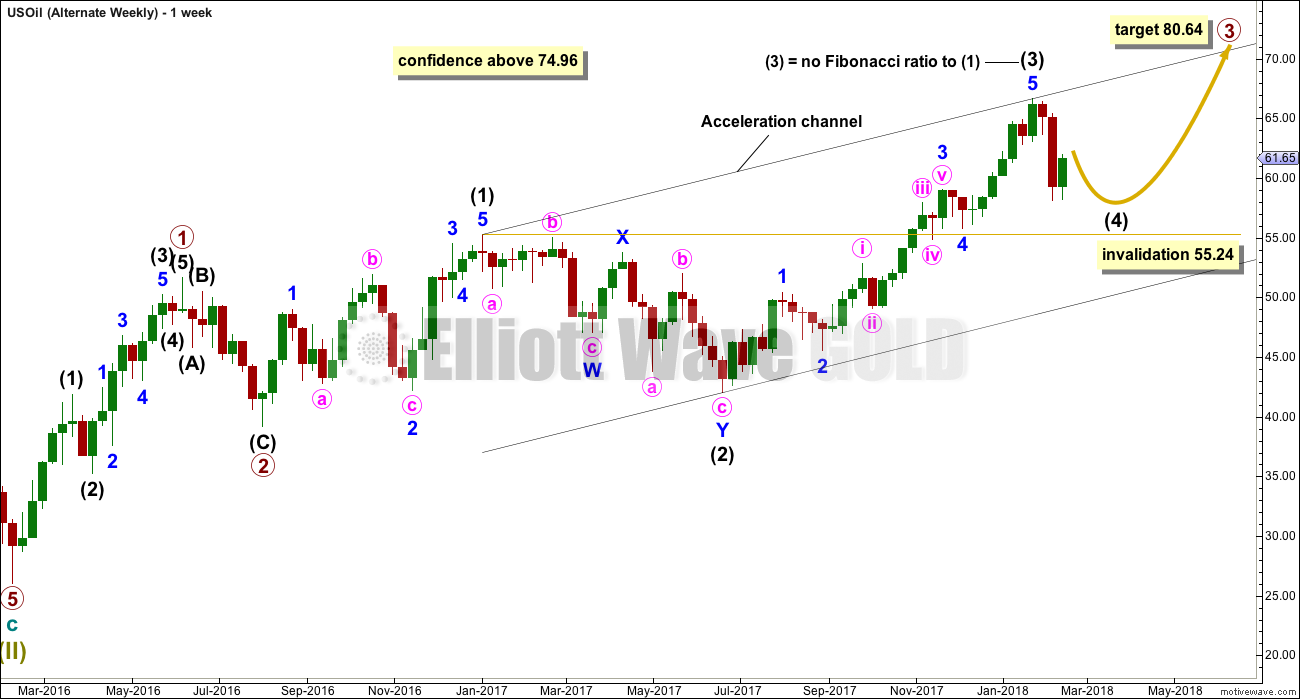
Primary wave 4 subdivides as a zigzag, and within it intermediate wave (C) may now be complete. If primary wave 5 were to only reach equality in length with primary wave 3, it would end with a small truncation. A target for primary wave 5 may best be calculated at intermediate degree. That can only be done when intermediate waves (1) through to (4) within primary wave 5 are complete.
For now a target will be calculated at primary degree using a ratio between primary waves 3 and 5. This target only has a small probability. This target will be recalculated as primary wave 5 nears its end, so it may change.
An Elliott channel is added to this possible zigzag for primary wave 4. A breach of the lower edge of this channel would provide a very strong indication that primary wave 4 should be over and primary wave 5 should be underway. Look out for some support on the way down, perhaps a short term bounce about the lower edge of the channel.
DAILY CHART
Click chart to enlarge.
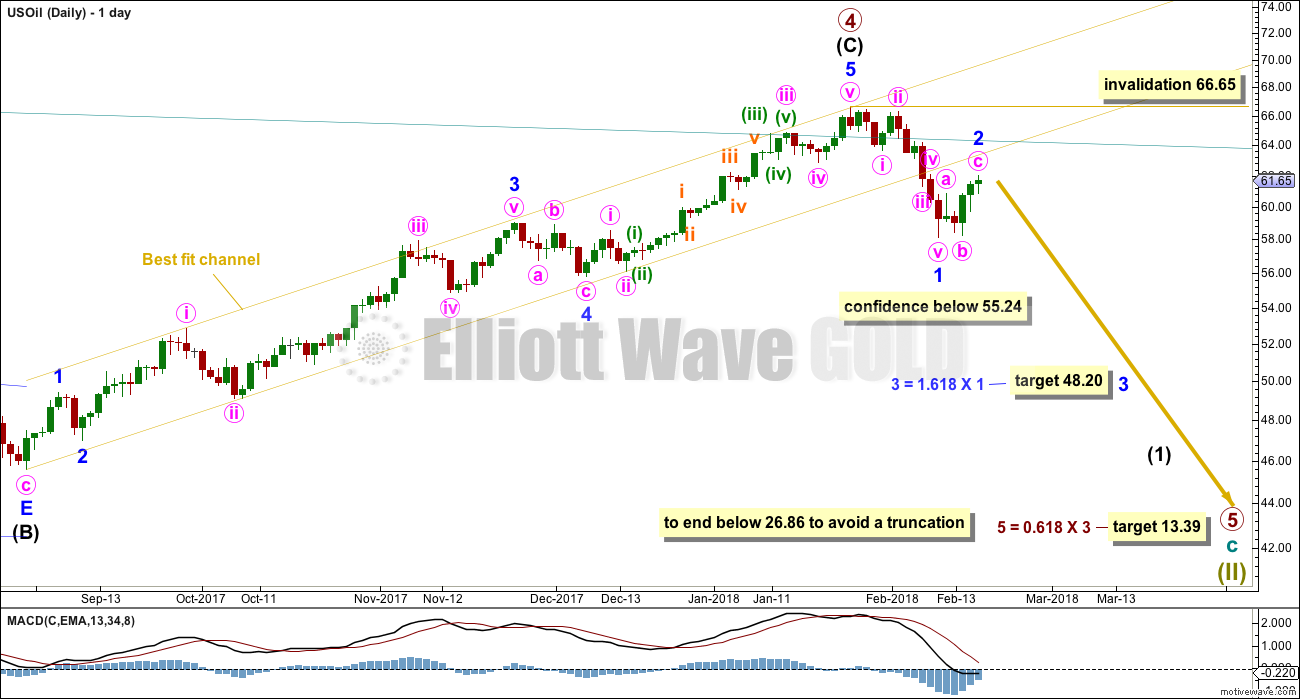
Minor wave 1 may be complete and now the following bounce of minor wave 2 may also be complete.
A target is calculated for minor wave 3 which expects it to exhibit a common Fibonacci ratio to minor wave 1.
If minor wave 2 continues higher, then it may not move beyond the start of minor wave 1 above 66.65.
If price makes a new low by any amount at any time frame below 55.24, then the alternate wave count below would be invalidated and more confidence may be had in this main wave count.
ALTERNATE WAVE COUNT
MONTHLY CHART
Click chart to enlarge.
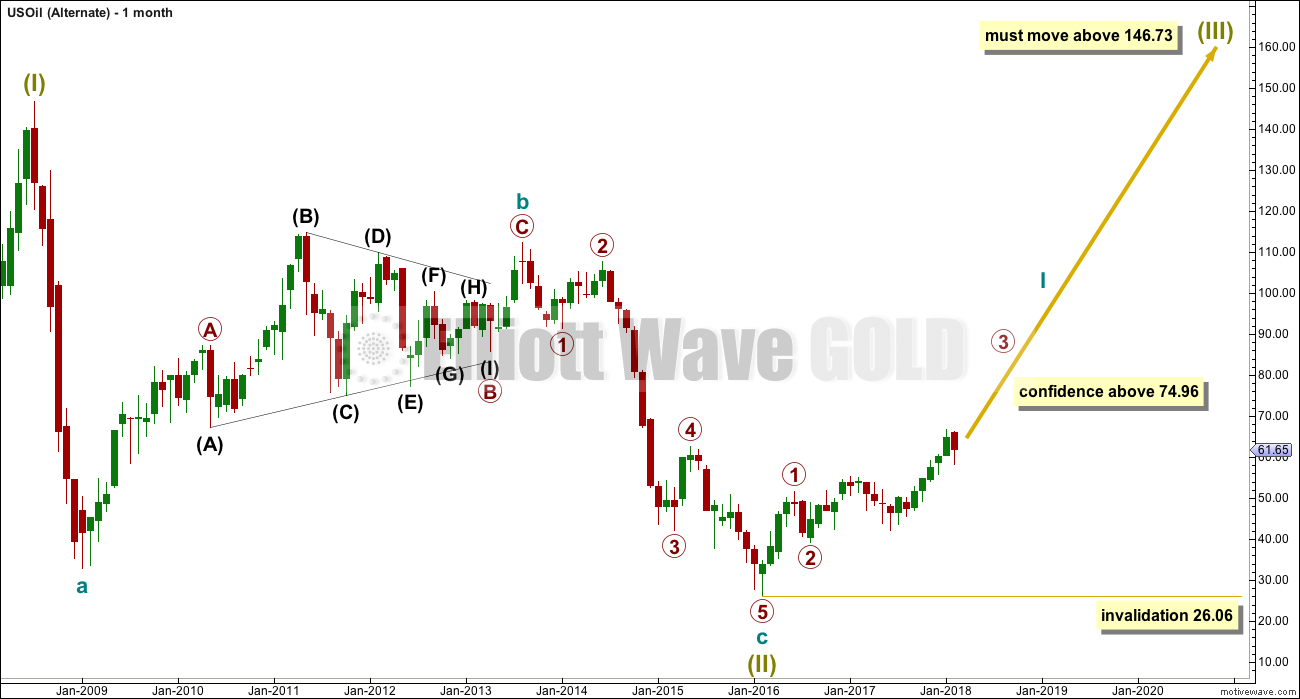
It is possible that the bear market for Oil is over and a new bull market is in the very early stages.
A huge zigzag down to the last low may be complete and is labelled here Super Cycle wave (II).
Cycle wave b must be seen as complete in August 2013 for this wave count to work. It cannot be seen as complete at the prior major swing high in May 2011.
Cycle wave b is seen as a zigzag, and within it primary wave B is seen as a running contracting triangle. These are fairly common structures, although nine wave triangles are uncommon. All subdivisions fit.
Primary wave C moves beyond the end of primary wave A, so it avoids a truncation. But it does not have to move above the price territory of primary wave B to avoid a truncation, which is an important distinction.
If cycle wave b begins there, then cycle wave c may be seen as a complete five wave impulse.
Super Cycle wave (III) must move beyond the end of Super Cycle wave (I). It must move far enough above that point to allow room for a subsequent Super Cycle wave (IV) to unfold and remain above Super Cycle wave (I) price territory.
WEEKLY CHART
Click chart to enlarge.
If a new bull market is in the very early stages for Oil, then it may have begun with two overlapping first and second waves at primary then at intermediate degree.
Primary wave 3 may only subdivide as an impulse, and within it intermediate wave (3) may be complete.
Intermediate wave (4) may not move into intermediate wave (1) price territory below 55.24. Intermediate wave (4) would most likely be incomplete. It may continue further sideways or lower.
TECHNICAL ANALYSIS
MONTHLY CHART
Click chart to enlarge. Chart courtesy of StockCharts.com.
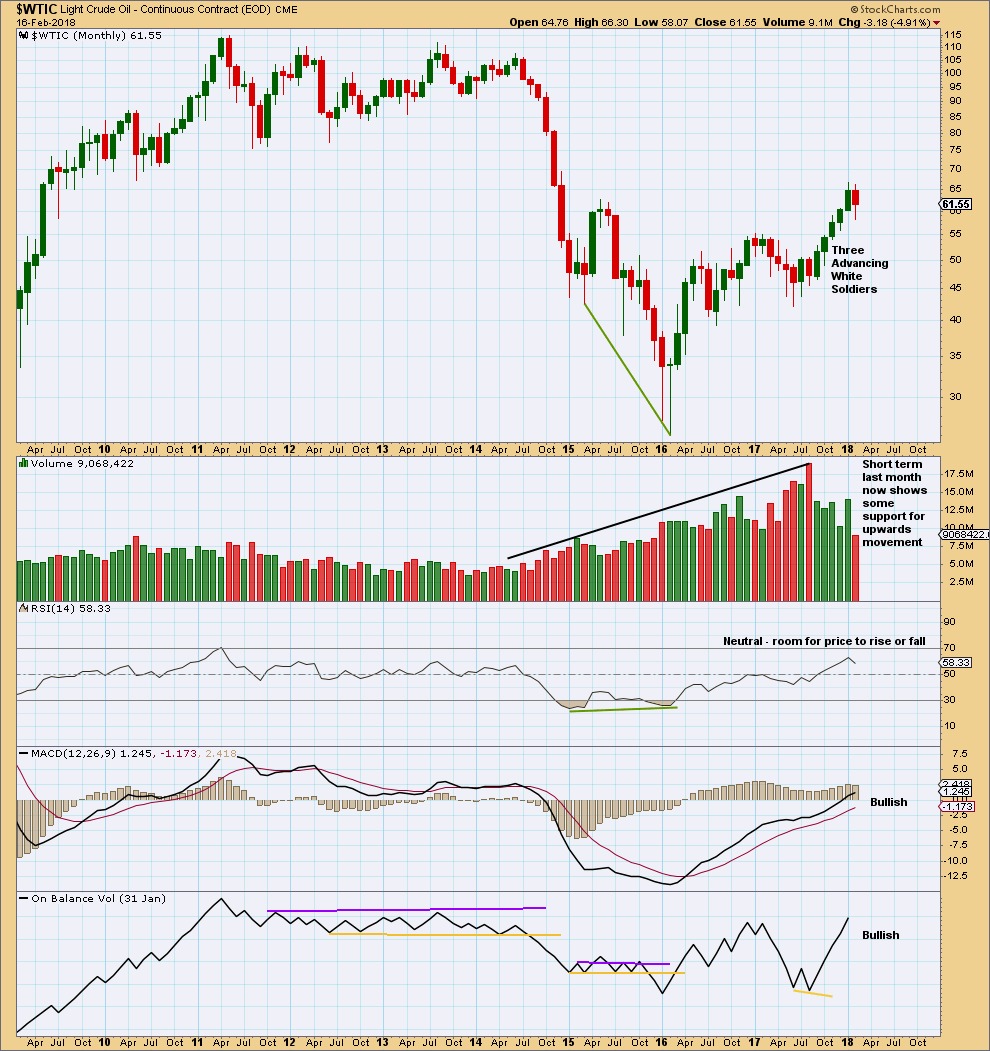
The strongest recent monthly volume is for the downwards month of August 2017. This is bearish.
For the now completed month of January the rise in price had support from volume. This is bullish. MACD and On Balance Volume are also both bullish. Overall, this chart is more bullish than bearish.
RSI indicates there is room for upwards movement to continue.
The month of February is incomplete and so no conclusions may yet be drawn about it.
DAILY CHART
Click chart to enlarge. Chart courtesy of StockCharts.com.
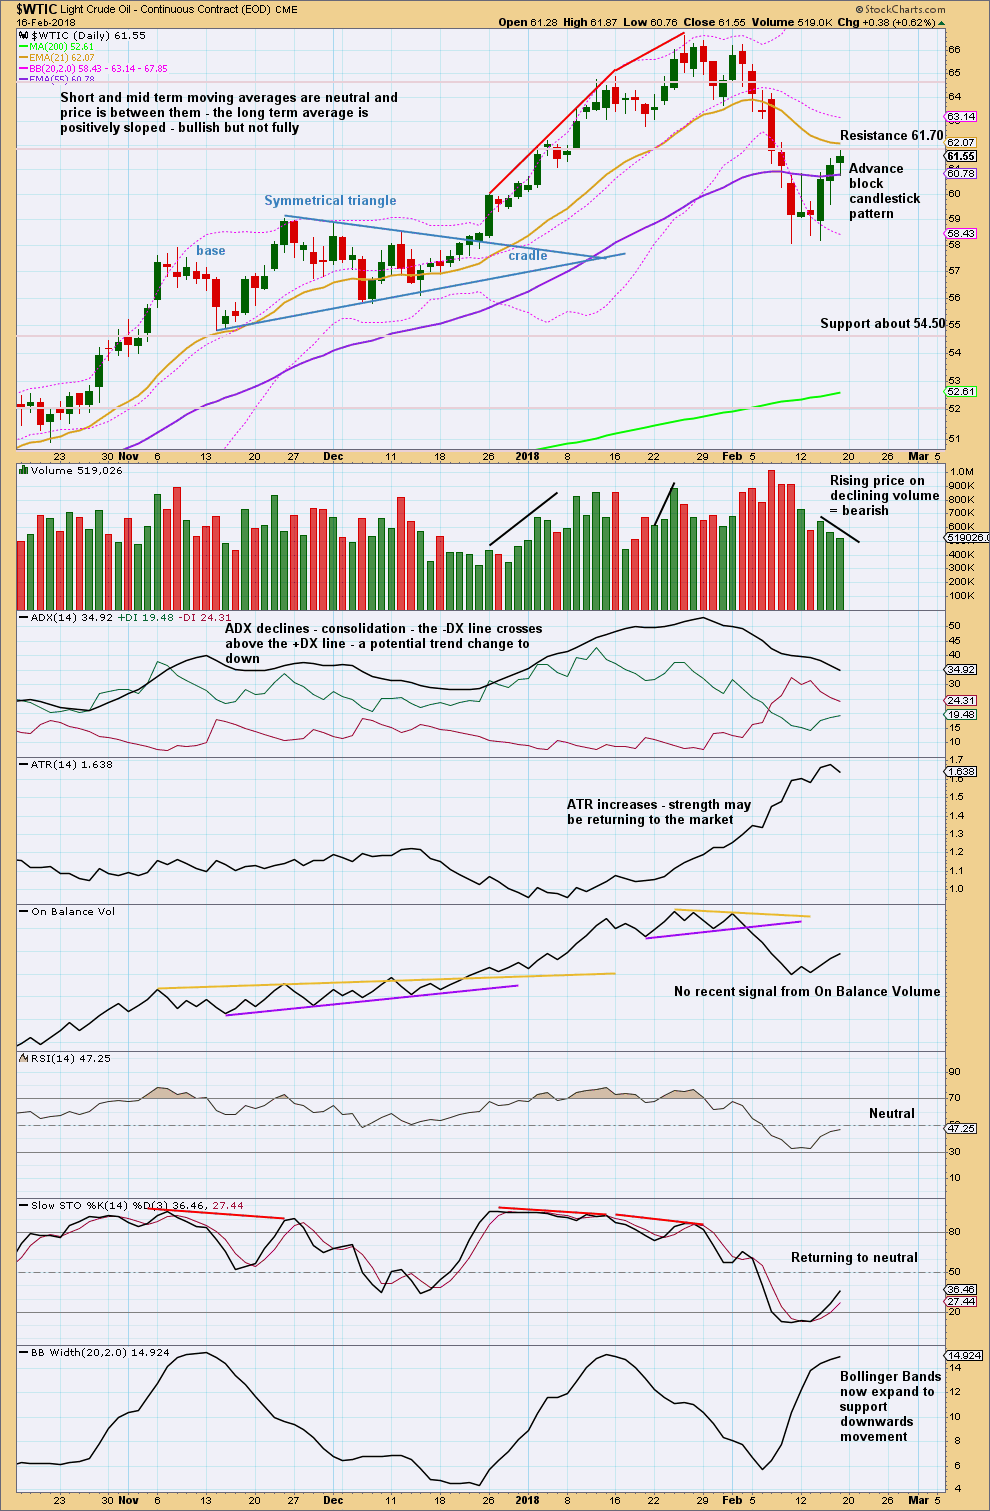
A lack of volume with rising price, an advance block candlestick pattern, and resistance about 61.70 all point to the bounce being over here.
VOLATILITY INDEX
Click chart to enlarge. Chart courtesy of StockCharts.com.
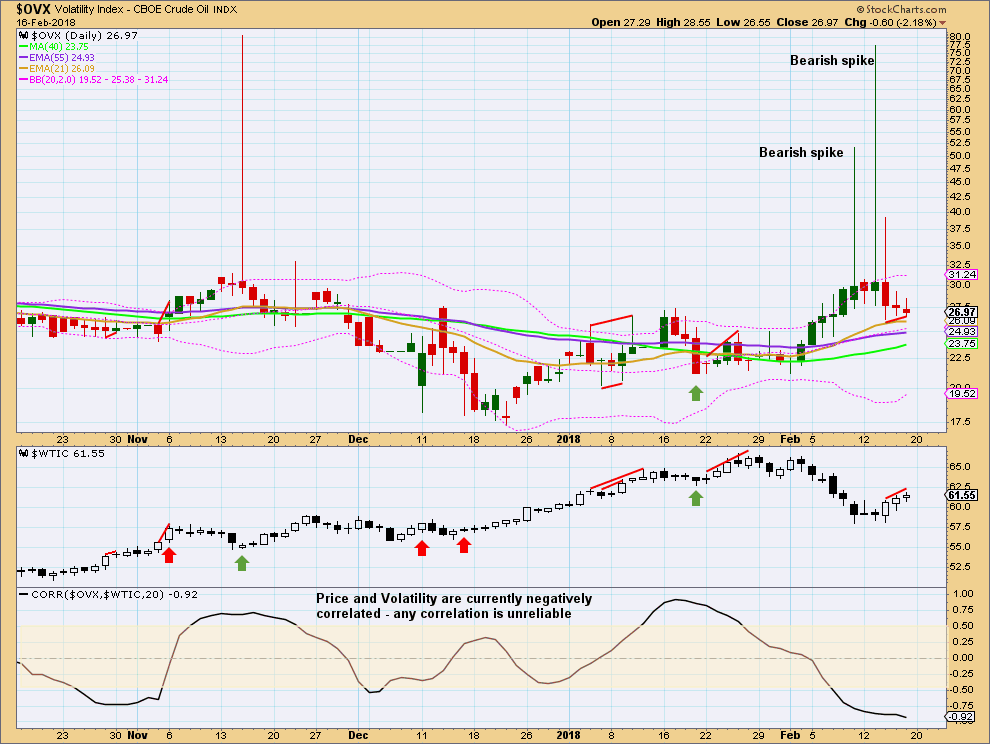
Another long upper wick four days ago was bearish for volatility and bullish for Oil price. This bearishness for volatility may now be resolved by three days of red candlesticks.
There is bearish divergence for price between the high in price on Friday and the high two days prior. Price has moved higher, but it has not come with a normal decline in volatility; volatility has not made corresponding new lows. This indicates a weakness in the rise in price.
Published @ 01:52 a.m. EST on 18th February, 2018.