
All three Elliott wave counts remain valid. Classic analysis favours the main Elliott wave count.
Summary: Classic analysis favours the main bearish Elliott wave count. Look for a little more downwards movement early next week to be followed by a bounce to about 17.109. Thereafter, a large downwards wave would be expected.
A new high above 17.680 would be very bullish. The target would be at 20.395.
Last monthly charts can be viewed here.
New updates to this analysis are in bold.
ELLIOTT WAVE COUNTS
MAIN WAVE COUNT
WEEKLY CHART
Click chart to enlarge.
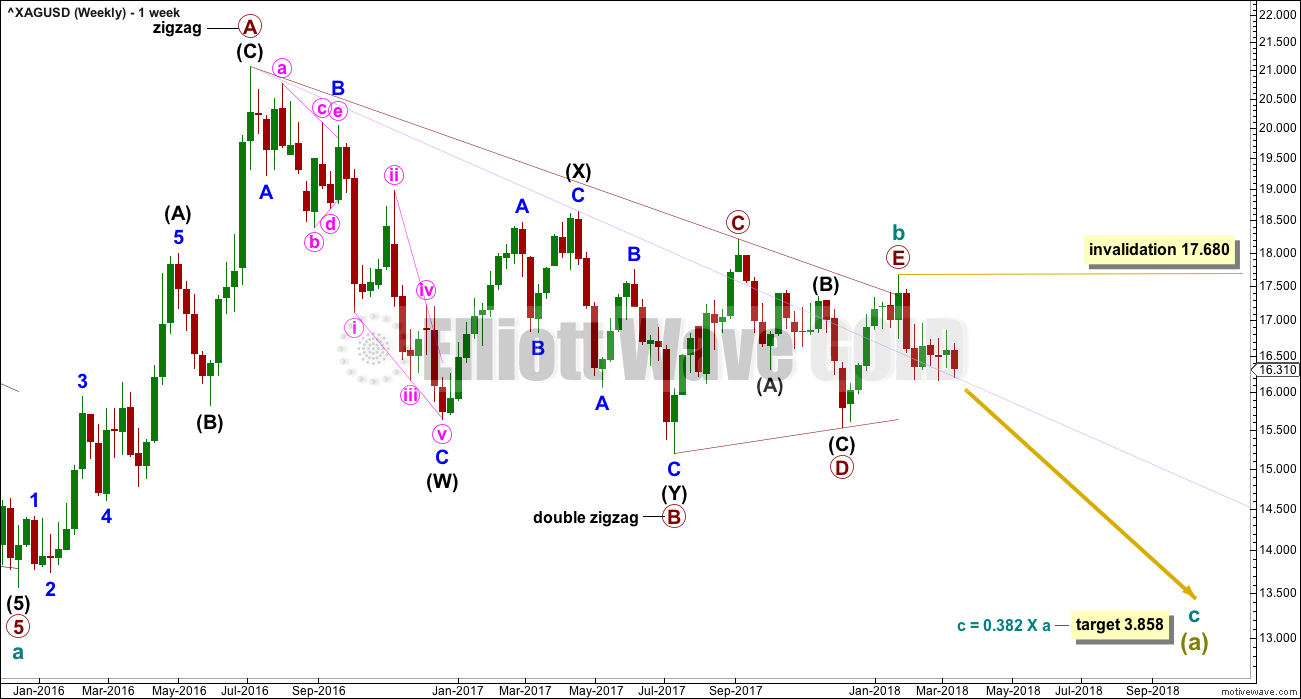
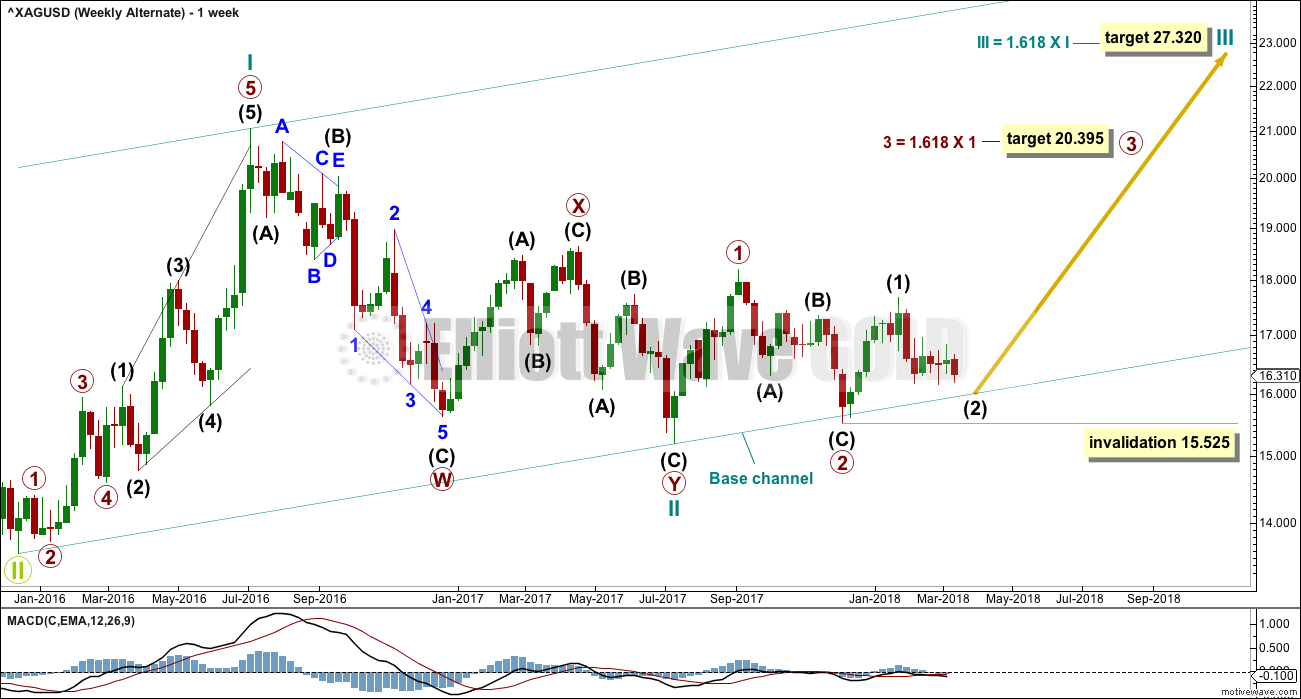
The main wave count expects that the bear market, which began from the April 2011 high, is incomplete.
Cycle wave a is seen as a five wave impulse for this main wave count. There are multiple corrective structures possible still for cycle wave b.
This first weekly chart sees cycle wave b as a now possibly complete regular contracting triangle.
Primary wave E of the triangle may have ended with an overshoot of the A-C trend line. If this wave count is correct, then price should have reversed already. Within the new downwards trend, no second wave correction may move beyond the start of the first wave above 17.680.
DAILY CHART
Click chart to enlarge.
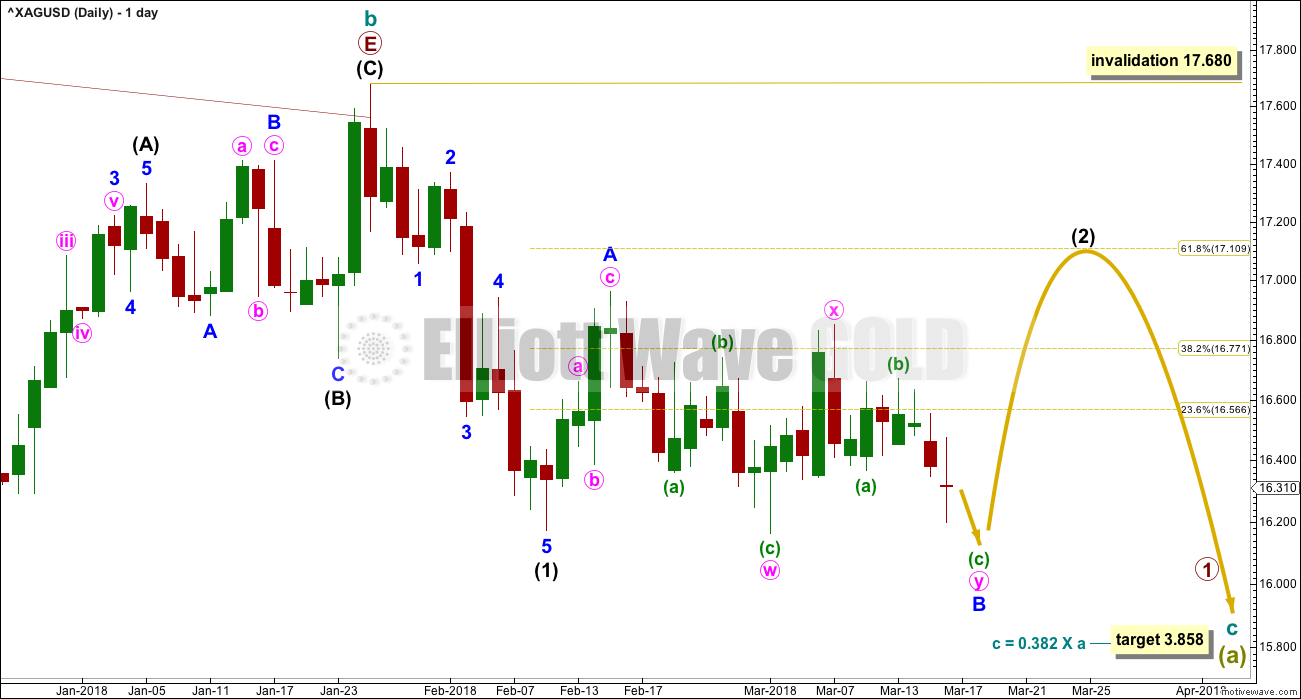
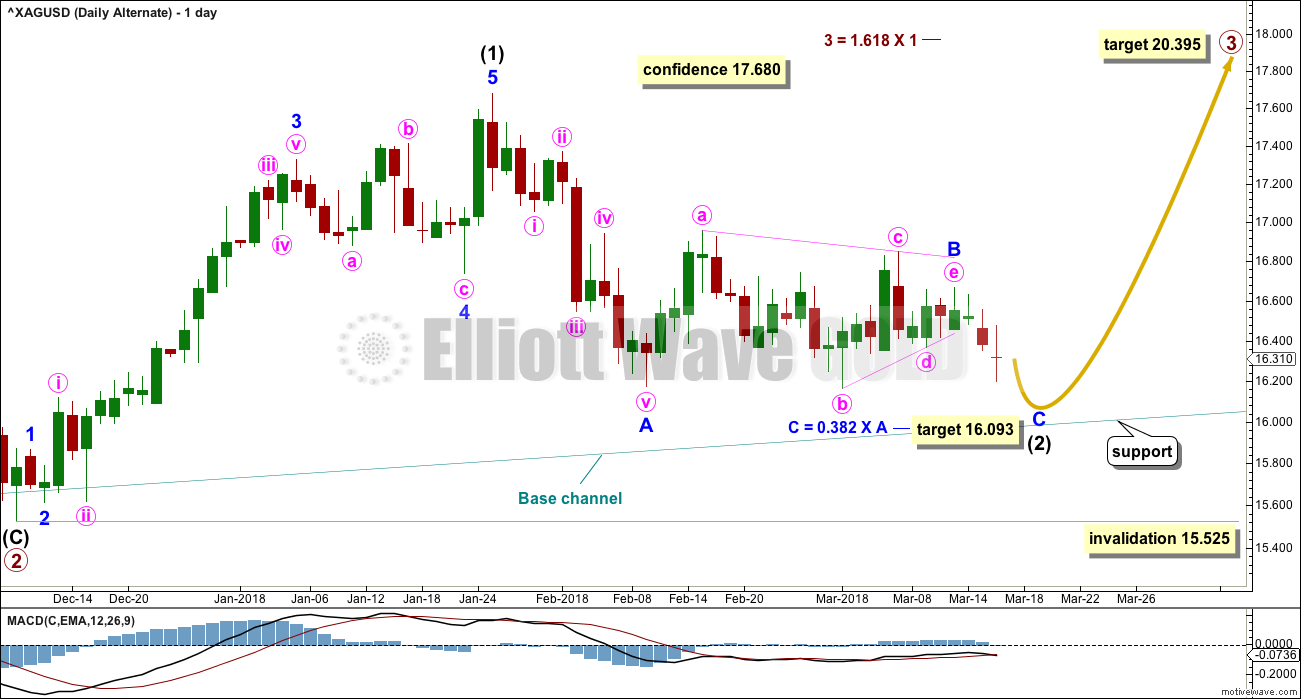
Intermediate wave (1) down subdivides well as a five wave structure.
Intermediate wave (2) may be an incomplete flat correction. Minor wave B may have moved lower last week as a double zigzag. The purpose of a second zigzag in a double is to deepen the correction. So if minor wave B is a double zigzag, it would be very likely that minute wave y moves below the end of minute wave w to achieve its purpose.
Within flat corrections, the common length for B waves is from 1 to 1.38 times the length of the A wave. The common range for minor wave B would be from 16.173 to 15.874.
When minor wave B is complete, then minor wave C upwards would be very likely to make at least a slight new high above the end of minor wave A at 16.961 to avoid a truncation and a very rare running flat. Minor wave C may end about the 0.618 Fibonacci ratio of intermediate wave (1) at 17.109.
Intermediate wave (2) may not move beyond the start of intermediate wave (1) above 17.680.
SECOND WAVE COUNT
WEEKLY CHART
Click chart to enlarge.
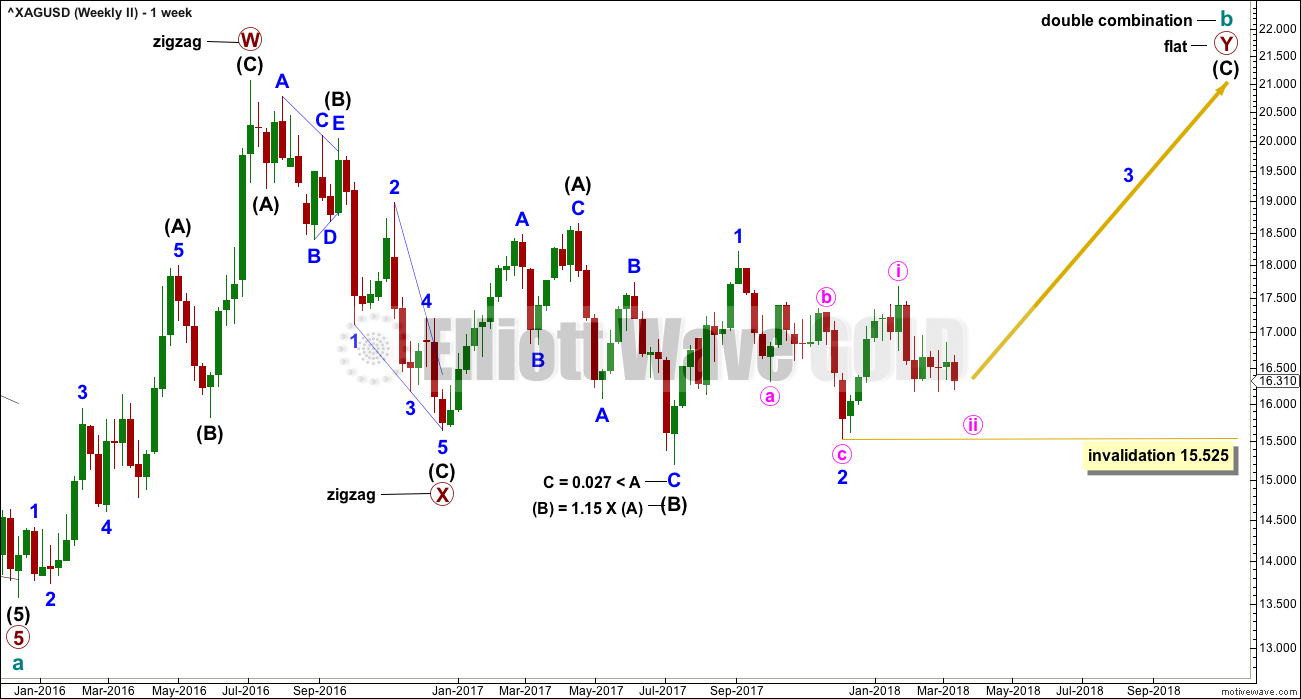
Cycle wave b may be completing as a double combination: zigzag – X – flat. The second structure, a flat correction for primary wave Y, may be underway.
Within a flat correction, intermediate wave (B) must retrace a minimum 0.9 length of intermediate wave (A) at 15.938. Intermediate wave (B) has met this minimum requirement; the rule for a flat correction is met. Intermediate wave (B) is longer than 1.05 times the length of intermediate wave (A) indicating this may be an expanded flat. Expanded flat corrections are the most common type. Normally their C waves are 1.618 or 2.618 the length of their A waves.
The target calculated would see primary wave Y to end close to same level as primary wave W about 21.062. The purpose of combinations is to take up time and move price sideways. To achieve this purpose the second structure in the double normally ends about the same level as the first.
While the combination wave count at the weekly chart level does not currently work for Gold, it does still work for Silver. They do not have to complete the same structures for cycle wave b, and fairly often their structures are different.
At this stage, the duration of minor wave 2 now looks wrong. This wave count is now less likely.
DAILY CHART
Click chart to enlarge.
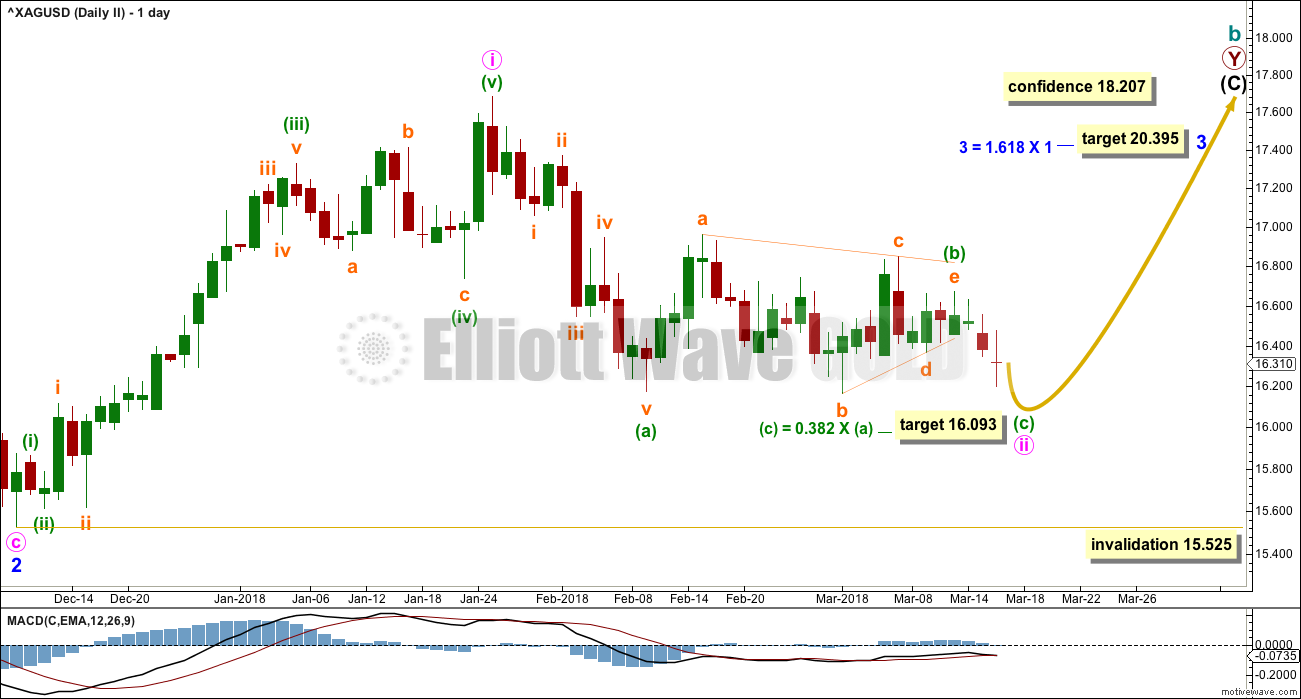
Minute wave ii may be continuing further.
Within minute wave ii, the sideways movement may be a triangle and this is labelled minuette wave (b). Minuette wave (b) may now be complete, and minuette wave (c) downwards may unfold. Minuette wave (c) would be very likely to make at least a slight new low below the end of minuette wave (a) at 16.173 to avoid a truncation. The target calculated expects this.
Minute wave ii may not move beyond the start of minute wave i below 15.525.
ALTERNATE WAVE COUNT
WEEKLY CHART
Click chart to enlarge.
This alternate wave count looks at the possibility that the bear market may be over for Silver and a new bull market may have begun.
A series of two overlapping first and second waves may now be complete for cycle waves I and II, and primary waves 1 and 2.
A third wave now at two large degrees may be beginning.
Targets calculated for third waves assume the most common Fibonacci ratios to their respective first waves. As price approaches each target, if the structure is incomplete or price keeps rising through the target, then the next Fibonacci ratio in the sequence would be used to calculate a new target.
Within primary wave 3, intermediate wave (2) may not move beyond the start of intermediate wave (1) below 15.525.
The large base channel about cycle waves I and II nicely shows where primary wave 2 found support. A lower degree second wave correction should find support (in a bull market) about a base channel drawn about a first and second wave one or more degrees higher.
DAILY CHART
Click chart to enlarge.
Intermediate wave (2) may be continuing further as a zigzag, and within the zigzag minor wave B may be a running contracting triangle. Minor wave C downwards would be very likely to make at least a slight new low below the end of minor wave A at 16.173 to avoid a truncation.
Intermediate wave (2) should find support about the lower edge of the base channel copied over from the weekly chart.
Intermediate wave (2) may not move beyond the start of intermediate wave (1) below 15.525.
TECHNICAL ANALYSIS
WEEKLY CHART
Click chart to enlarge. Chart courtesy of StockCharts.com.
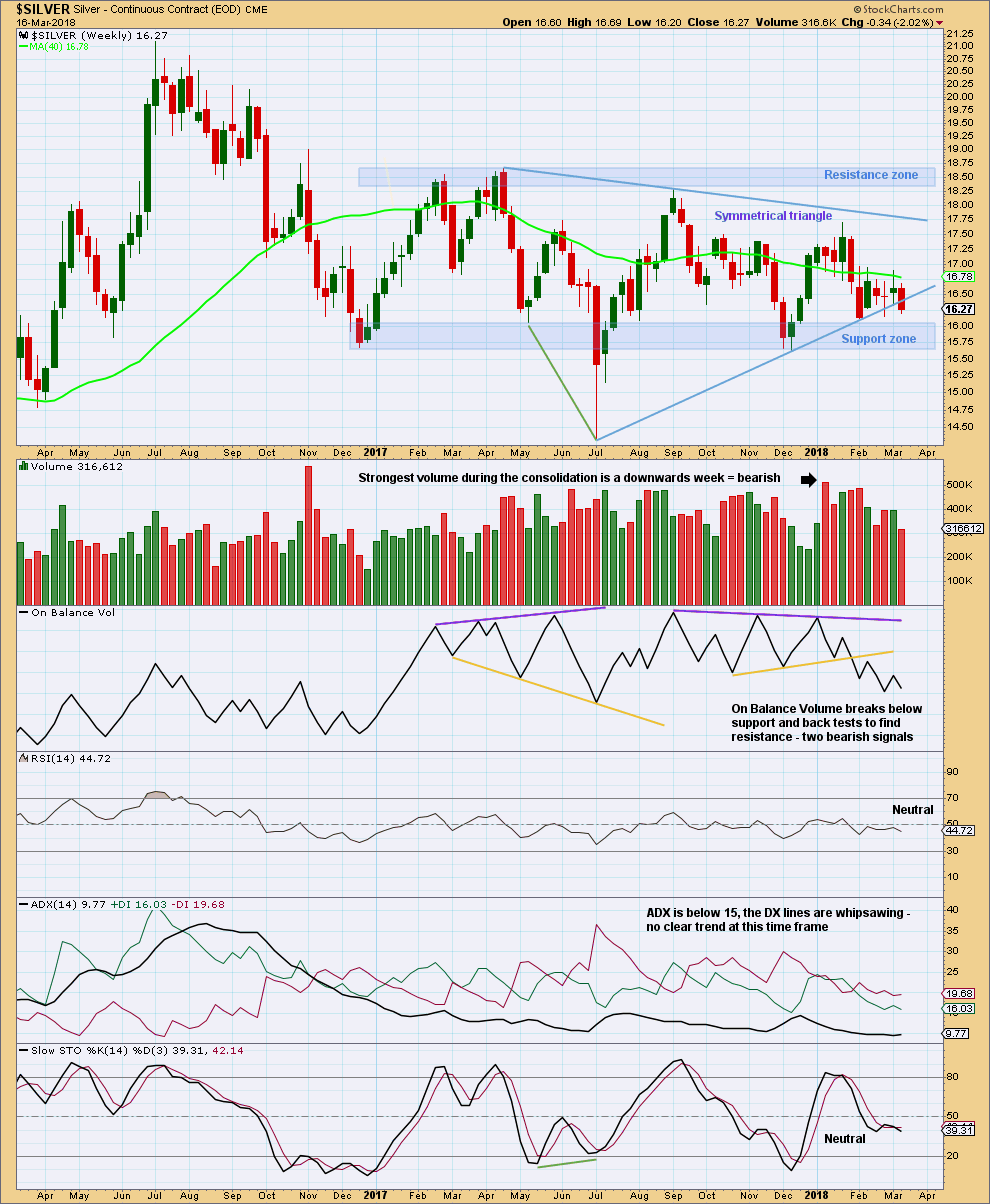
The support line on the symmetrical triangle may be drawn as shown, or it could be also drawn with a slightly more shallow slope. As it is drawn on this chart, this week has closed below it and a downwards breakout may be underway.
On Balance Volume also remains very bearish. This would offer more support to the main Elliott wave count, which is overall bearish, but puts some doubt on the expectations in that wave count for a strong bounce before a new bearish wave down.
DAILY CHART
Click chart to enlarge. Chart courtesy of StockCharts.com.
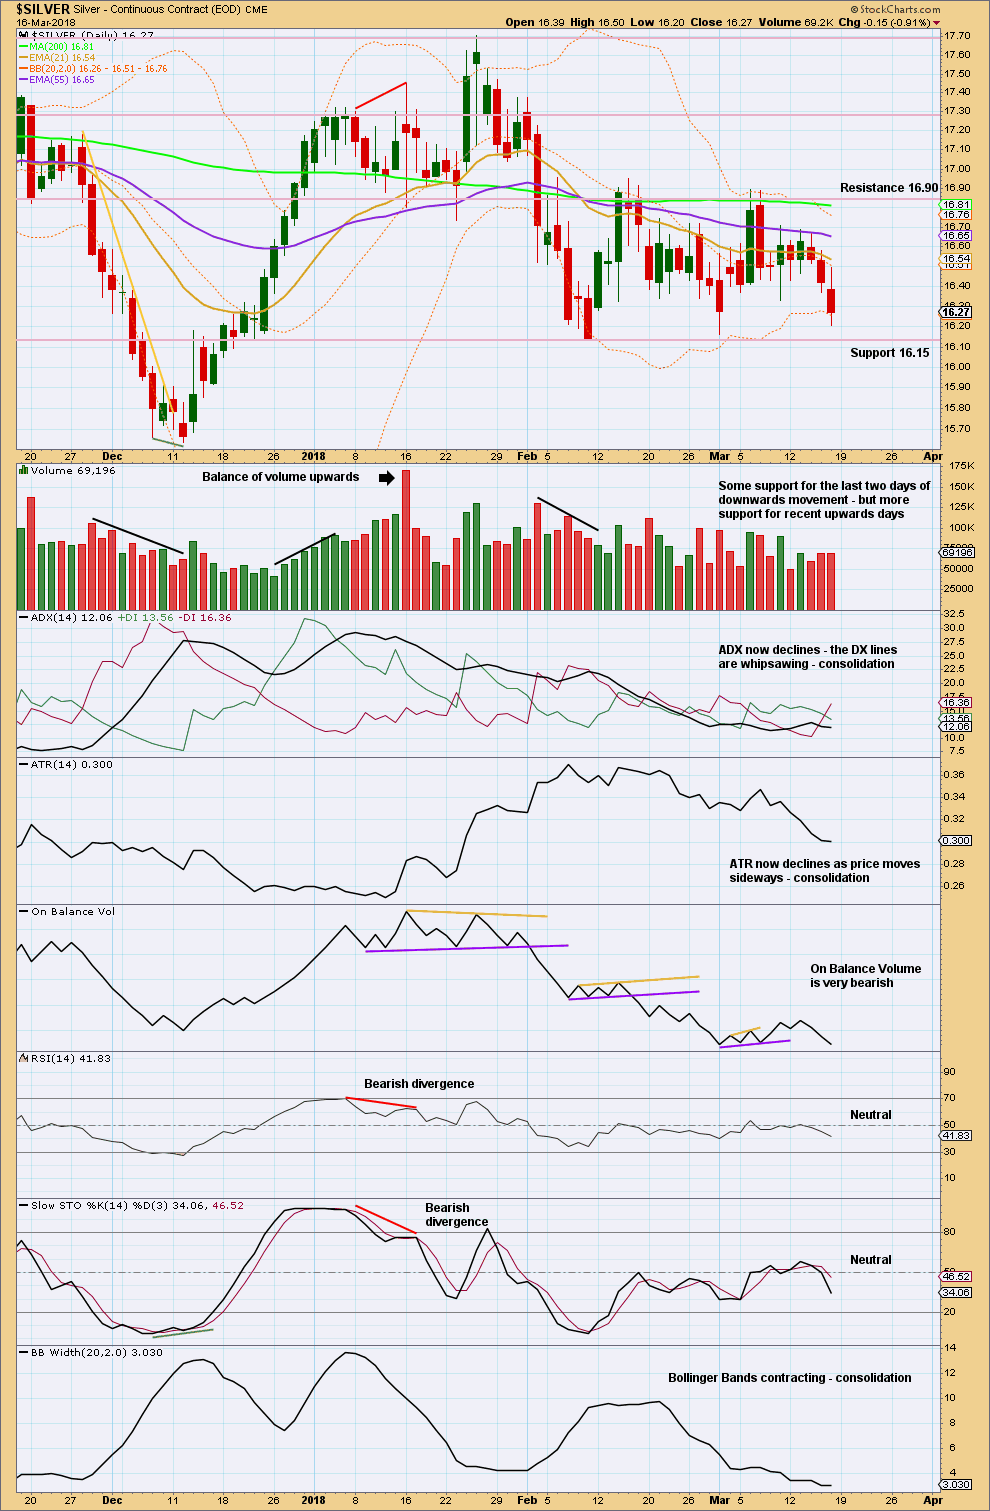
Silver continues to be range bound with resistance about 16.90 and support about 16.15. During this smaller consolidation (within the larger consolidation on the weekly chart), it is still the downwards day of the 20th of February that has strongest volume, suggesting a downwards breakout may be more likely than upwards.
On Balance Volume has made a slight new low this week, giving a very bearish signal. This also supports the main Elliott wave count and puts doubt on the expectations of a big bounce before a new strong wave down.
A breakout below support at 16.15 with a close below this point would be a further strong bearish signal.
Published @ 09:44 p.m. EST on 17th March, 2018.