
A bounce was expected to continue, with the target at 65.05. So far price has reached up to 65.99.
Summary: Price must turn here for the main Elliott wave count. A new high above 66.65 would substantially reduce the probability of the bearish wave count and increase the probability of a huge new bull market for Oil, which would have final confidence above 74.96.
Classic technical analysis this week strongly favours a bullish outlook. Members are advised to either hedge or be long here; shorts should be closed above 66.65.
If price turns lower here, then the target for a new low remains at 13.39. A new low on the way down, below 55.24, would add substantial confidence in a bearish outlook.
Always practice good risk management as the most important aspect of trading. Always trade with stops and invest only 1-5% of equity on any one trade. Failure to manage risk is the most common mistake new traders make.
New updates to this analysis are in bold.
MAIN WAVE COUNT
MONTHLY CHART
Click chart to enlarge.
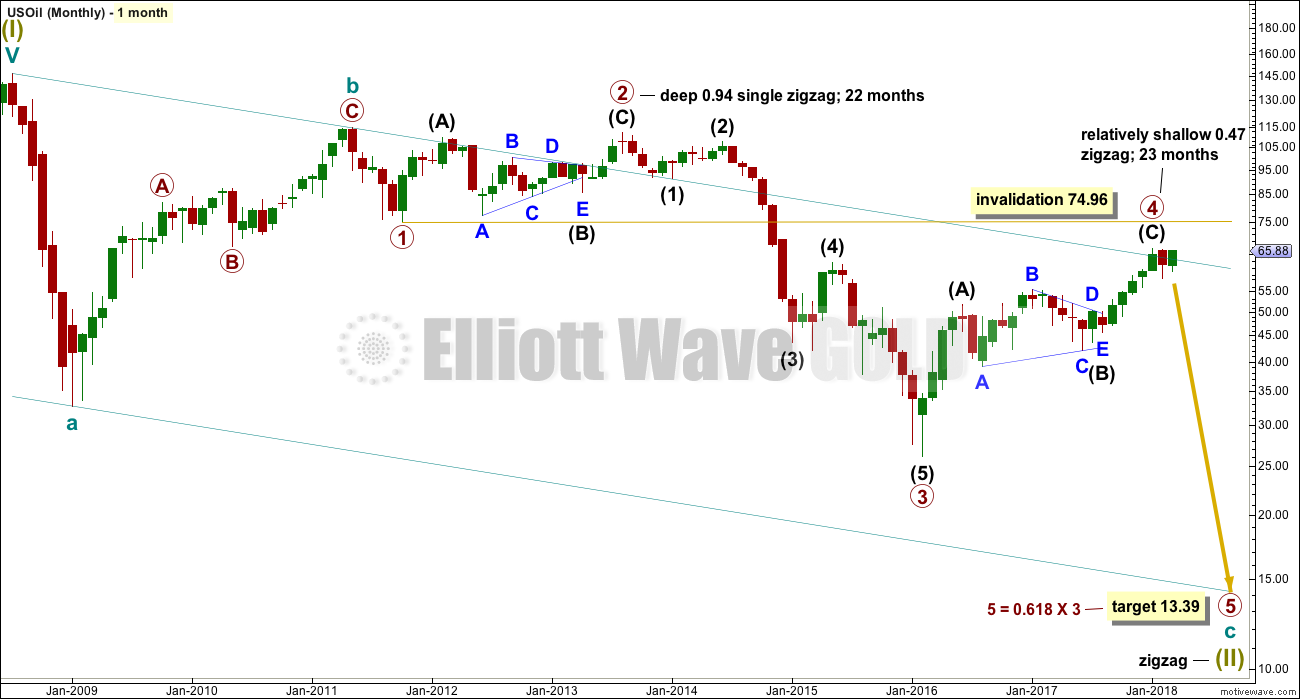
Within the bear market, cycle wave b is seen as ending in May 2011. Thereafter, a five wave structure downwards for cycle wave c begins.
Primary wave 1 is a short impulse lasting five months. Primary wave 2 is a very deep 0.94 zigzag lasting 22 months. Primary wave 3 is a complete impulse with no Fibonacci ratio to primary wave 1. It lasted 30 months.
There is alternation in depth with primary wave 2 very deep and primary wave 4 relatively shallow. There is inadequate alternation in structure, both are zigzags. So far primary wave 4 has lasted 23 months. At this stage, there is almost perfect proportion between primary waves 2 and 4.
Primary wave 4 may not move into primary wave 1 price territory above 74.96.
The wider Elliott channel (teal) about this whole movement may offer support to primary wave 5.
WEEKLY CHART
Click chart to enlarge.
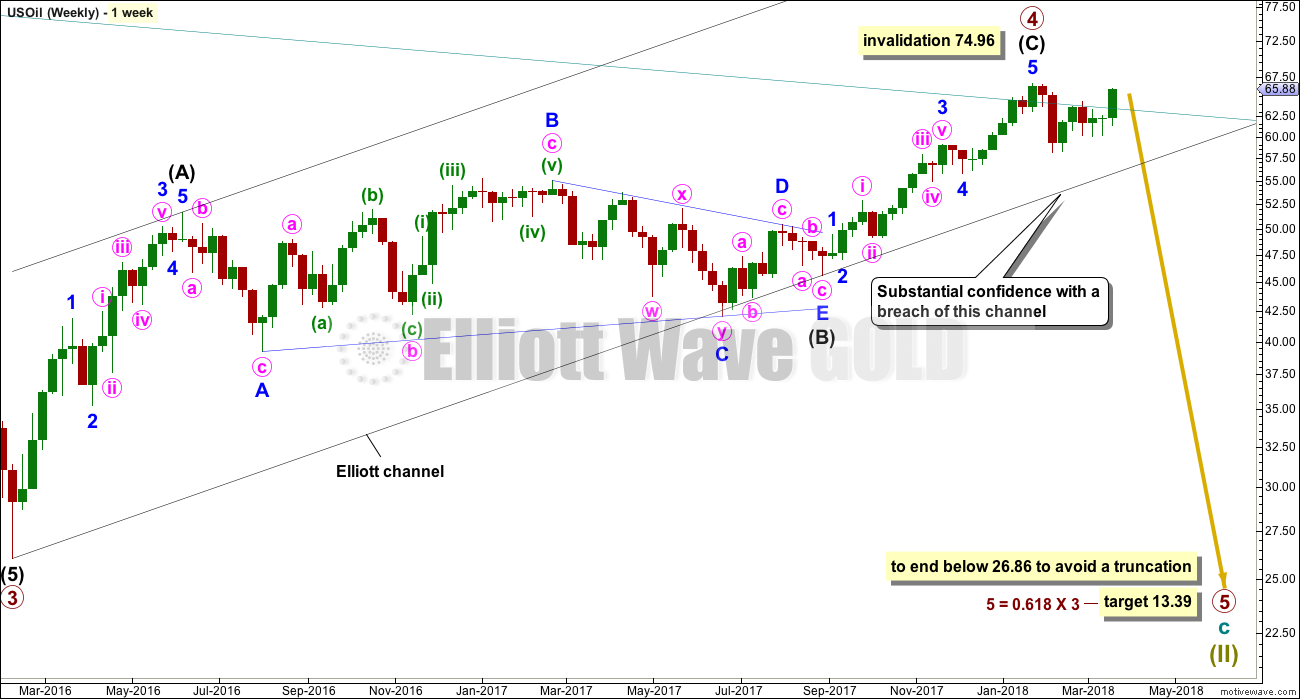
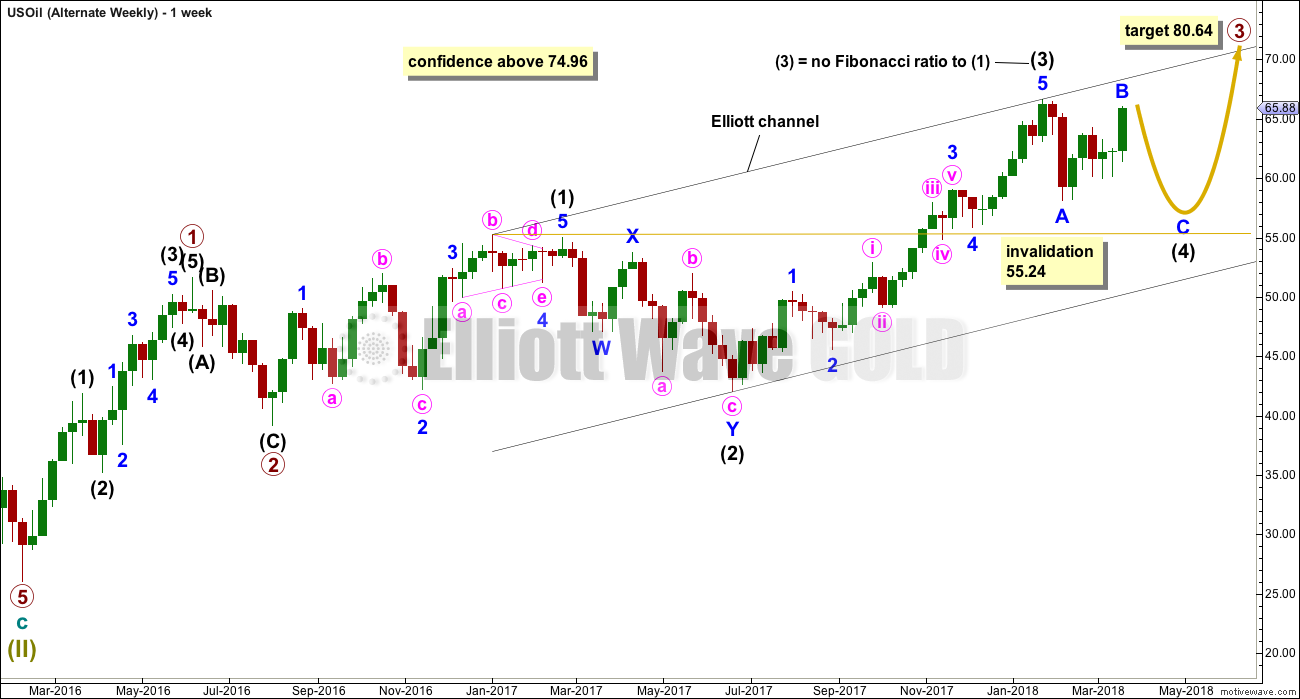
Primary wave 4 subdivides as a zigzag, and within it intermediate wave (C) may now be complete. If primary wave 5 were to only reach equality in length with primary wave 3, it would end with a small truncation. A target for primary wave 5 may best be calculated at intermediate degree. That can only be done when intermediate waves (1) through to (4) within primary wave 5 are complete.
For now a target will be calculated at primary degree using a ratio between primary waves 3 and 5. This target only has a small probability. This target will be recalculated as primary wave 5 nears its end, so it may change.
An Elliott channel is added to this possible zigzag for primary wave 4. A breach of the lower edge of this channel would provide a very strong indication that primary wave 4 should be over and primary wave 5 should be underway. Look out for some support on the way down, perhaps a short term bounce about the lower edge of the channel.
DAILY CHART
Click chart to enlarge.
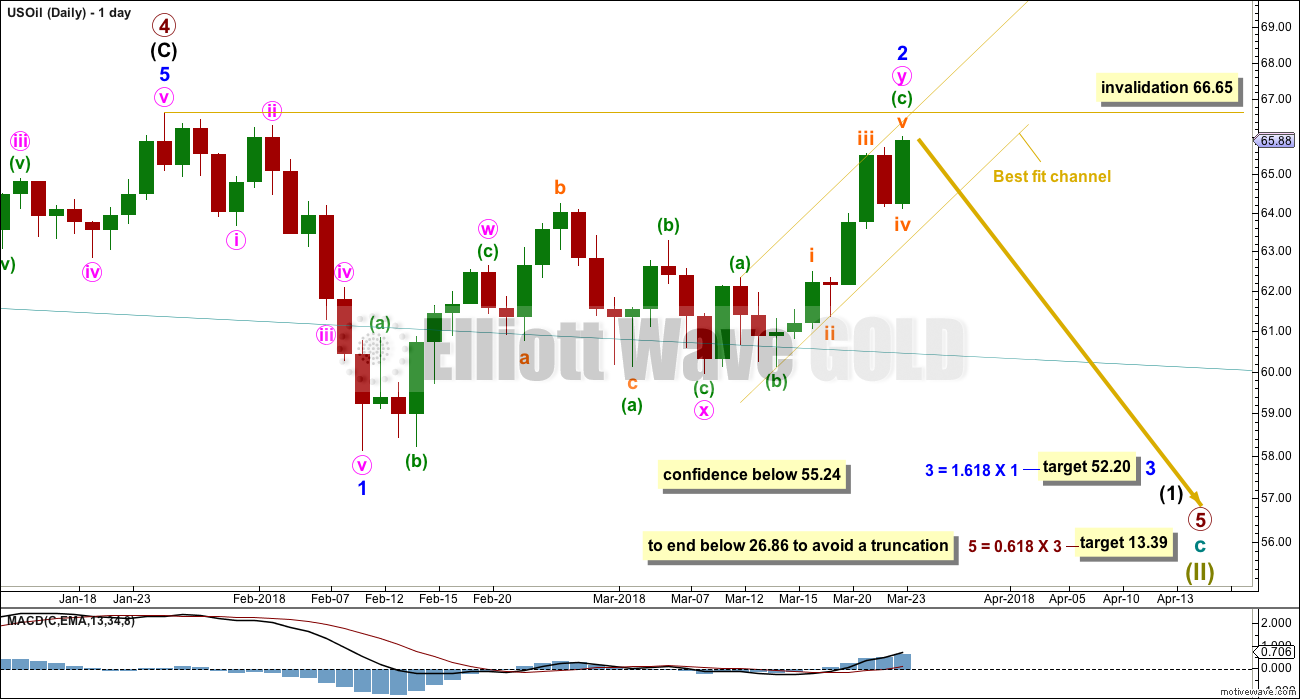
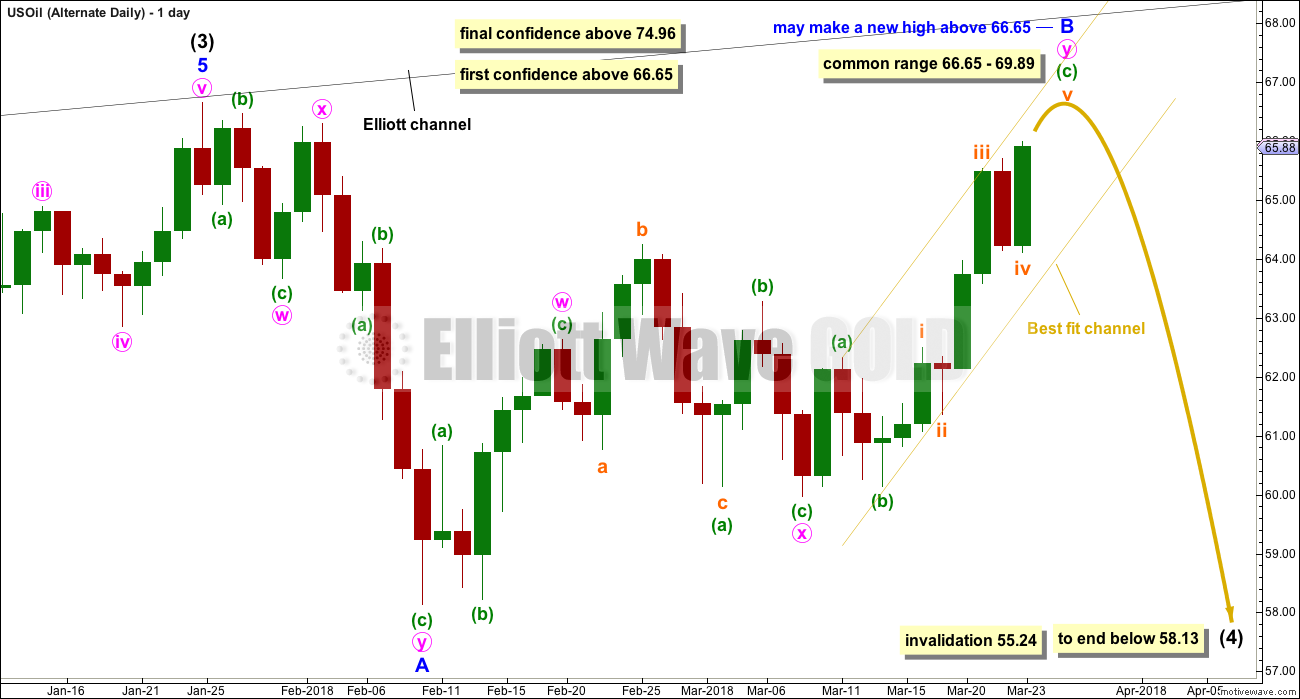
Minor wave 1 will subdivide as a complete impulse at lower time frames.
Minor wave 2 this week is slightly relabelled. It looks like a double zigzag, and this labelling has a better fit. The first structure in the double zigzag is labelled minute wave w. The double is joined by a three in the opposite direction, an expanded flat labelled minute wave x. The second zigzag in the double has deepened the correction achieving its purpose, and it is labelled a zigzag for minute wave y.
There is now almost no room left for this wave count to move into. Minor wave 2 must end here and minor wave 3 downwards must begin early next week if this wave count is correct.
A target is calculated for minor wave 3 which expects the most common Fibonacci ratio to minor wave 1. If price reaches down to this target and the structure is incomplete or price keeps falling through it, then the next Fibonacci ratio in the sequence of 2.618 would be used to calculate a new target.
Minor wave 2 may not move beyond the start of minor wave 1 above 66.65.
A new low below 55.24 would invalidate the bullish alternate below and provide reasonable confidence in this main wave count.
The bottom line for this wave count is that now we should assume an upwards trend is intact while price remains within the best fit channel, and so this wave count may be wrong. A clear breach of the lower edge of the channel by downwards movement is required for confidence in this main wave count this week.
This week’s classic analysis supports the alternate wave count and does not support this main wave count.
ALTERNATE WAVE COUNT
MONTHLY CHART
Click chart to enlarge.
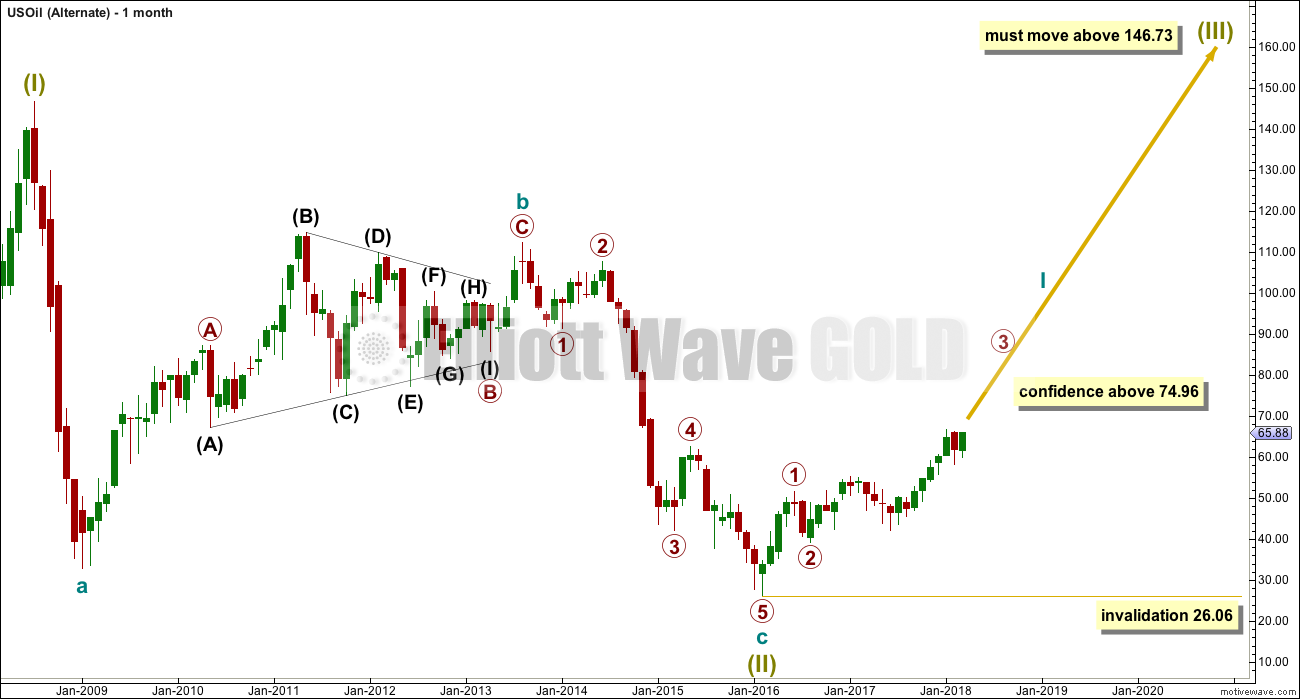
It is possible that the bear market for Oil is over and a new bull market is in the very early stages.
A huge zigzag down to the last low may be complete and is labelled here Super Cycle wave (II).
Cycle wave b must be seen as complete in August 2013 for this wave count to work. It cannot be seen as complete at the prior major swing high in May 2011.
Cycle wave b is seen as a zigzag, and within it primary wave B is seen as a running contracting triangle. These are fairly common structures, although nine wave triangles are uncommon. All subdivisions fit.
Primary wave C moves beyond the end of primary wave A, so it avoids a truncation. But it does not have to move above the price territory of primary wave B to avoid a truncation, which is an important distinction.
If cycle wave b begins there, then cycle wave c may be seen as a complete five wave impulse.
Super Cycle wave (III) must move beyond the end of Super Cycle wave (I). It must move far enough above that point to allow room for a subsequent Super Cycle wave (IV) to unfold and remain above Super Cycle wave (I) price territory.
WEEKLY CHART
Click chart to enlarge.
If a new bull market is in the very early stages for Oil, then it may have begun with two overlapping first and second waves at primary then at intermediate degree.
Primary wave 3 may only subdivide as an impulse, and within it intermediate wave (3) may be complete.
Intermediate wave (4) may not move into intermediate wave (1) price territory below 55.24. Intermediate wave (4) would most likely be incomplete. It may continue further sideways or lower.
Intermediate wave (2) is labelled as a double zigzag. To exhibit alternation intermediate wave (4) may most likely be a flat, combination or triangle. Intermediate wave (2) lasted 17 weeks. For good proportion and the right look, intermediate wave (4) may last a Fibonacci 13 or even 21 weeks in total. So far it has lasted only eight weeks.
DAILY CHART
Click chart to enlarge.
With classic technical analysis this week very bullish, it is time to publish a daily chart for this alternate idea.
It would be unlikely that intermediate wave (4) would be over a the last low labelled minor wave A. That would be too brief.
If intermediate wave (4) is continuing, then it may be as a flat correction. Minor wave B has reached the minimum requirement of 0.9 the length of minor wave A. It may continue higher and may make a new high above the start of minor wave A at 66.65 as in an expanded flat, which is the most common type.
When minor wave B is complete, then minor wave C downwards would be expected to make at least a slight new low below the end of minor wave A at 58.13 to avoid a truncation.
TECHNICAL ANALYSIS
MONTHLY CHART
Click chart to enlarge. Chart courtesy of StockCharts.com.
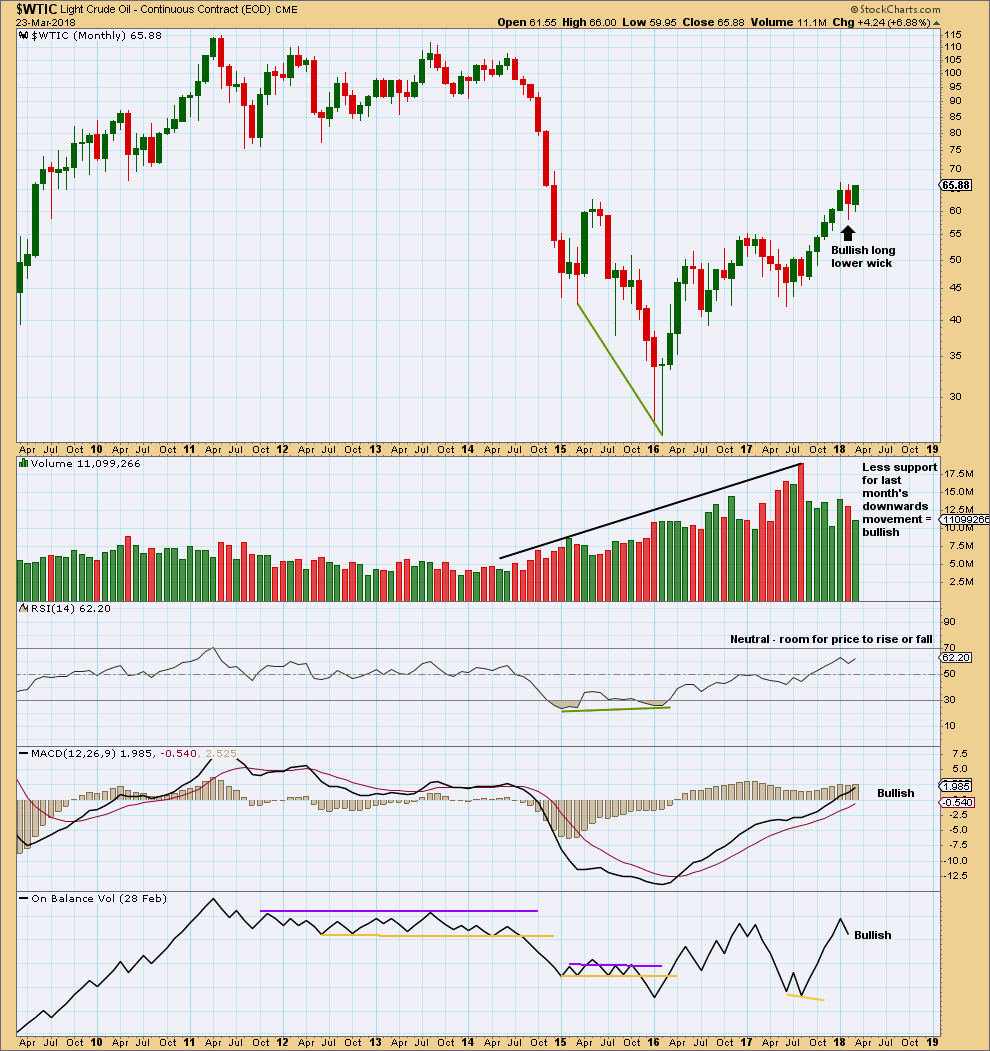
The strongest recent monthly volume is for the downwards month of August 2017. This is bearish.
The rise in price had support from volume for the month of January. Downwards movement did not have support from rising volume for the now completed month of February. This is bullish. MACD and On Balance Volume are also both bullish. Overall, this chart is more bullish than bearish.
RSI indicates there is room for upwards movement to continue.
The month of March is still incomplete, so at this time no conclusions may be drawn.
DAILY CHART
Click chart to enlarge. Chart courtesy of StockCharts.com.
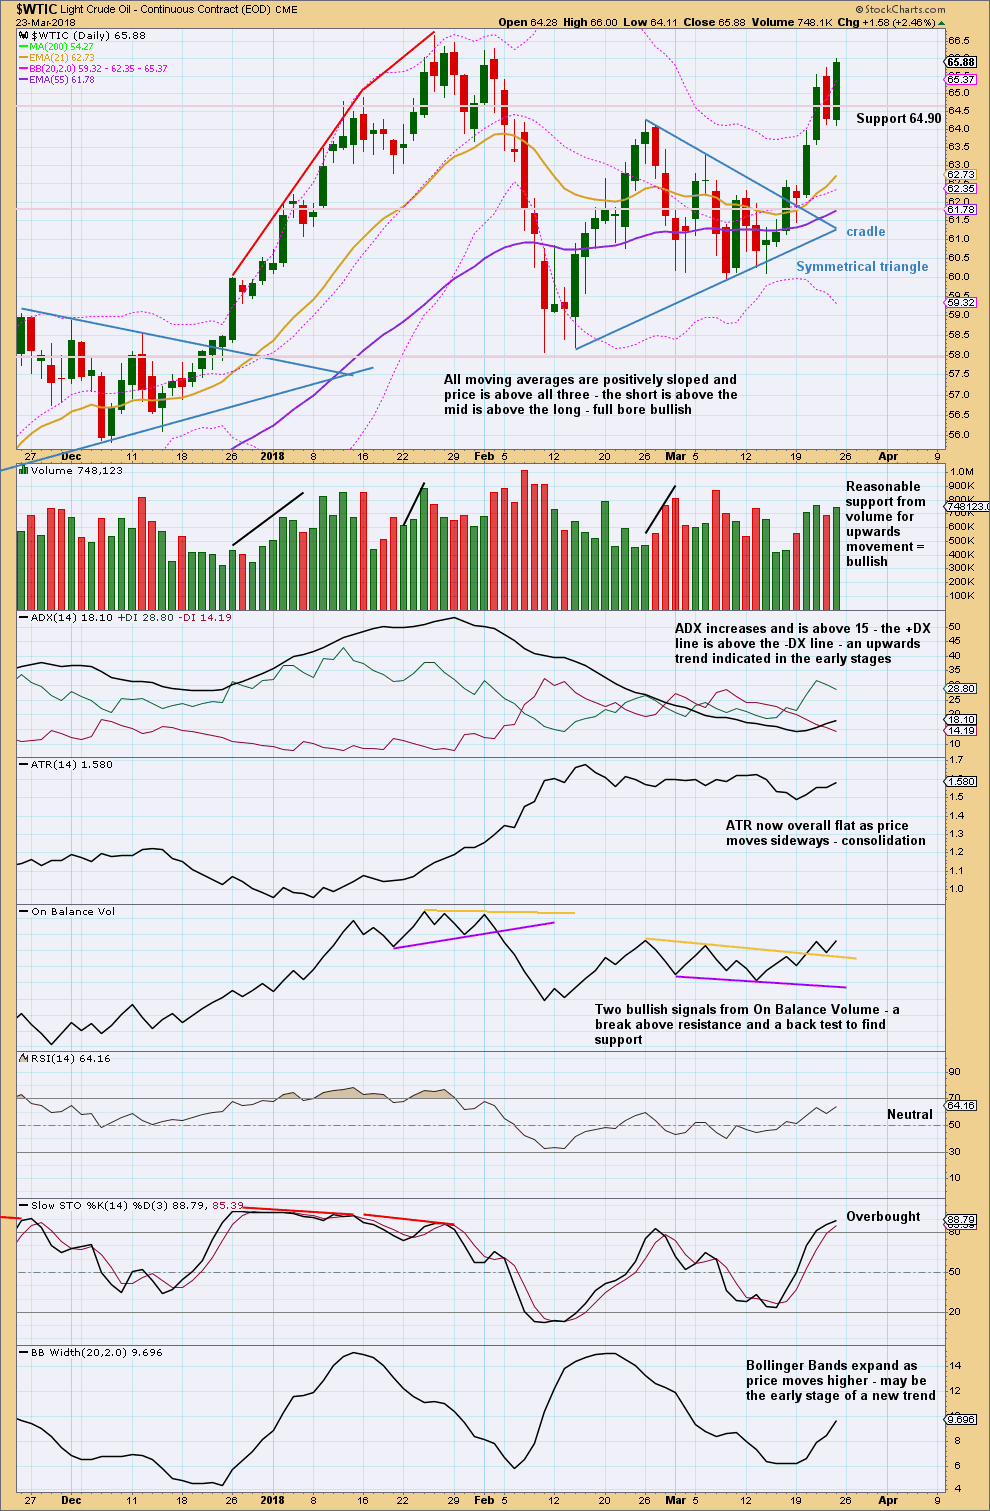
The last two upwards days have reasonable support now from volume, which is bullish. Friday was slightly weaker than Wednesday though.
ADX, On Balance Volume, the short term volume profile, and Bollinger Bands are all bullish. This chart indicates an upwards trend that has a reasonable distance to run yet.
When Oil has a strong upwards trend, Stochastics may remain extremely overbought for a reasonable period of time. Only when it is overbought and then exhibits bearish divergence with price may a sizeable pullback / consolidation or end to the trend be expected. That is not the case here.
This chart strongly supports the alternate wave count.
VOLATILITY INDEX
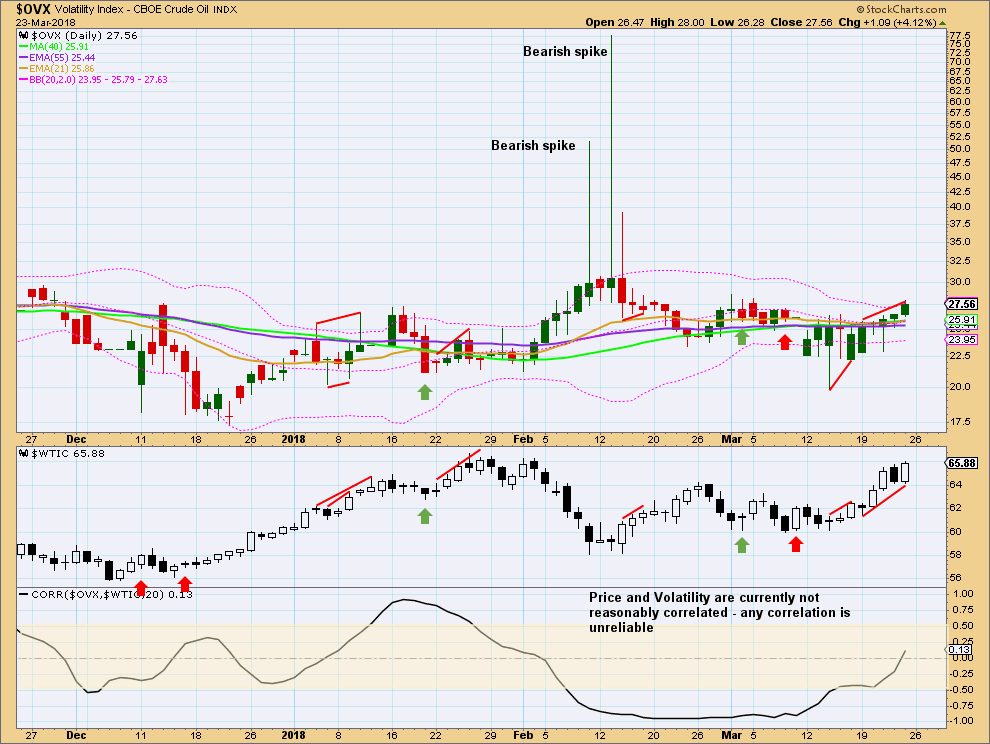
Click chart to enlarge. Chart courtesy of StockCharts.com.
It is generally expected that OVX and Oil price should have a negative correlation. However, the correlation co-efficient proves absolutely that this expectation is not supported by the math. Their correlation is mathematically unreliable. Currently, it is very weakly positive.
This may be discounted as an unreliable relationship, and the math supports this view. Normally, it would be read as bearish divergence, but that interpretation assumes a more reliable correlation than the math shows.
Any two sets of data that have a correlation co-efficient that spends time within the highlighted zone of +0.5 to -0.5 are two sets of data that do not have a reliable correlation. Any correlation that may appear from time to time may be simply due to chance and not because the two sets of data have a relationship in any way.
Published @ 11:28 p.m. EST on 24th March, 2018.