
A new high above 66.65 has substantially reduced the probability of the main Elliott wave count and increased the probability of the alternate. This week the two wave counts should be swapped over.
Summary: The probability that Oil is in a huge new bull market looks much higher this week. This main wave count still expects a pullback to end just below 58.13, but not below 55.24, for the short term though. Thereafter, a strong bull run may begin. A bull market for Oil has strong support from classic technical analysis at the monthly chart level.
Upwards movement of the last two days is looking weak; volume and range are sharply declining. This favours the idea of a pullback about here.
Always practice good risk management as the most important aspect of trading. Always trade with stops and invest only 1-5% of equity on any one trade. Failure to manage risk is the most common mistake new traders make.
New updates to this analysis are in bold.
MAIN WAVE COUNT
MONTHLY CHART
Click chart to enlarge.
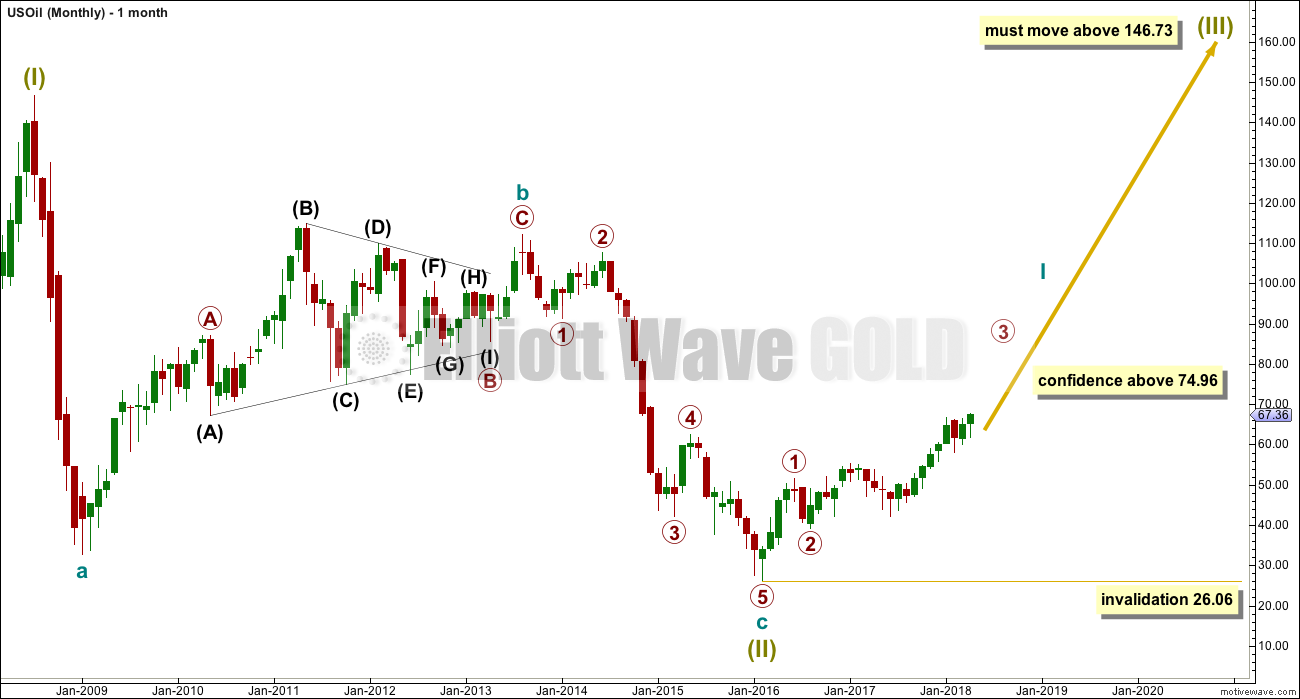
It is possible that the bear market for Oil is over and a new bull market is in the very early stages.
A huge zigzag down to the last low may be complete and is labelled here Super Cycle wave (II).
Cycle wave b must be seen as complete in August 2013 for this wave count to work. It cannot be seen as complete at the prior major swing high in May 2011.
Cycle wave b is seen as a zigzag, and within it primary wave B is seen as a running contracting triangle. These are fairly common structures, although nine wave triangles are uncommon. All subdivisions fit.
Primary wave C moves beyond the end of primary wave A, so it avoids a truncation. But it does not have to move above the price territory of primary wave B to avoid a truncation, which is an important distinction.
If cycle wave b begins there, then cycle wave c may be seen as a complete five wave impulse.
Super Cycle wave (III) must move beyond the end of Super Cycle wave (I). It must move far enough above that point to allow room for a subsequent Super Cycle wave (IV) to unfold and remain above Super Cycle wave (I) price territory.
Cycle wave I may be incomplete. It may be ready to move through the middle and end of its third wave at primary degree, which may be the strongest upwards portion of cycle wave I; a strong increase in momentum and range may be ahead.
When cycle wave I is complete, then cycle wave II may be a deep correction that may not move beyond the start of cycle wave I below 26.06.
Data from FXCM for USOil does not go back to the beginning of Super Cycle wave (I). Without an accurate known length of Super Cycle wave (I) a target cannot be calculated for Super Cycle wave (III) to end using Fibonacci ratios. The target for Super Cycle wave (III) may be calculated when cycle waves I, II, III and IV within it are complete. That cannot be done for many years.
WEEKLY CHART
Click chart to enlarge.
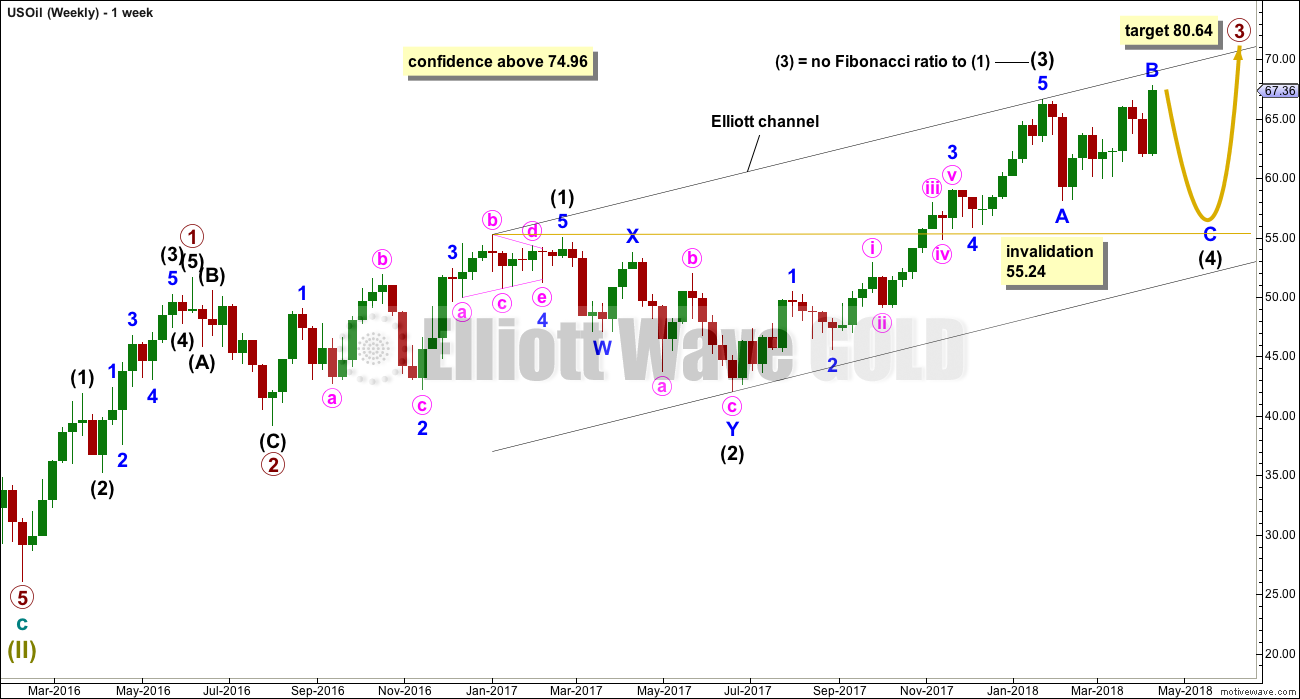
If a new bull market is in the very early stages for Oil, then it may have begun with two overlapping first and second waves at primary then at intermediate degree.
Primary wave 3 may only subdivide as an impulse, and within it intermediate wave (3) may be complete.
Intermediate wave (4) may not move into intermediate wave (1) price territory below 55.24. Intermediate wave (4) would most likely be incomplete. It may continue further sideways or lower.
Intermediate wave (2) is labelled as a double zigzag. To exhibit alternation intermediate wave (4) may most likely be a flat, combination or triangle. Intermediate wave (2) lasted 17 weeks. For good proportion and the right look, intermediate wave (4) may last a Fibonacci 13 or even 21 weeks in total. So far it has lasted only 11 weeks.
Commodities typically exhibit swift and strong fifth waves within their impulses, and this tendency is particularly common for third wave impulses. Intermediate wave (5) may be a swift strong upwards wave when it arrives.
DAILY CHART
Click chart to enlarge.
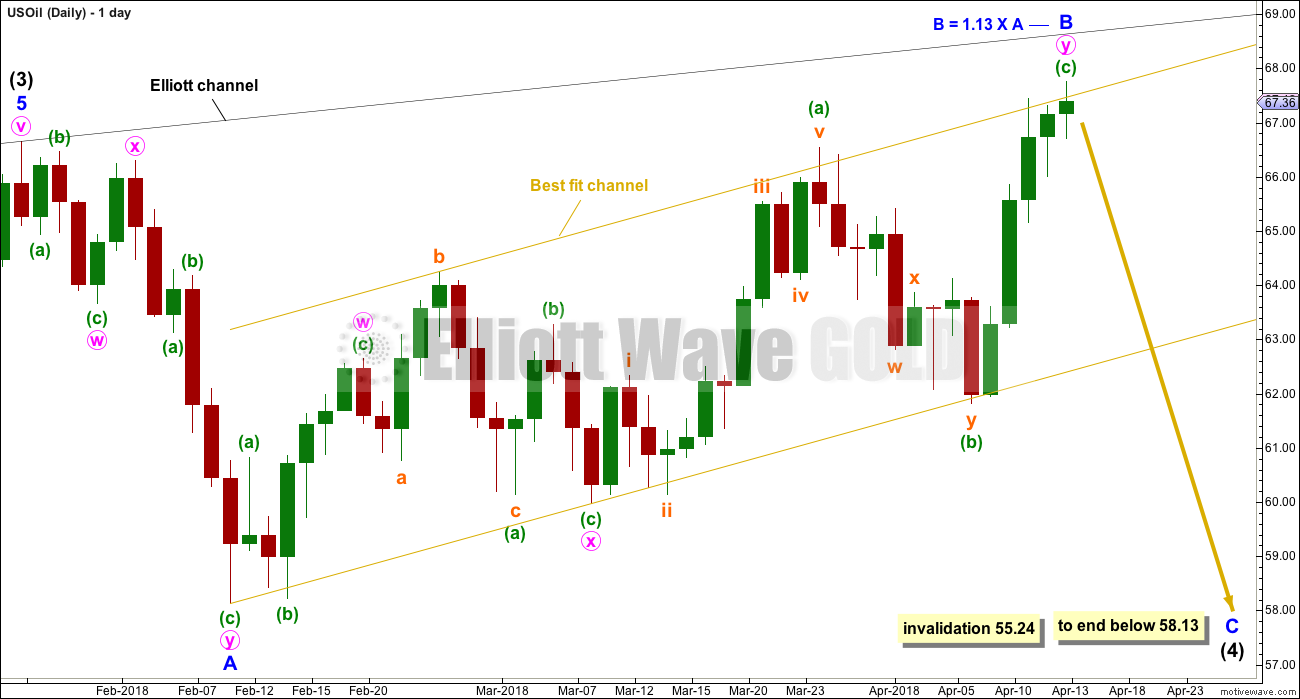
It would be unlikely that intermediate wave (4) would be over a the last low labelled minor wave A. That would be too brief.
If intermediate wave (4) is continuing, then it may be as a flat correction. If minor wave B is now over at 1.13 the length of minor wave A, then intermediate wave (4) may be an expanded flat correction. Expanded flats do not fit well into trend channels.
Minor wave B now fits neatly into a best fit channel at this stage, and it may be ending about resistance at the upper edge of this channel.
Minor wave C downwards must be a five wave structure. It would be extremely likely to move at least slightly below the end of minor wave A at 58.13 to avoid a truncation and a very rare running flat.
ALTERNATE WAVE COUNT
MONTHLY CHART
Click chart to enlarge.
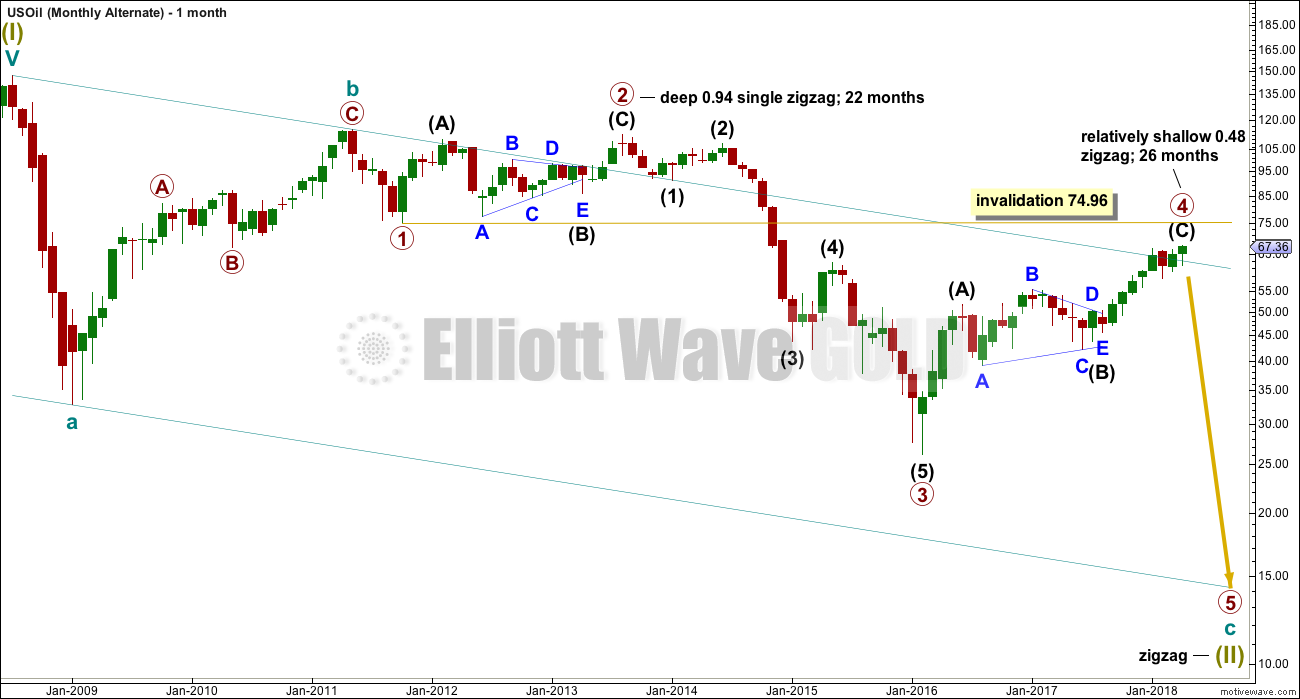
Within the bear market, cycle wave b is seen as ending in May 2011. Thereafter, a five wave structure downwards for cycle wave c begins.
Primary wave 1 is a short impulse lasting five months. Primary wave 2 is a very deep 0.94 zigzag lasting 22 months. Primary wave 3 is a complete impulse with no Fibonacci ratio to primary wave 1. It lasted 30 months.
There is alternation in depth with primary wave 2 very deep and primary wave 4 relatively shallow. There is inadequate alternation in structure, both are zigzags. So far primary wave 4 has lasted 26 months. At this stage, there is still reasonable proportion between primary waves 2 and 4.
Primary wave 4 may not move into primary wave 1 price territory above 74.96.
The wider Elliott channel (teal) about this whole movement may offer support to primary wave 5.
WEEKLY CHART
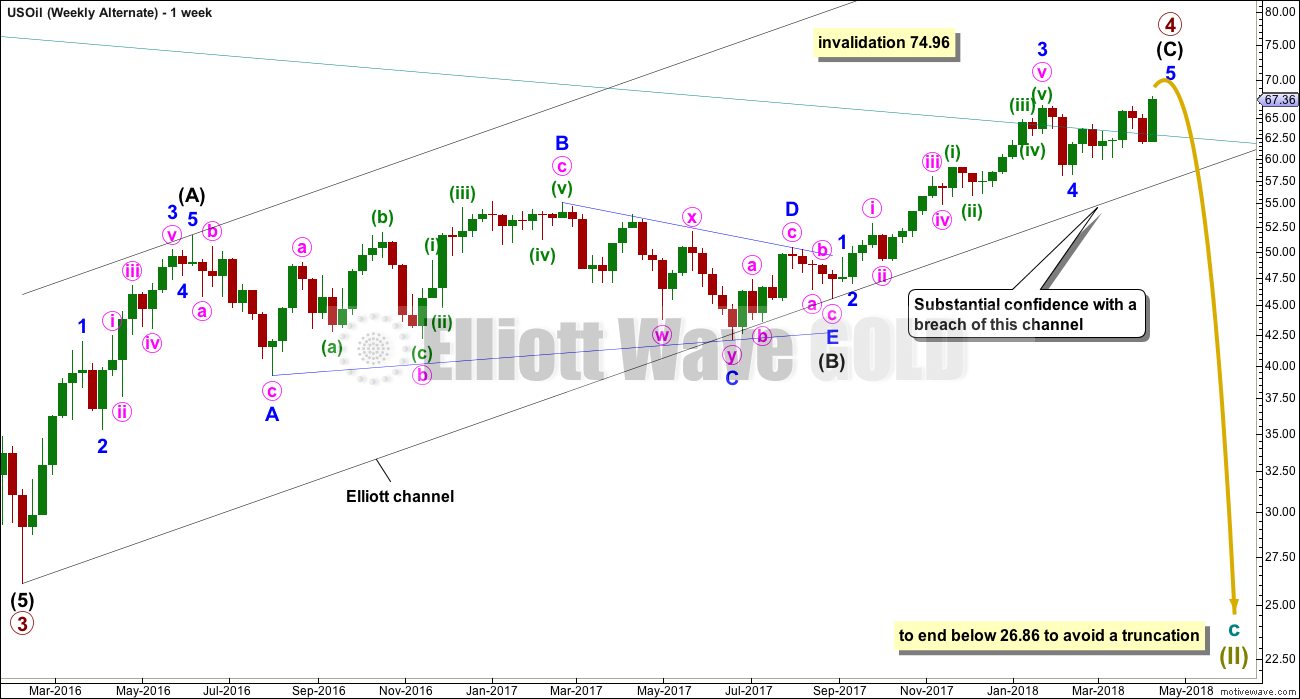
Click chart to enlarge.
The structure of primary wave 4 up until this week looked like a possibly completed zigzag with good proportion between minor waves 2 and 4 within the last wave up of intermediate wave (C).
Some upwards movement is required at this time for this more bearish wave count to complete minor wave 5. Thereafter, a huge trend change would be expected for a new wave down for primary wave 5, which may last about a year or so. Primary wave 5 would be likely to make at least a slight new low below 26.86 to move below the end of primary wave 3 and avoid a truncation.
An Elliott channel is added to this possible zigzag for primary wave 4. A breach of the lower edge of this channel would provide a very strong indication that primary wave 4 should be over and primary wave 5 should be underway. Look out for some support on the way down, perhaps a short term bounce about the lower edge of the channel.
DAILY CHART
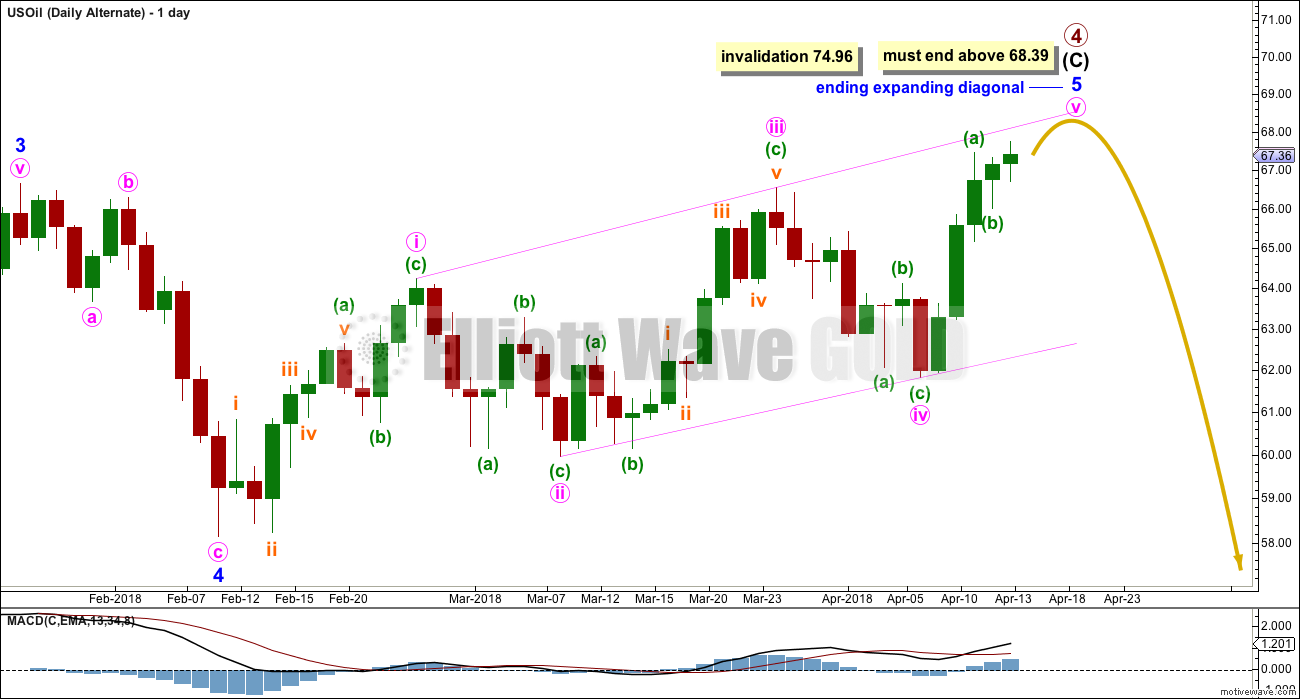
Click chart to enlarge.
Minor wave 5 will fit so far as a possible ending expanding diagonal. The trend lines slightly diverge. Within the diagonal, minute wave iii is longer than minute wave i and minute wave iv is longer than minute wave ii. Minute wave v must be longer than minute wave iii. Minute wave v would reach equality with minute wave iii at 68.39, so as soon as price makes a new high above this point the diagonal may be complete and all Elliott wave rules would be met.
Within an ending diagonal, all sub-waves must subdivide as zigzags and the fourth wave must overlap first wave price territory. Rules for diagonals are different to rules for impulses.
If price continues slightly higher and makes a new high above 68.39 by any amount at any time frame, and then turns around strongly, then this wave count would remain valid and entirely possible.
This wave cound does not at this point have support from classic technical analysis on the monthly chart.
TECHNICAL ANALYSIS
MONTHLY CHART
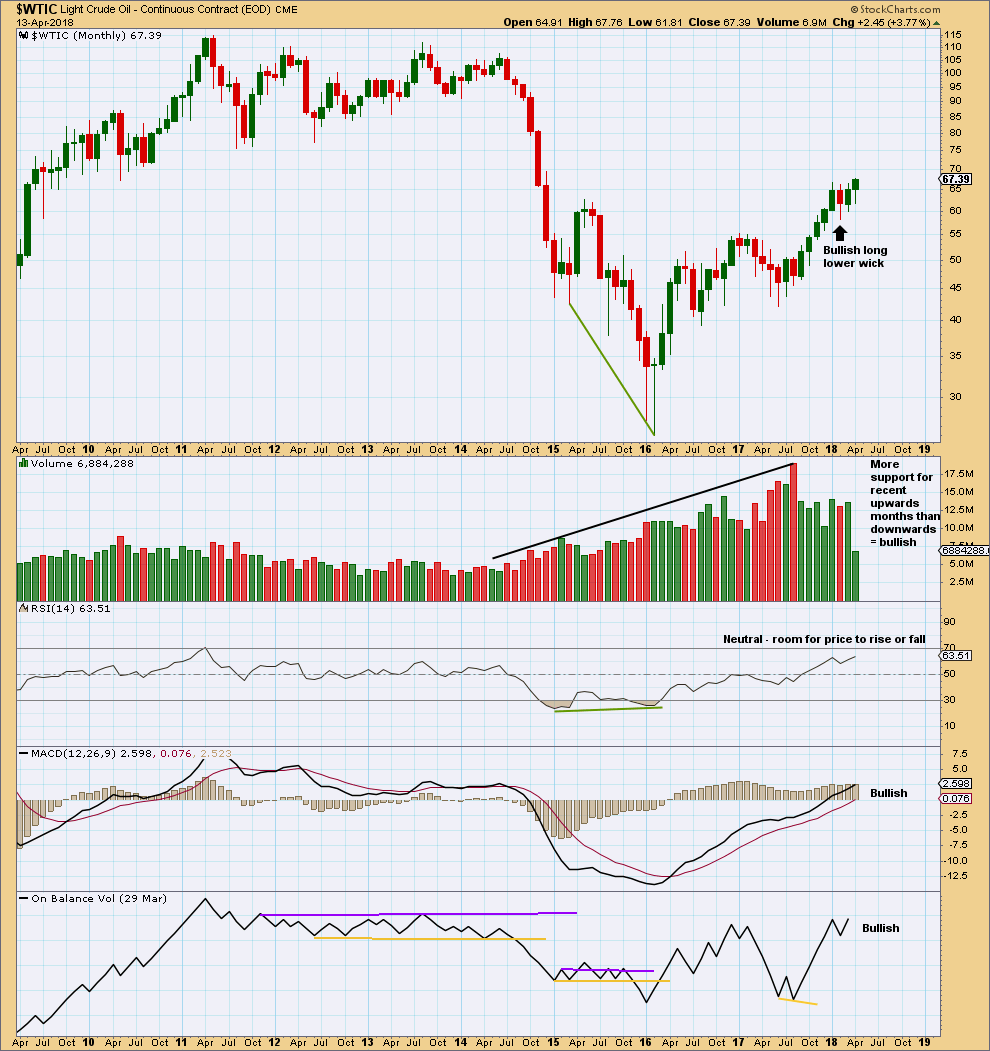
Click chart to enlarge. Chart courtesy of StockCharts.com.
The strongest recent monthly volume is for the downwards month of August 2017. This is bearish.
For the last three months all now complete, the volume profile is bullish.
This chart is overwhelmingly bullish. It supports the new main Elliott wave count.
Strong volume for the month of June 2017 may have been a selling climax. This is typical behaviour of commodities.
DAILY CHART
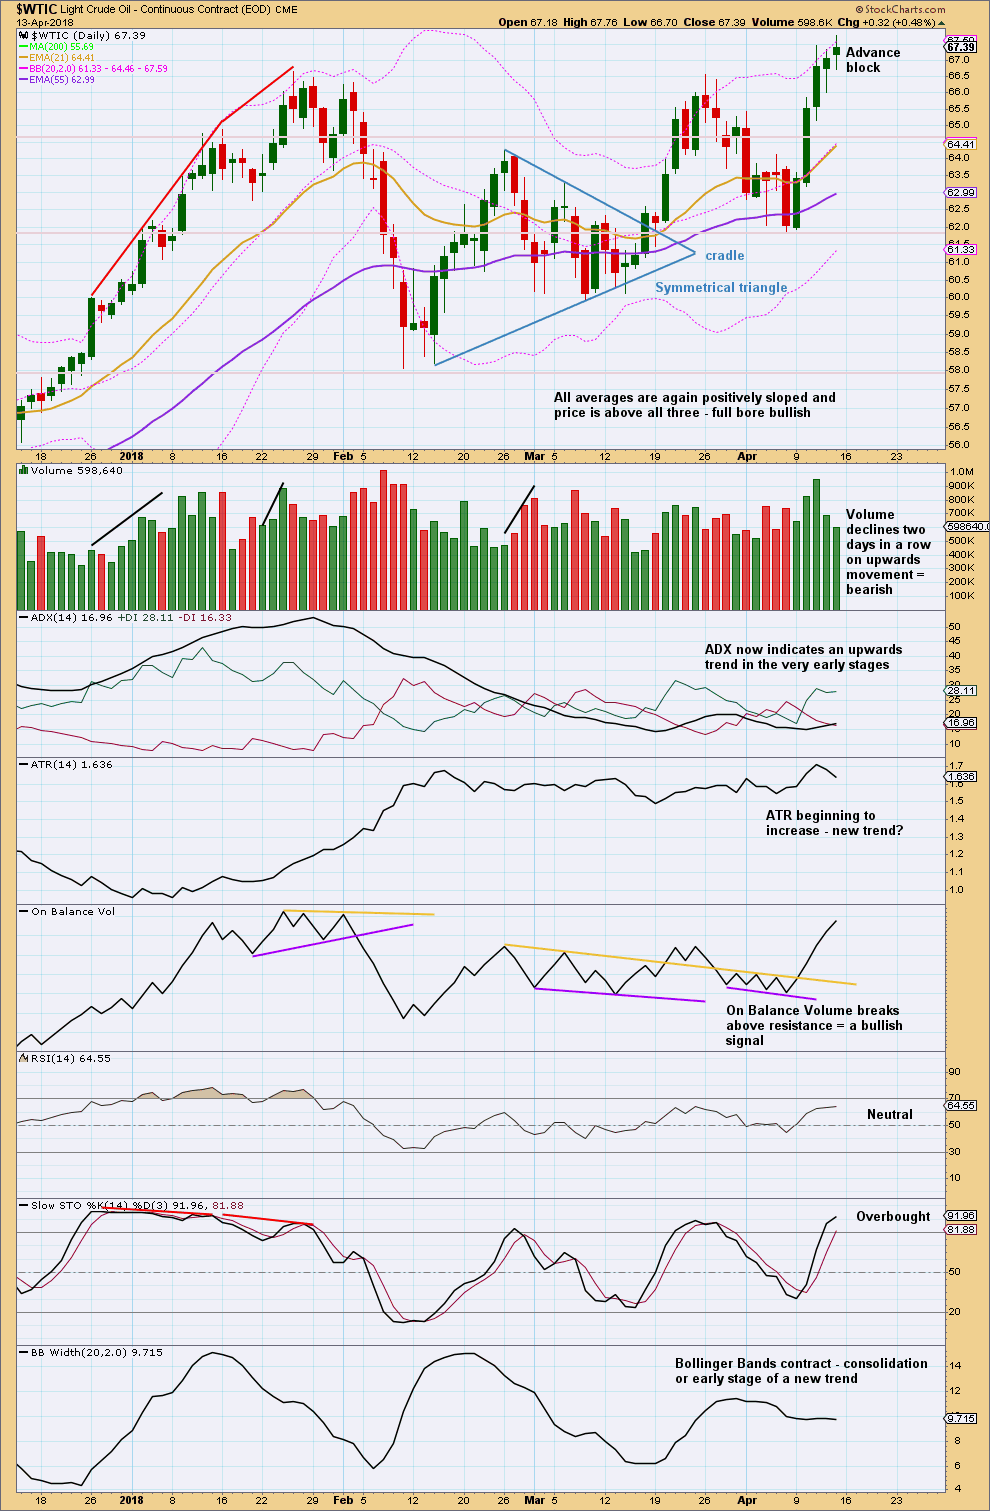
Click chart to enlarge. Chart courtesy of StockCharts.com.
On Balance Volume provided a bullish signal on the 10th of April. This signal is strong.
This is now a somewhat mature upwards trend. The advance block pattern indicates signs of weakening. From Nison, page 99: “…the rally is running into trouble and longs should protect themselves. Be especially cautions about this pattern during a mature uptrend. Signs of weakening could be progressively smaller white real bodies, or relatively long upper shadows.”
In conjunction with strongly declining volume and overbought Stochastics, it looks reasonable to expect a pullback about here. This favours the new wave count for short to mid term expectations.
Published @ 04:56 a.m. EST on 14th April, 2018.