
Upwards movement continues as the second Elliott wave count expected.
Summary: Classic technical analysis remains overly bullish. There is an upwards trend in place. Pullbacks are an opportunity to join the trend.
The mid term target is now at 97.92. A longer term target is at 106.25.
Always practice good risk management as the most important aspect of trading. Always trade with stops and invest only 1-5% of equity on any one trade. Failure to manage risk is the most common mistake new traders make.
New updates to this analysis are in bold.
MAIN WAVE COUNT
MONTHLY CHART
Click chart to enlarge.
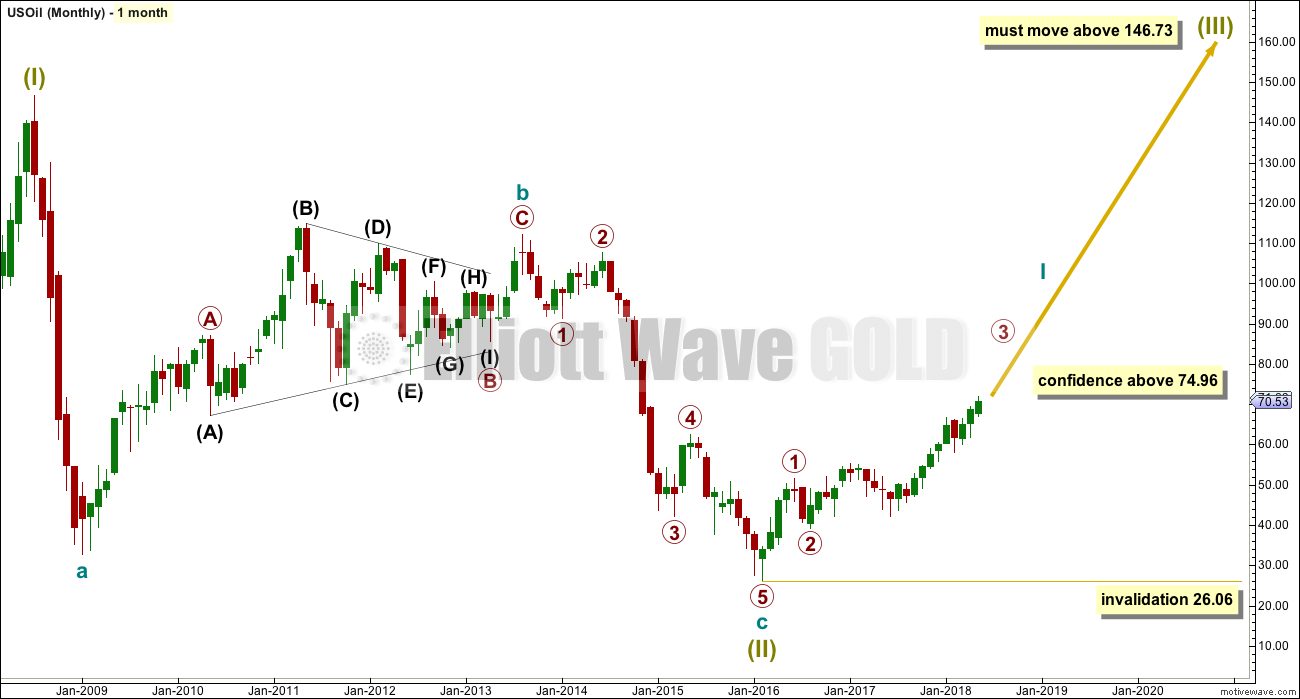
It is possible that the bear market for Oil is over and a new bull market is in the very early stages.
A huge zigzag down to the last low may be complete and is labelled here Super Cycle wave (II).
Cycle wave b must be seen as complete in August 2013 for this wave count to work. It cannot be seen as complete at the prior major swing high in May 2011.
Cycle wave b is seen as a zigzag, and within it primary wave B is seen as a running contracting triangle. These are fairly common structures, although nine wave triangles are uncommon. All subdivisions fit.
Primary wave C moves beyond the end of primary wave A, so it avoids a truncation. But it does not have to move above the price territory of primary wave B to avoid a truncation, which is an important distinction.
If cycle wave b begins there, then cycle wave c may be seen as a complete five wave impulse.
Super Cycle wave (III) must move beyond the end of Super Cycle wave (I). It must move far enough above that point to allow room for a subsequent Super Cycle wave (IV) to unfold and remain above Super Cycle wave (I) price territory.
Cycle wave I may be incomplete. It may be ready to move through the middle and end of its third wave at primary degree, which may be the strongest upwards portion of cycle wave I; a strong increase in momentum and range may be ahead.
When cycle wave I is complete, then cycle wave II may be a deep correction that may not move beyond the start of cycle wave I below 26.06.
Data from FXCM for USOil does not go back to the beginning of Super Cycle wave (I). Without an accurate known length of Super Cycle wave (I) a target cannot be calculated for Super Cycle wave (III) to end using Fibonacci ratios. The target for Super Cycle wave (III) may be calculated when cycle waves I, II, III and IV within it are complete. That cannot be done for many years.
WEEKLY CHART
Click chart to enlarge.
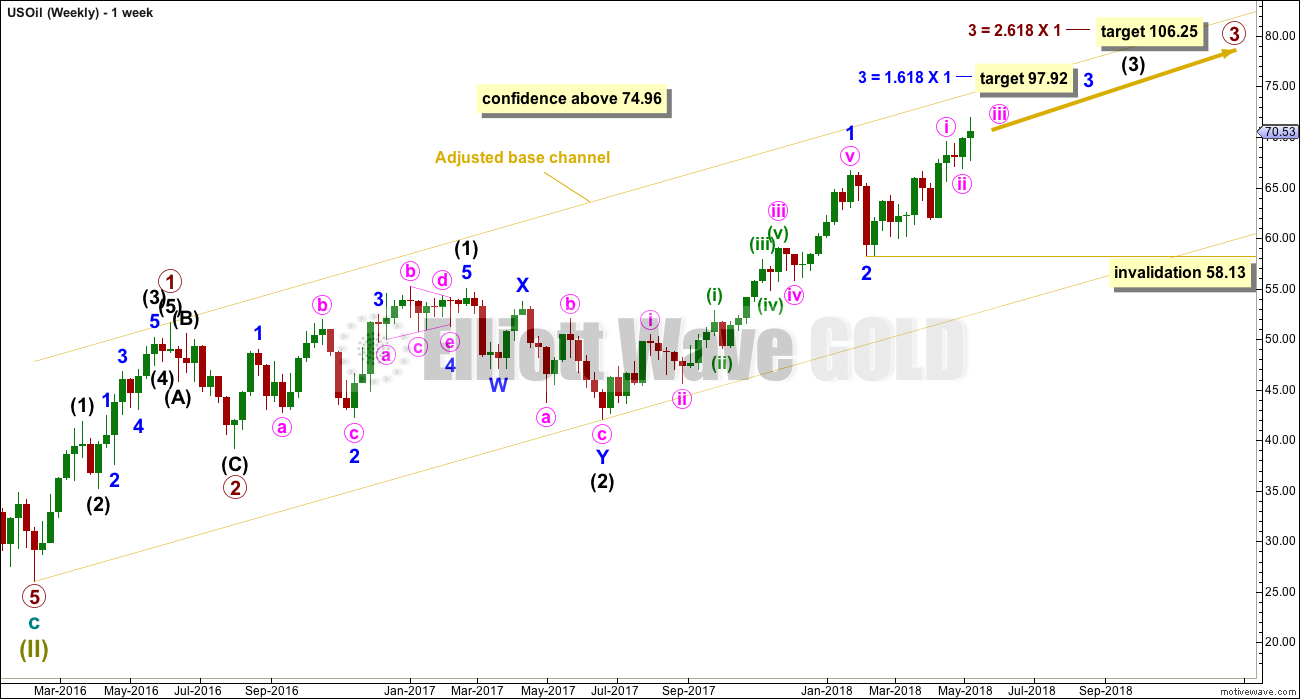
If a new bull market is in the very early stages for Oil, then it may have begun with two overlapping first and second waves at primary then at intermediate degree.
Primary wave 3 may only subdivide as an impulse, and within it intermediate wave (3) may be complete.
Within intermediate wave (3), only minor waves 1 and 2 may be complete. Minor wave 3 may have just begun. The most common Fibonacci ratio is used to calculate a target for it to end. Minor wave 3 may only subdivide as an impulse, and within it minute wave ii may not move beyond the start of minute wave i below 58.13.
A new target is calculated for primary wave 3 to end, which fits with the earlier target for minor wave 3 to end.
Commodities typically exhibit swift and strong fifth waves within their impulses, and this tendency is particularly common for third wave impulses. Intermediate wave (5) may be a swift strong upwards wave when it arrives.
DAILY CHART
Click chart to enlarge.
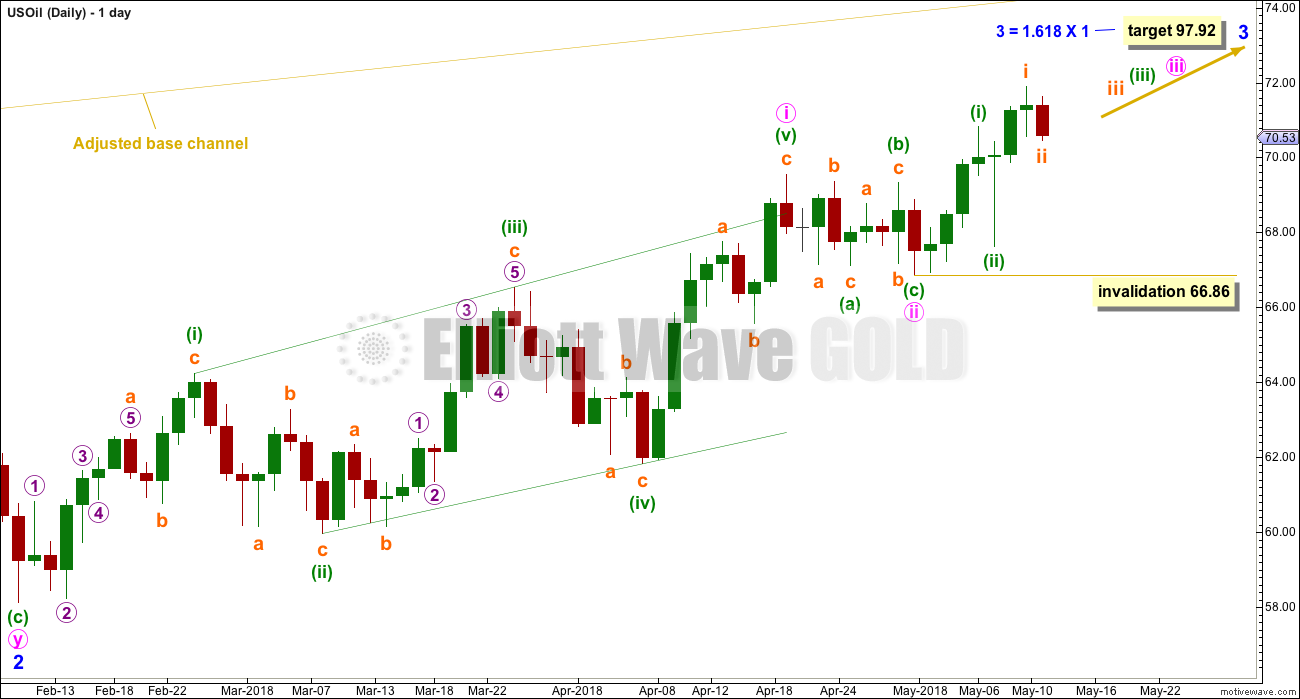
Minor wave 3 may have begun with a leading expanding diagonal for minute wave i.
It is possible that minute wave ii may be over as a relatively brief and shallow regular flat correction.
Although it would be unusual for a second wave correction following a first wave leading diagonal to be this shallow, continuing upwards movement shows that this wave count is now more likely correct.
This wave count would now expect explosive upwards movement.
Within minute wave iii, no second wave correction may move beyond its start below 66.86.
DAILY CHART II
Click chart to enlarge.
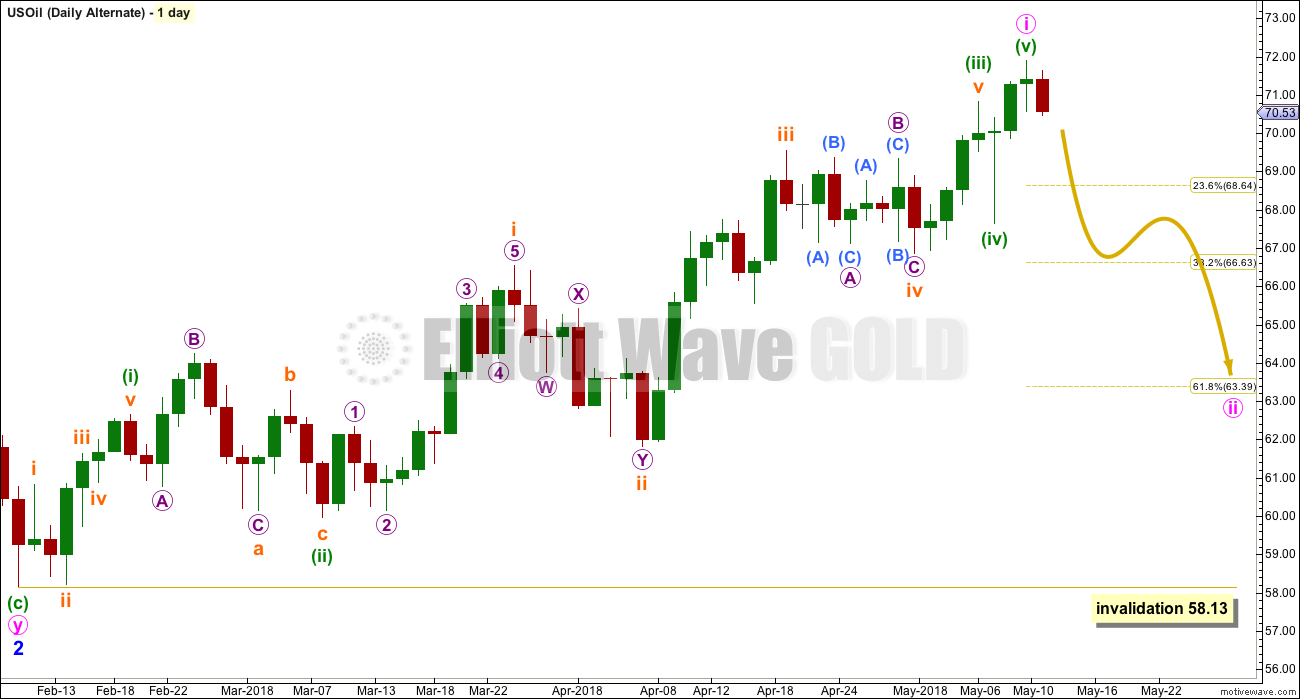
It is now possible to see another impulse complete at the last high. This may be minute wave i.
If price makes a new low below 66.86, then a deeper pullback may have begun. The target would be the 0.618 Fibonacci ratio at 63.39.
The only problem with this wave count is subminuette wave iii because this wave looks like a three and not a five.
This wave count does not have good support from classic technical analysis, so it is judged to have a lower probability.
ALTERNATE WAVE COUNT
MONTHLY CHART
Click chart to enlarge.
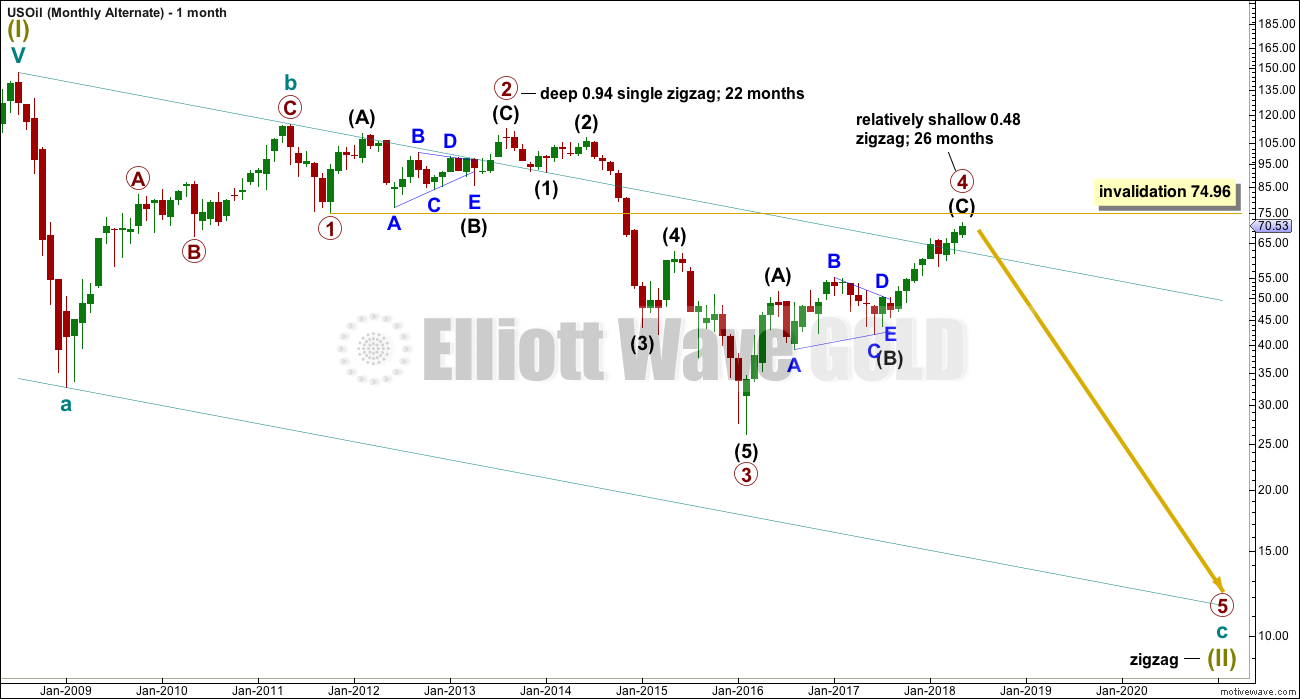
Within the bear market, cycle wave b is seen as ending in May 2011. Thereafter, a five wave structure downwards for cycle wave c begins.
Primary wave 1 is a short impulse lasting five months. Primary wave 2 is a very deep 0.94 zigzag lasting 22 months. Primary wave 3 is a complete impulse with no Fibonacci ratio to primary wave 1. It lasted 30 months.
There is alternation in depth with primary wave 2 very deep and primary wave 4 relatively shallow. There is inadequate alternation in structure, both are zigzags. So far primary wave 4 has lasted 26 months. At this stage, there isstill reasonable proportion between primary waves 2 and 4.
Primary wave 4 may not move into primary wave 1 price territory above 74.96.
The wider Elliott channel (teal) about this whole movement may offer support to primary wave 5.
WEEKLY CHART
Click chart to enlarge.
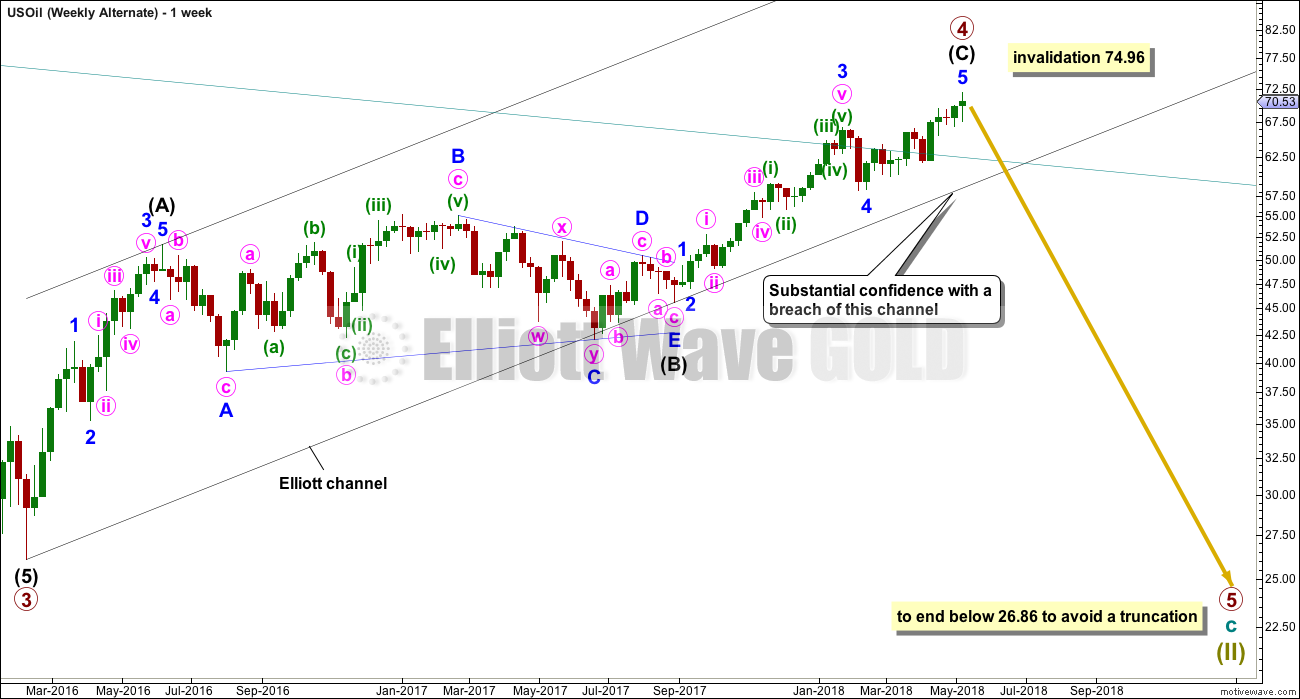
This wave count now expects a huge trend change for a new wave down for primary wave 5, which may last about a year or so. Primary wave 5 would be likely to make at least a slight new low below 26.86 to move below the end of primary wave 3 and avoid a truncation.
An Elliott channel is added to this possible zigzag for primary wave 4. A breach of the lower edge of this channel would provide a very strong indication that primary wave 4 should be over and primary wave 5 should be underway. Look out for some support on the way down, perhaps a short term bounce about the lower edge of the channel.
DAILY CHART
Click chart to enlarge.
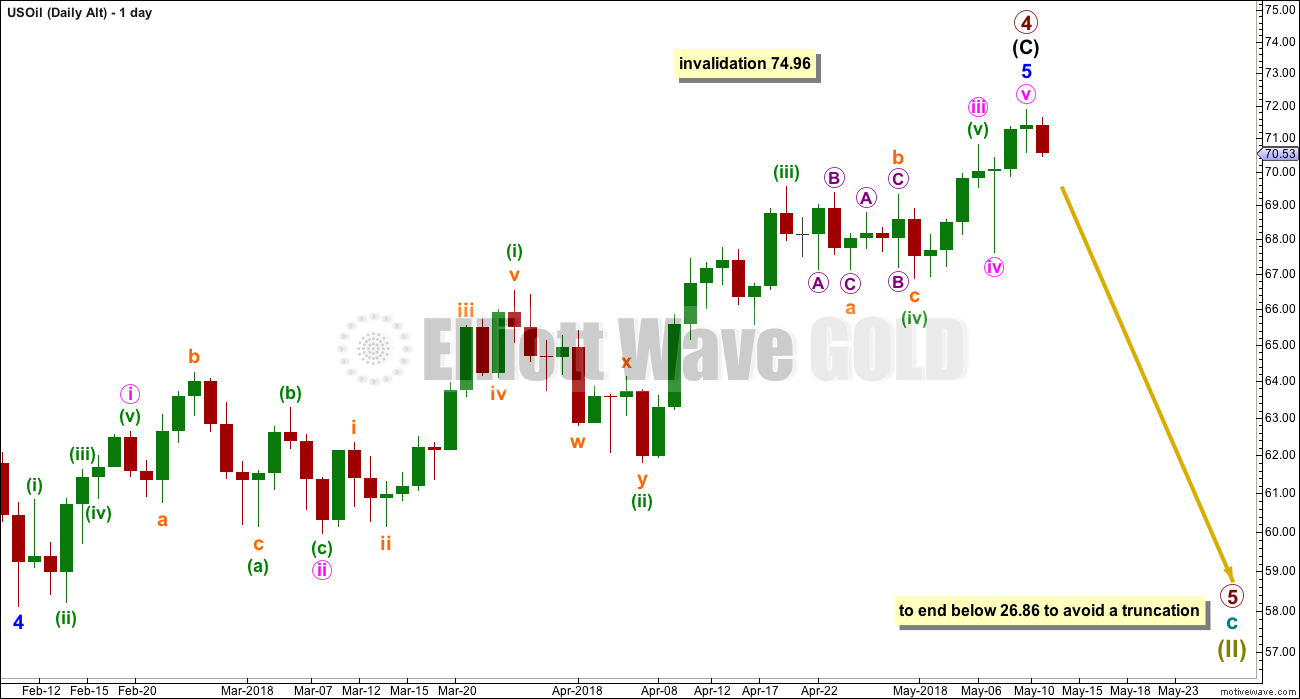
Minor wave 5 will now subdivide as an impulse. The only piece of movement that is problematic is minuette wave (iii) because it looks like a three but should be a five.
There is almost no room left for primary wave 4 to move into. If this alternate wave count is correct, then price must reverse here or very soon indeed.
A new low below 58.13 would add a little confidence to this wave count. It would also require a breach of the black channel on the weekly chart for reasonable confidence.
TECHNICAL ANALYSIS
MONTHLY CHART
Click chart to enlarge. Chart courtesy of StockCharts.com.
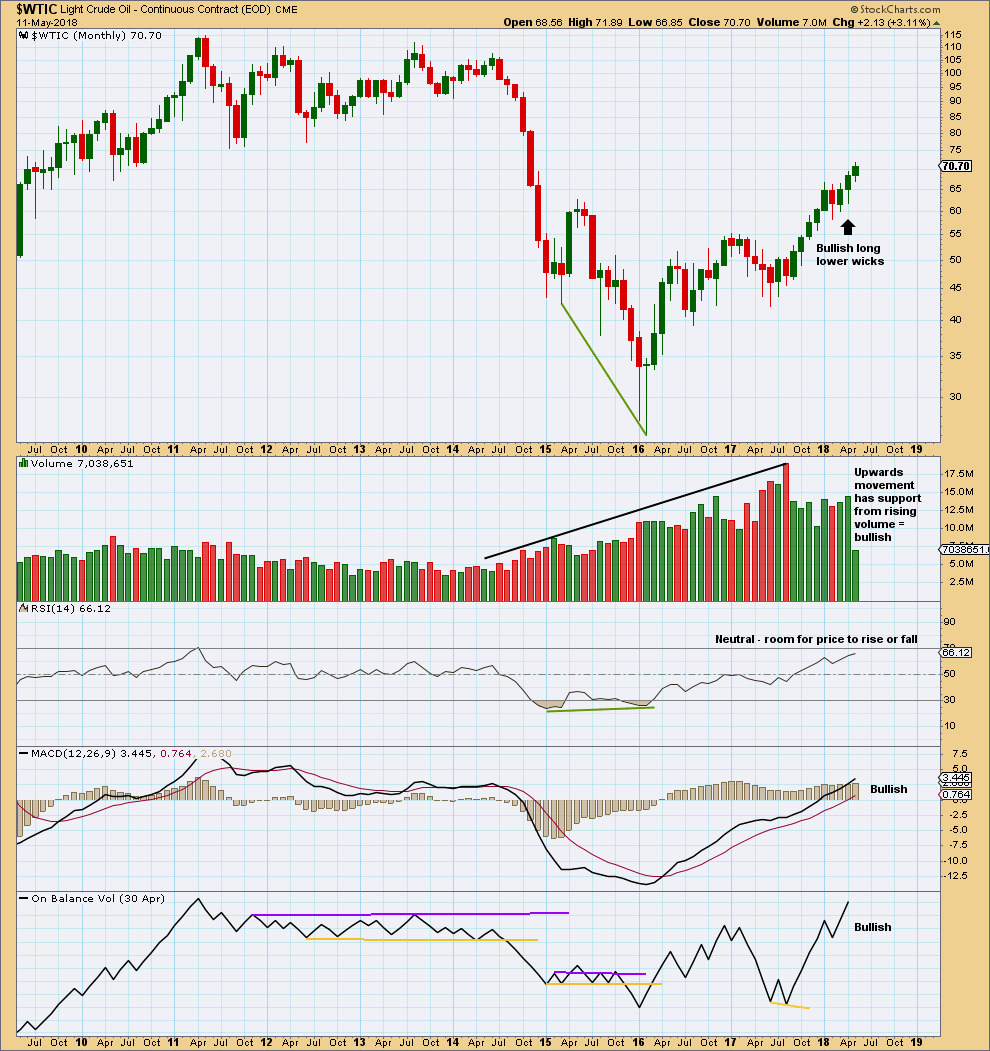
For the last four months all now complete, the volume profile is bullish. There are now three completed monthly candlesticks with long lower wicks.
This chart is overwhelmingly bullish. It supports the main Elliott wave count.
Strong volume for the month of June 2017 may have been a selling climax. This is typical behaviour of commodities.
The strongest recent volume is a downwards month for August 2017. This is the only bearish indication on this chart.
DAILY CHART
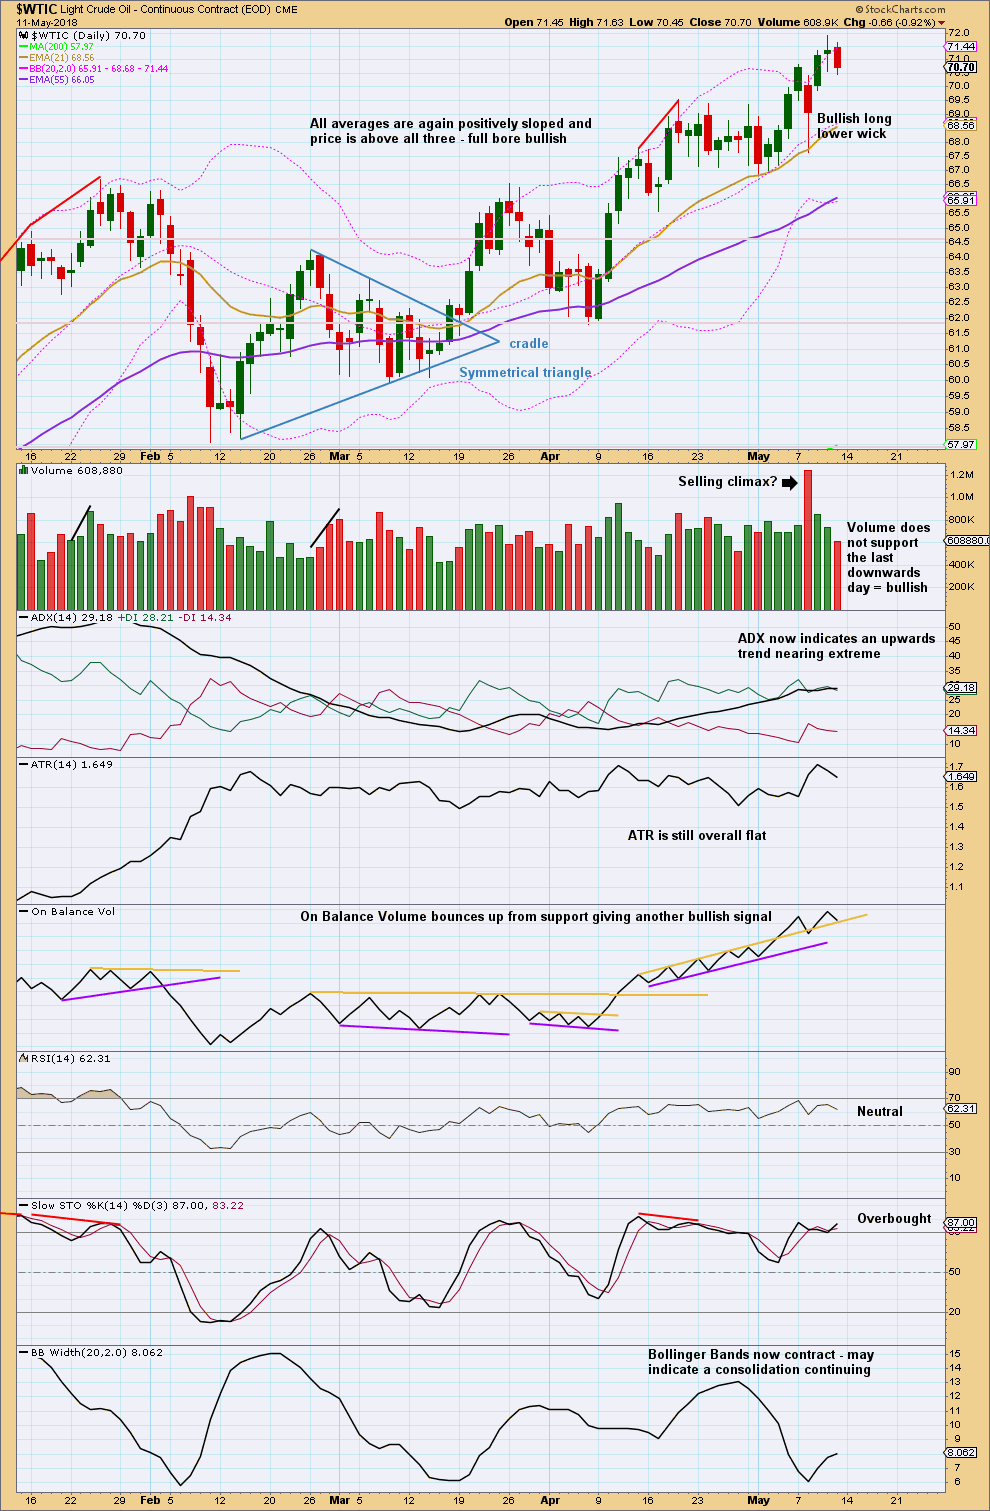
Click chart to enlarge. Chart courtesy of StockCharts.com.
The pullback expected from last week’s analysis did turn up on the 8th of May, but this was more brief and shallow than the Elliott wave count had expected. At that point, this downwards day resolved the bearishness.
ADX may reach very extreme, and remain there for a long period of time, when Oil has a strong trend. Stochastics may reach overbought and remain so for a very long time. Neither of these indicators are useful in predicting the end of a trend.
At this time, Oil is moving through an area with little prior support to offer resistance. Next resistance is about 72.50, which is weak.
RSI is not yet overbought. Only when RSI is overbought and then exhibits clear divergence with price should a reasonable correction be expected as likely.
This chart is very bullish and supports the new main Elliott wave count.
Published @ 11:55 p.m. EST.