
More downwards movement was expected for last week, which is exactly what happened for Silver. The weekly candlestick closed red, with a lower low and a lower high.
Summary: Silver has been coiling for about a year now. Volume suggests a downwards breakout may be more likely; this does not always work, but it does work more often than it fails.
Price will breakout from the consolidation. Expect a very strong and fast movement when it does. A technical principle is the longer price consolidates the longer the resulting trend will be. Expect after a breakout to see Silver trend for about a year or so.
Being positioned early may be profitable. A hedge here, exercised with patience, may be a good approach. If hedging, then risk only up to 5% in total for both positions. Place stops just beyond resistance and support. Final resistance is about 18.65 and final support may be about 15.65 (it could be as low as 14.34).
Always trade with stops, and invest only 1-5% of equity on any one trade.
Last monthly charts can be viewed here.
New updates to this analysis are in bold.
ELLIOTT WAVE COUNTS
MAIN WAVE COUNT
WEEKLY CHART
Click chart to enlarge.
At this stage, with the Gold analysis switching from bull to bear, I no longer wish to try and pick a winner for Silver. Classic technical analysis may be used to suggest which Elliott wave count may be more likely, but this market is much more tricky to analyse than Gold. A better approach may be to now remain neutral and wait for a breakout. That approach requires either a hedge to be set up within the consolidation, or a more patient approach to wait for a breakout before entering in the direction of the breakout.
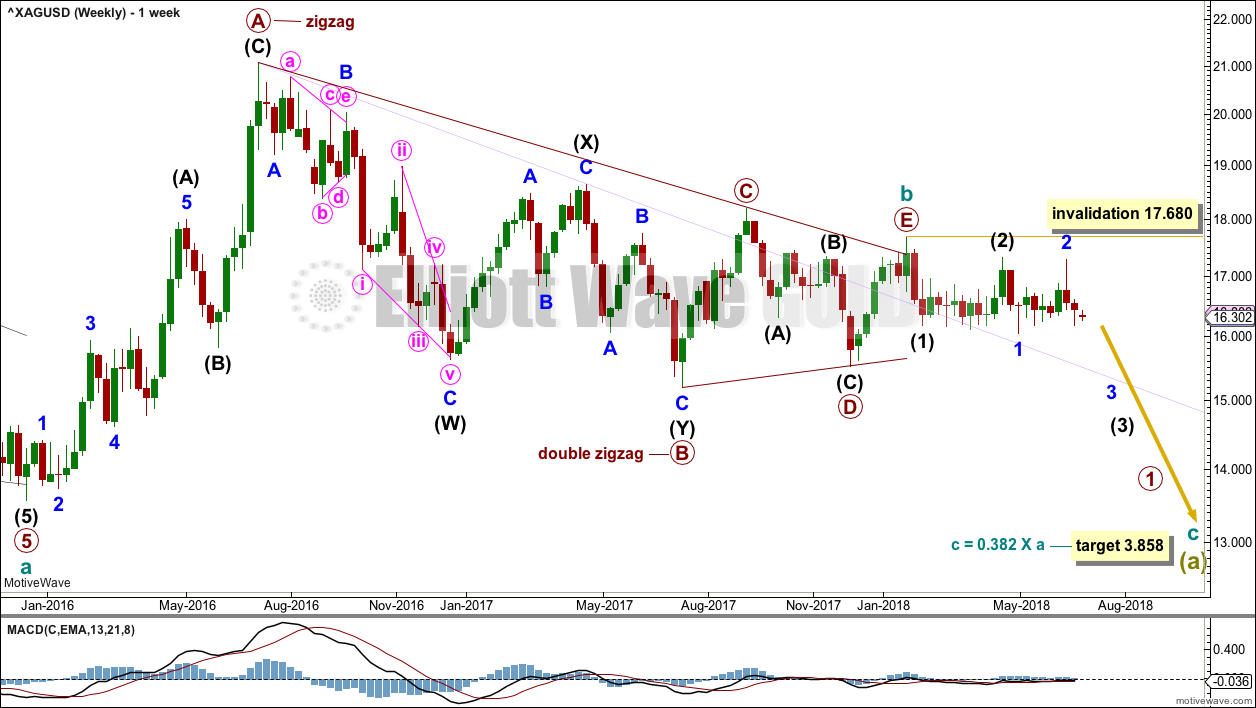
The first wave count expects that the bear market, which began from the April 2011 high, is incomplete.
Cycle wave a is seen as a five wave impulse for this main wave count. There are multiple corrective structures possible still for cycle wave b.
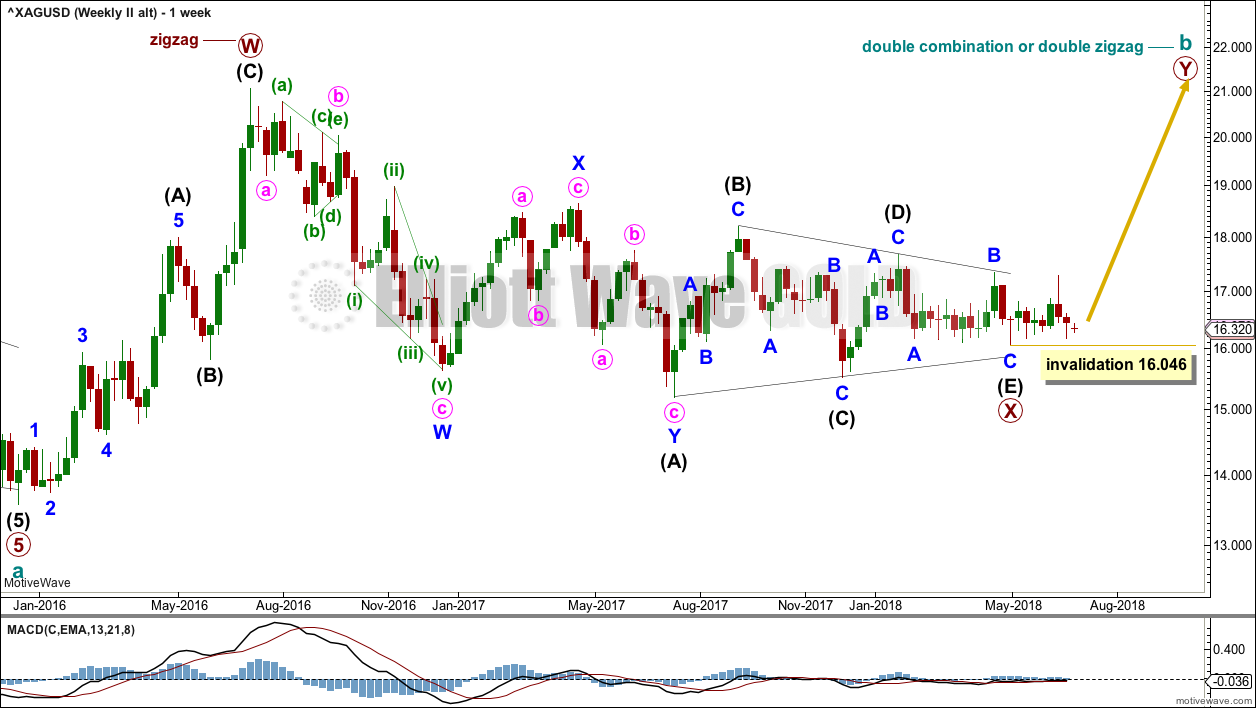
This first weekly chart sees cycle wave b as a now possibly complete regular contracting triangle. I have considered today the idea that the triangle may be continuing sideways as a nine wave triangle, but the trend lines do not work: the highs labelled intermediate wave (2) and minor wave 2 would sit above the A-C trend line. This would look very wrong, so the idea is discarded.
Primary wave E of the triangle may have ended with an overshoot of the A-C trend line. If this wave count is correct, then price should have reversed already. Within the new downwards trend, no second wave correction may move beyond the start of the first wave above 17.680.
DAILY CHART
Click chart to enlarge.
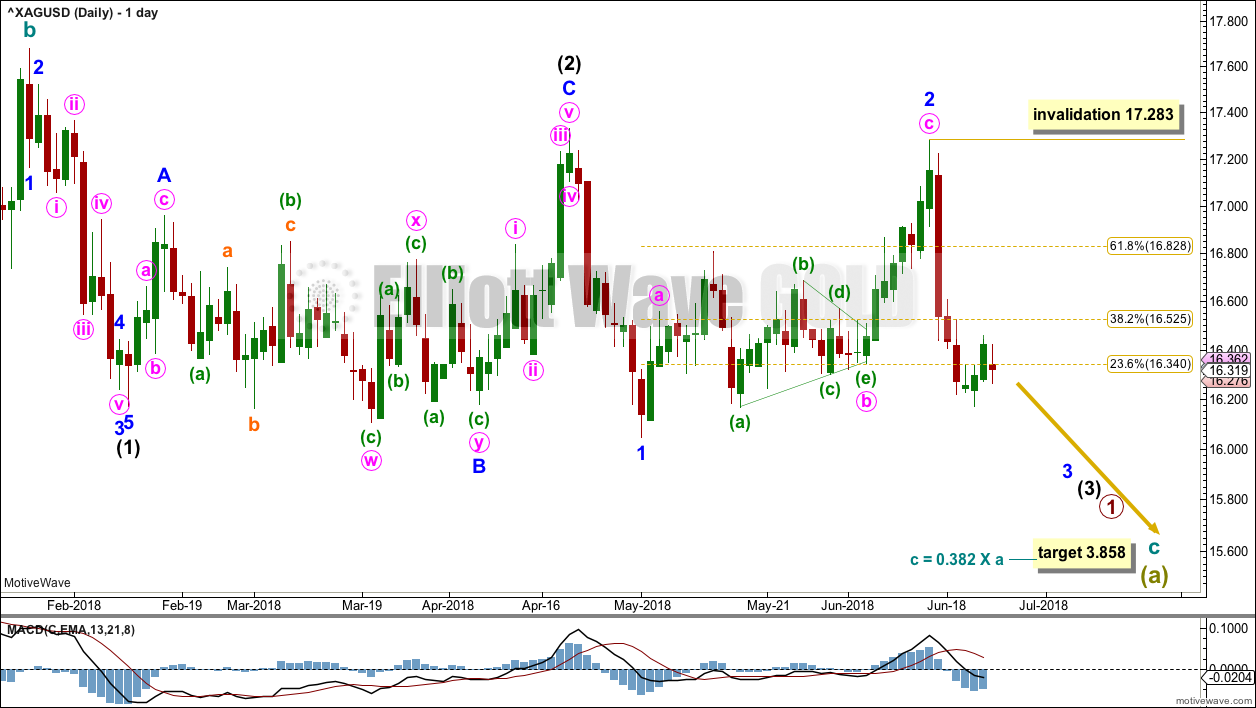
Intermediate wave (1) down subdivides well as a five wave structure.
Intermediate wave (2) may now be complete as a flat correction.
Minor wave B is a double zigzag. All subdivisions fit. However, the purpose of a second zigzag in a double is to deepen the correction when the first zigzag does not move price deep enough. Here, the second zigzag has failed to deepen the correction. This is not technically a truncation, but the effect is the same. This structure makes no sense because it has not achieved its purpose. This must necessarily reduce the probability of this wave count.
Within minor wave 3, no second wave correction may move beyond the start of its first wave 1 above 17.283.
SECOND WAVE COUNT
WEEKLY CHART
Click chart to enlarge.
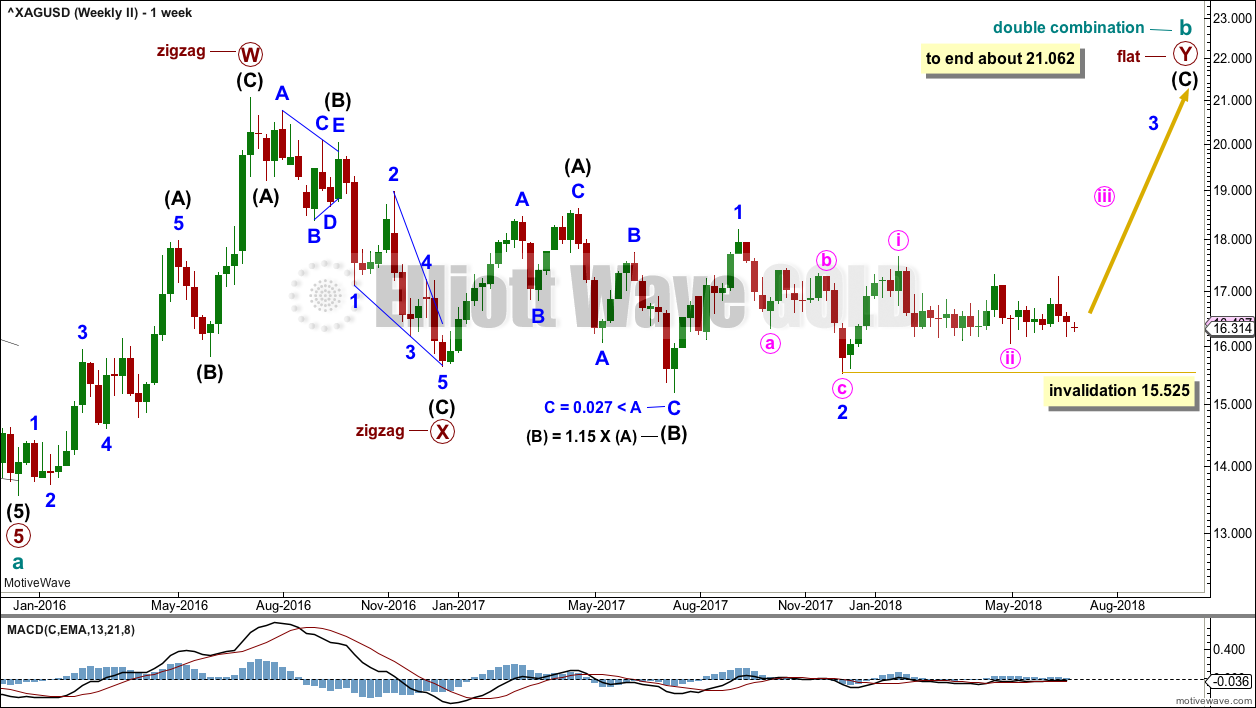
Cycle wave b may be completing as a double combination: zigzag – X – flat. The second structure, a flat correction for primary wave Y, may be underway.
Within a flat correction, intermediate wave (B) must retrace a minimum 0.9 length of intermediate wave (A) at 15.938. Intermediate wave (B) has met this minimum requirement; the rule for a flat correction is met. Intermediate wave (B) is longer than 1.05 times the length of intermediate wave (A) indicating this may be an expanded flat. Expanded flat corrections are the most common type. Normally their C waves are 1.618 or 2.618 the length of their A waves.
The purpose of combinations is to take up time and move price sideways. To achieve this purpose the second structure in the double normally ends about the same level as the first.
Intermediate wave (C) for this wave count is starting out slowly, with deep time consuming second wave corrections. This may indicate very strong upwards movement ahead, with a time consuming and strong impulse to complete.
If minute wave ii continues lower, it may not move beyond the start of minute wave i below 15.525.
DAILY CHART
Click chart to enlarge.
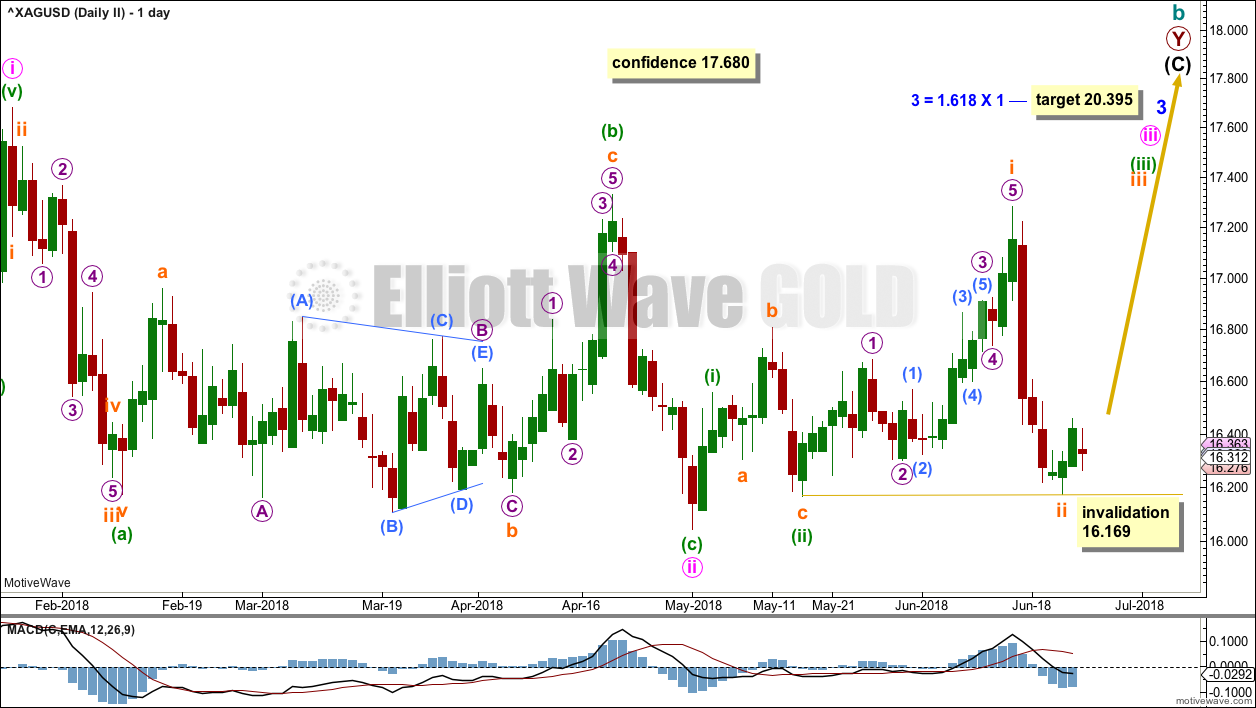
Minute wave ii looks likely to be over. Minute wave iii may only subdivide as an impulse.
There may now be four overlapping first and second waves complete. A third wave up at four degrees may be expected for this wave count; this should exhibit a strong increase in upwards momentum.
Subminuette wave ii may not move beyond the start of subminuette wave i below 16.169.
SECOND WAVE COUNT – SECOND WEEKLY CHART
Click chart to enlarge.
This wave count is identical to the Second Weekly Chart above up to the high labelled primary wave W. Thereafter, it looks at sideways movement as a huge triangle labelled primary wave X. This fits very well with MACD hovering about zero.
Cycle wave b may be either a double zigzag or a double combination. Although both of these structures are labelled W-X-Y note that they are quite different and belong to two different families of corrections.
Double zigzags belong to the zigzag family of corrections. Single and multiple zigzags usually have strong slopes against the prior trend. To achieve a strong slope their X waves are usually brief and shallow, most especially brief. Here, primary wave X is not brief, but it is shallow.
Double combinations belong to the sideways group of corrections. The second structure in a double combination (and the third if there is one) exists to take up time and move price sideways. To achieve a sideways look their X waves are usually deep and may be time consuming. Here, primary wave X is not deep, but it is time consuming.
If cycle wave b is a double zigzag, then primary wave Y may move reasonably higher than the end of primary wave W at 21.062 to achieve its purpose of deepening the correction.
If cycle wave b is a double combination, then primary wave Y must subdivide as a flat correction and may end about the same level as primary wave W at 21.062, so that it achieves its purpose of taking up time and moving price sideways.
At this early stage, within primary wave Y, no second wave correction may move beyond the start of its first wave below 16.046.
ALTERNATE WAVE COUNT
WEEKLY CHART
Click chart to enlarge.
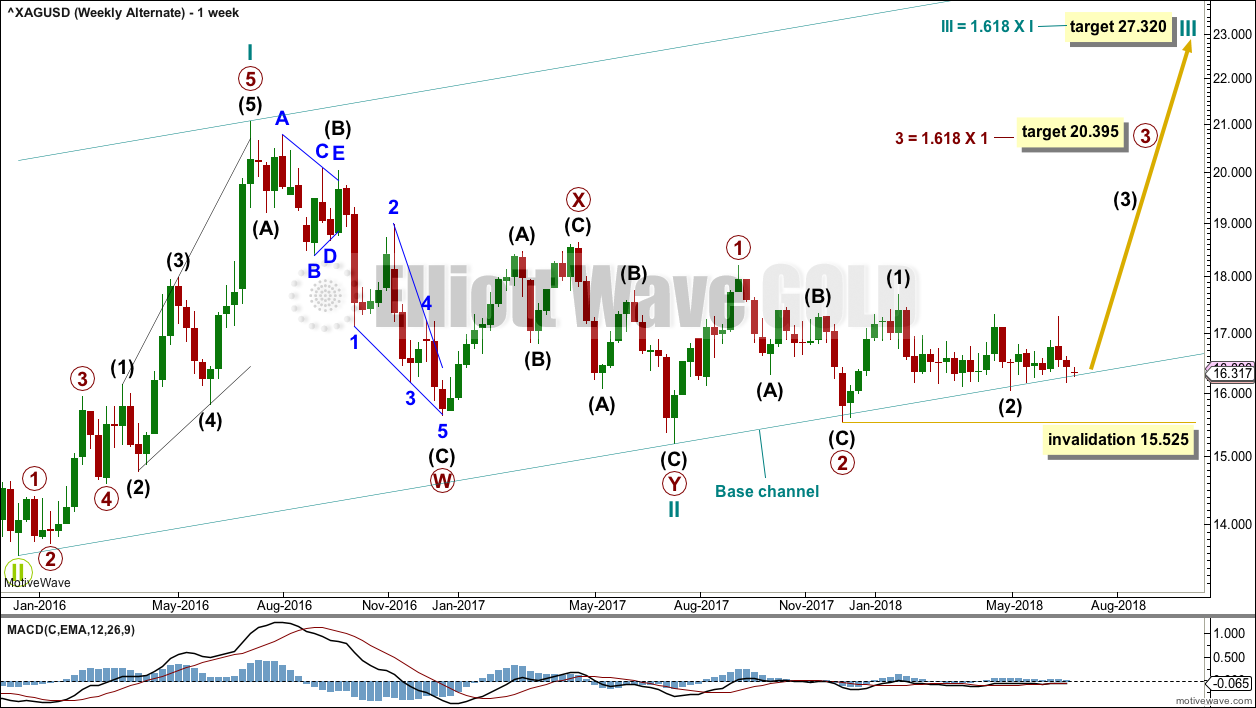
This alternate wave count looks at the possibility that the bear market may be over for Silver and a new bull market may have begun.
A series of three overlapping first and second waves may now be complete for cycle waves I and II, primary waves 1 and 2, and intermediate waves (1) and (2).
A third wave now at three large degrees may be beginning.
Targets calculated for third waves assume the most common Fibonacci ratios to their respective first waves. As price approaches each target, if the structure is incomplete or price keeps rising through the target, then the next Fibonacci ratio in the sequence would be used to calculate a new target.
Within primary wave 3, intermediate wave (2) may not move beyond the start of intermediate wave (1) below 15.525.
The large base channel about cycle waves I and II shows about where recent lows have all found support. A lower degree second wave correction should find support (in a bull market) about a base channel drawn about a first and second wave one or more degrees higher. If this base channel is breached at the daily chart level with one full daily candlestick below and not touching it, then the probability of this alternate wave count would be reduced.
Price continues to find strong support about the lower edge of the base channel.
DAILY CHART
Click chart to enlarge.
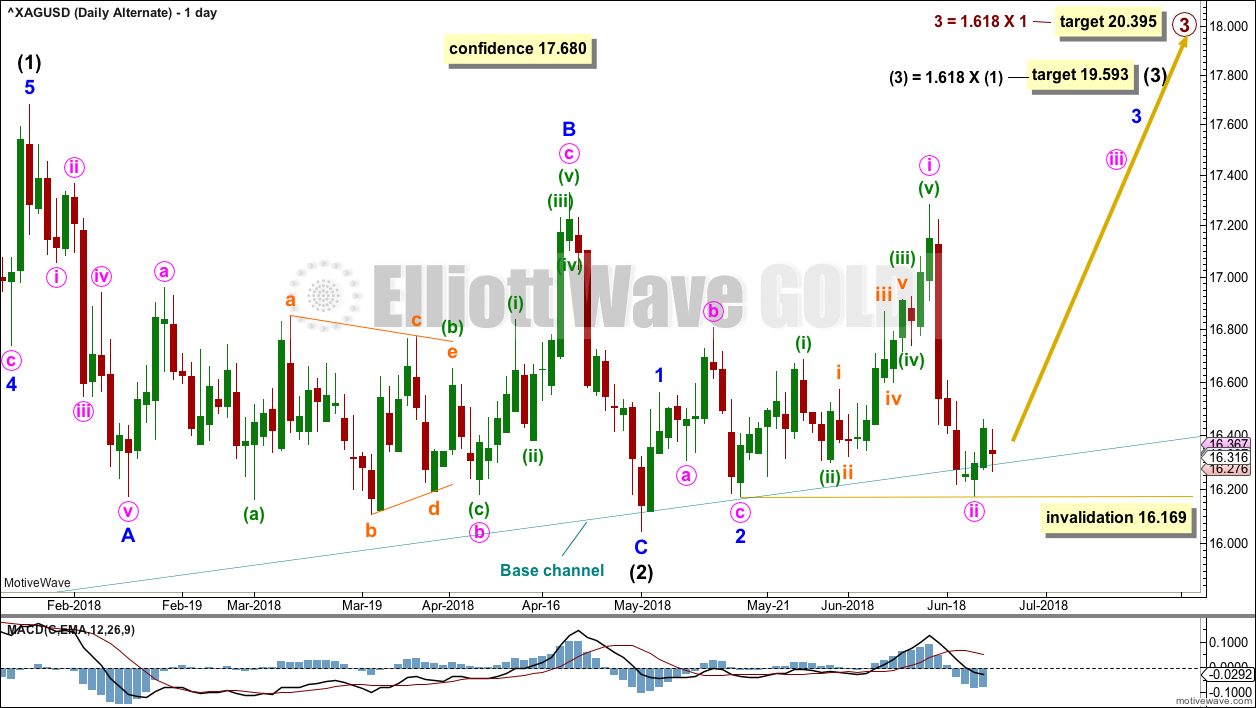
Intermediate wave (2) should be over.
Intermediate wave (3) may only subdivide as an impulse.
There may now be complete four overlapping first and second waves. This wave count expects to see a strong increase in upwards momentum.
Minute wave ii may not move beyond the start of minute wave i below 16.169. Minute wave ii looks likely to move lower early next week. It should find strong support about the lower edge of the teal base channel, which is copied over here from the weekly chart. The base channel has been overshot, but it is not breached.
TECHNICAL ANALYSIS
WEEKLY CHART
Click chart to enlarge. Chart courtesy of StockCharts.com.
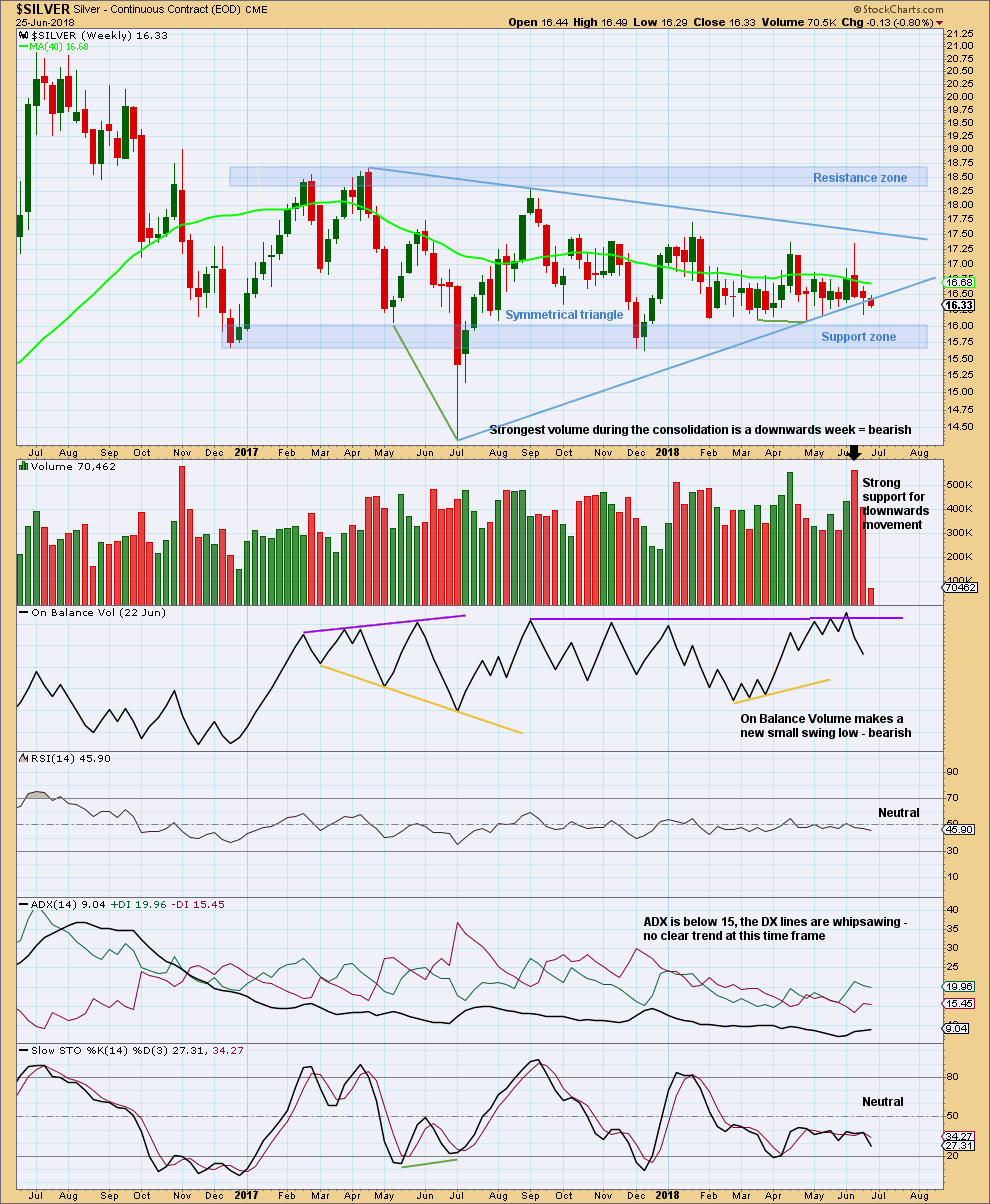
Price remains range bound. It has been coiling now for about a year. A technical principle is the longer price remains within a consolidation the longer the resulting trend will be after price breaks out.
Resistance is in a zone about 18.30 to final resistance about 18.65. Support is in a zone about 16.00 to final support about 15.65. So far, during this consolidation, it is a downwards week that has the strongest volume; this suggests a downwards breakout may be more likely than upwards.
On Balance Volume gave a bullish signal two weeks ago when it made a new high on the weekly chart. Now On Balance Volume gives a bearish signal as it makes a new low on the weekly chart. This contradiction in most recent signals gives a confusing picture for Silver.
DAILY CHART
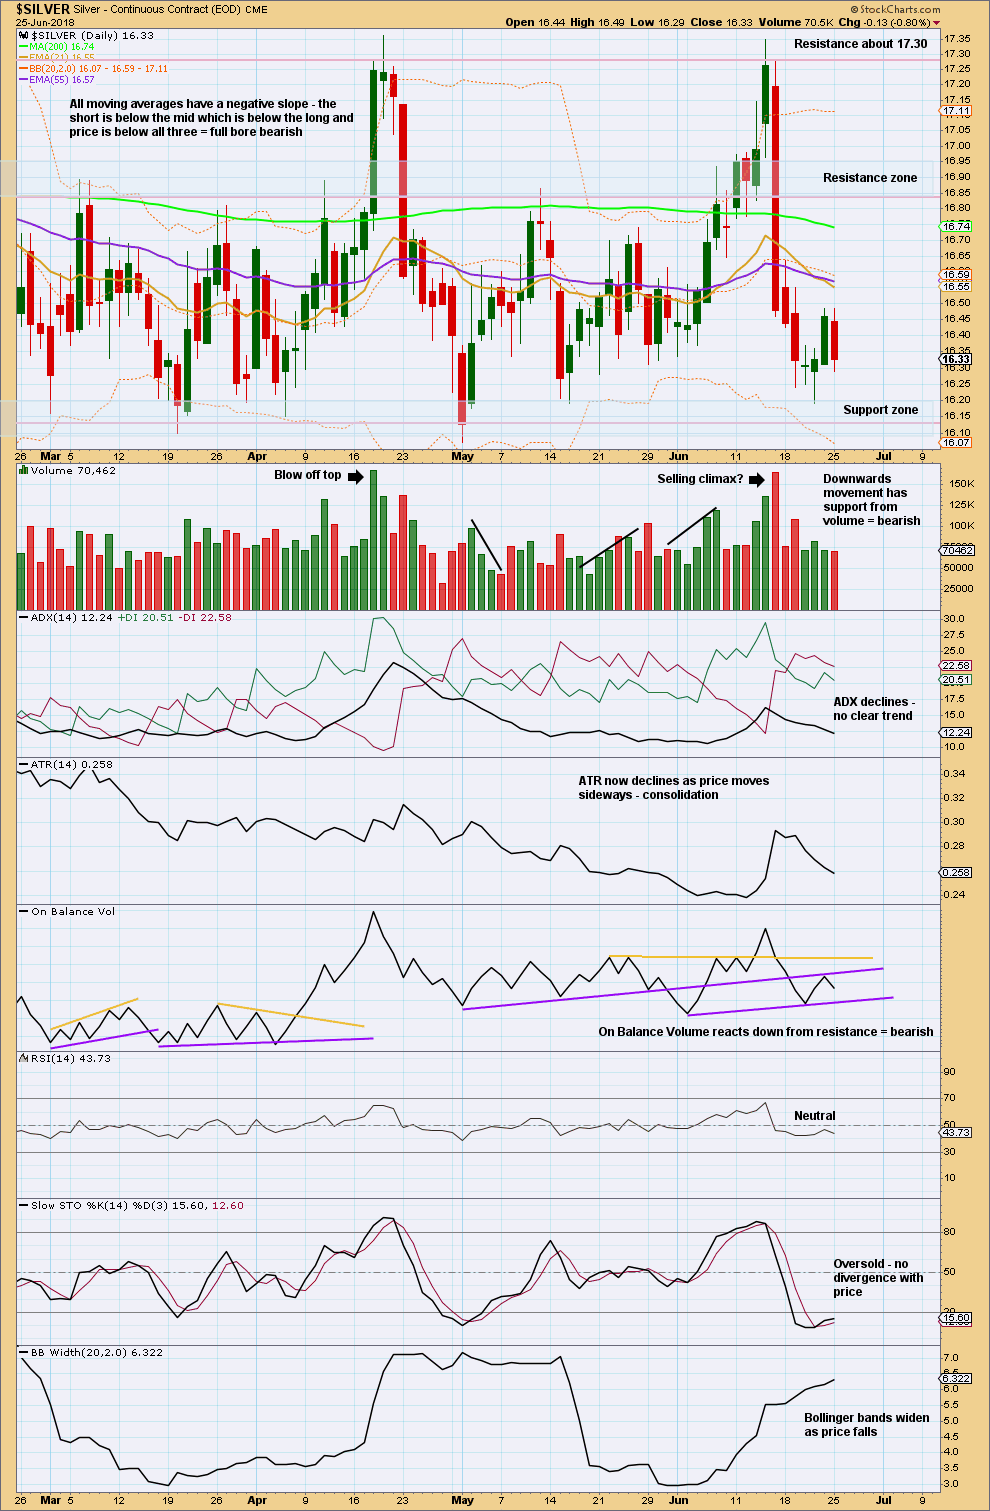
Click chart to enlarge. Chart courtesy of StockCharts.com.
The daily chart shows only the end of the coil of this large consolidation that has lasted about a year.
Price continues to swing from resistance to support and back again. Currently, price has reached support and Stochastics is oversold. It looks reasonable to expect here an upwards swing towards resistance while Stochastics moves to overbought.
One of the several problems with using resistance and support, along with Stochastics, as a swing trading system when price is within a large consolidation like this is the final swing will not happen. That is when price finally breaks out. In the current situation for Silver, because the coil has lasted almost a year, the longer it goes on the closer the breakout will be, and so the higher the risk of a loss if one is trying to trade another swing.
If wanting to set up a hedge here on Silver, then about support is the best possible point for the opening of a long side of a hedge. This approach may now wait for price to move higher before opening the short side of a hedge, and the risk there is that a downwards breakout may occur before the short side is opened.
Risk management is the most important aspect of trading, and the one aspect novices ignore most. Risk only 1-5% of equity for any trade.
Published @ 10:50 p.m. EST.