
Last week’s analysis expected a small bounce, which did not happen.
Volume, RSI and Stochastics are used this week to determine the strength or weakness of this new low.
Summary: Silver has been coiling for about a year now. Volume suggests a downwards breakout may be more likely; this does not always work, but it does work more often than it fails.
Price will breakout from the consolidation. Expect a very strong and fast movement when it does. A technical principle is the longer price consolidates the longer the resulting trend will be. Expect after a breakout to see Silver trend for about a year or so.
If price breaks below 15.65, that may be a downwards breakout; if it has support from volume, then have more confidence in it. Look out for a possible throwback after a breakout. At the end of this week, the bullish Elliott wave counts look less likely while the bearish Elliott wave count has the best look.
Always trade with stops, and invest only 1-5% of equity on any one trade.
Last monthly charts can be viewed here.
New updates to this analysis are in bold.
ELLIOTT WAVE COUNTS
MAIN WAVE COUNT
WEEKLY CHART
Click chart to enlarge.
At this stage, with the Gold analysis switching from bull to bear, I no longer wish to try and pick a winner for Silver. Classic technical analysis may be used to suggest which Elliott wave count may be more likely, but this market is much more tricky to analyse than Gold. A better approach may be to now remain neutral and wait for a breakout. That approach requires either a hedge to be set up within the consolidation, or a more patient approach to wait for a breakout before entering in the direction of the breakout.
A new low now below 15.525 would invalidate the bullish wave counts and only leave this first wave count valid.
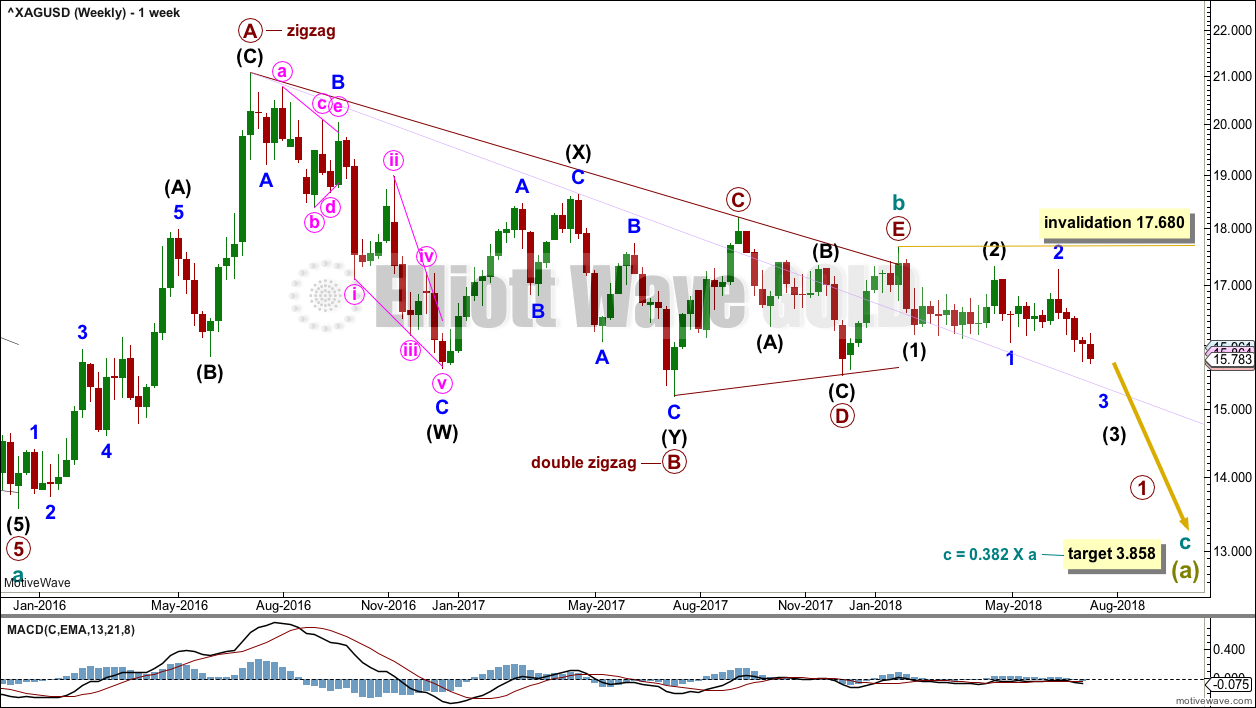
The first wave count expects that the bear market, which began from the April 2011 high, is incomplete.
Cycle wave a is seen as a five wave impulse for this main wave count. There are multiple corrective structures possible still for cycle wave b.
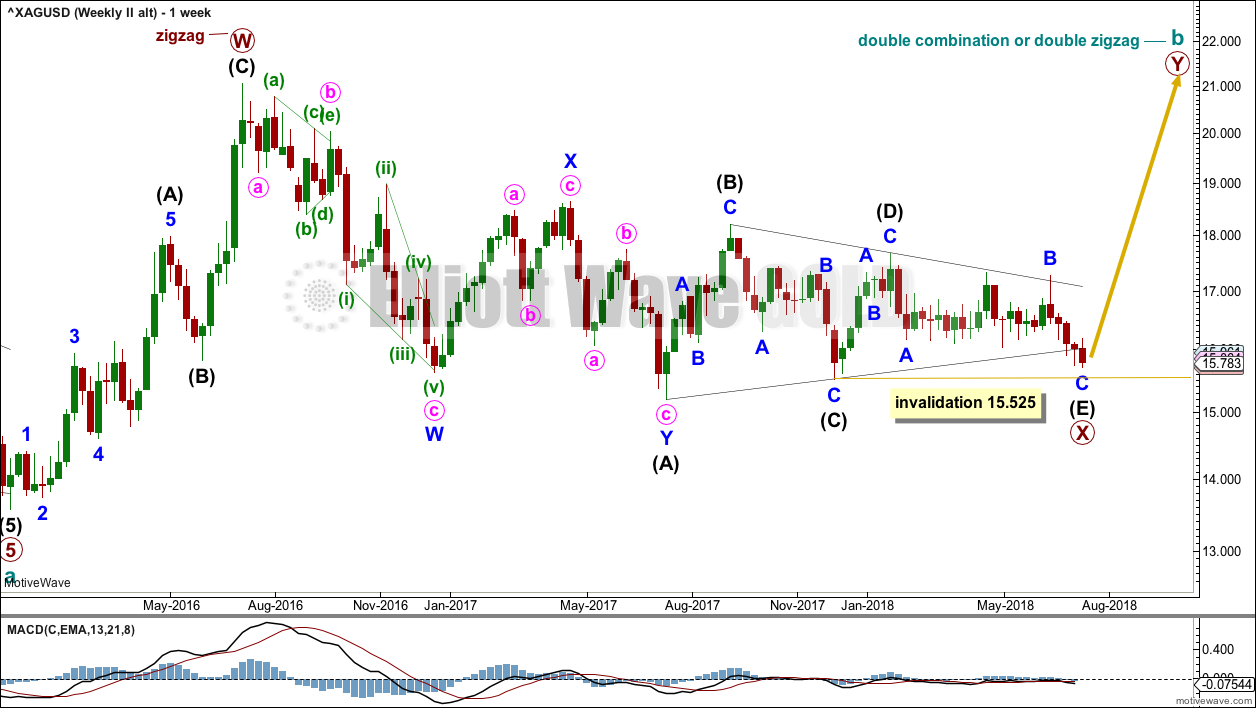
This first weekly chart sees cycle wave b as a now possibly complete regular contracting triangle. I have considered the idea that the triangle may be continuing sideways as a nine wave triangle, but the trend lines do not work: the highs labelled intermediate wave (2) and minor wave 2 would sit above the A-C trend line. This would look very wrong, so the idea is discarded.
Primary wave E of the triangle may have ended with an overshoot of the A-C trend line. If this wave count is correct, then price should have reversed already. Within the new downwards trend, no second wave correction may move beyond the start of the first wave above 17.680.
DAILY CHART
Click chart to enlarge.
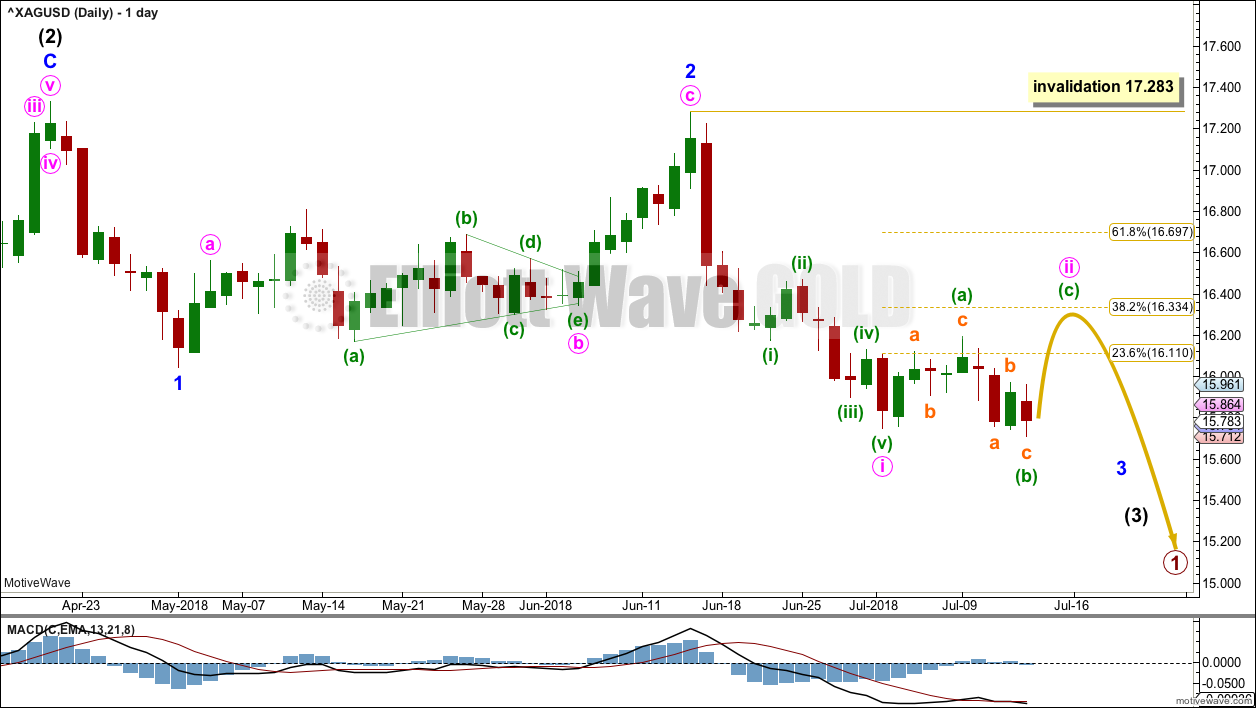
Intermediate wave (3) may only subdivide as an impulse. Within intermediate wave (3), minor waves 1 and 2 may now be complete.
Minor wave 3 may only subdivide as an impulse. Within minor wave 3, minute wave ii may not move beyond the start of minute wave i above 17.283.
Minute wave ii may end about either of the 0.382 or 0.618 Fibonacci ratios, with the 0.382 Fibonacci ratio favoured as the strong downwards pull of a third wave at two degrees may force minute wave ii to be more brief and shallow than otherwise.
At this stage, this wave count has the best fit for most recent movement on the daily chart. Minute wave ii may be continuing as an expanded flat correction. The last small wave down to a new low on Friday may be minuette wave (b).
At 16.430 minuette wave (c) would reach 1.618 the length of minuette wave (a). This is close to 16.334 where minute wave ii would reach 0.382 the length of minute wave i, giving a target zone for a little upwards movement to begin next week.
SECOND WAVE COUNT
WEEKLY CHART
Click chart to enlarge.
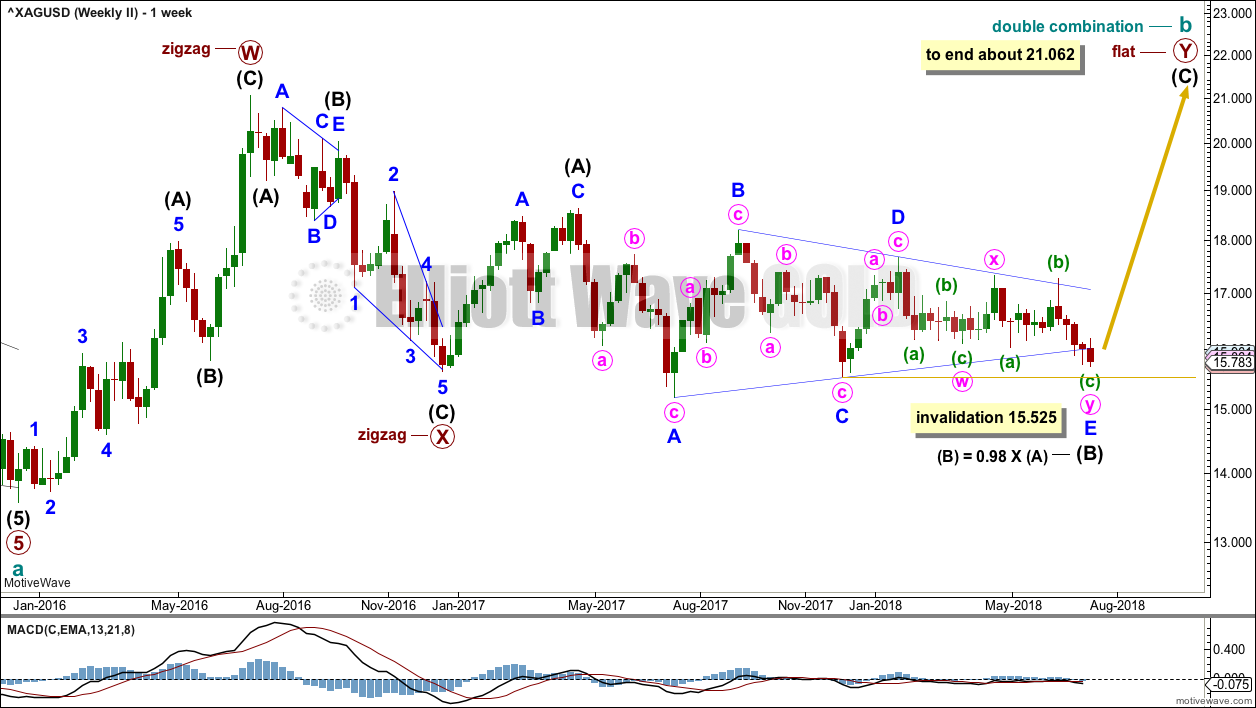
Cycle wave b may be completing as a double combination: zigzag – X – flat. The second structure, a flat correction for primary wave Y, may be underway.
Within a flat correction, intermediate wave (B) must retrace a minimum 0.9 length of intermediate wave (A) at 15.938. Intermediate wave (B) has met this minimum requirement; the rule for a flat correction is met. Intermediate wave (B) may be a completed triangle. Within the triangle, if minor wave E continues, then it may not move beyond the end of minor wave C below 15.525.
E waves of triangles most often end with an undershoot of the A-C trend line. Occasionally, they end with an overshoot of the A-C trend line, but the overshoot is usually relatively brief when they do so. In this case, the overshoot has continued now for two weeks and this wave count no longer has the right look.
The purpose of combinations is to take up time and move price sideways. To achieve this purpose the second structure in the double normally ends about the same level as the first.
DAILY CHART
Click chart to enlarge.
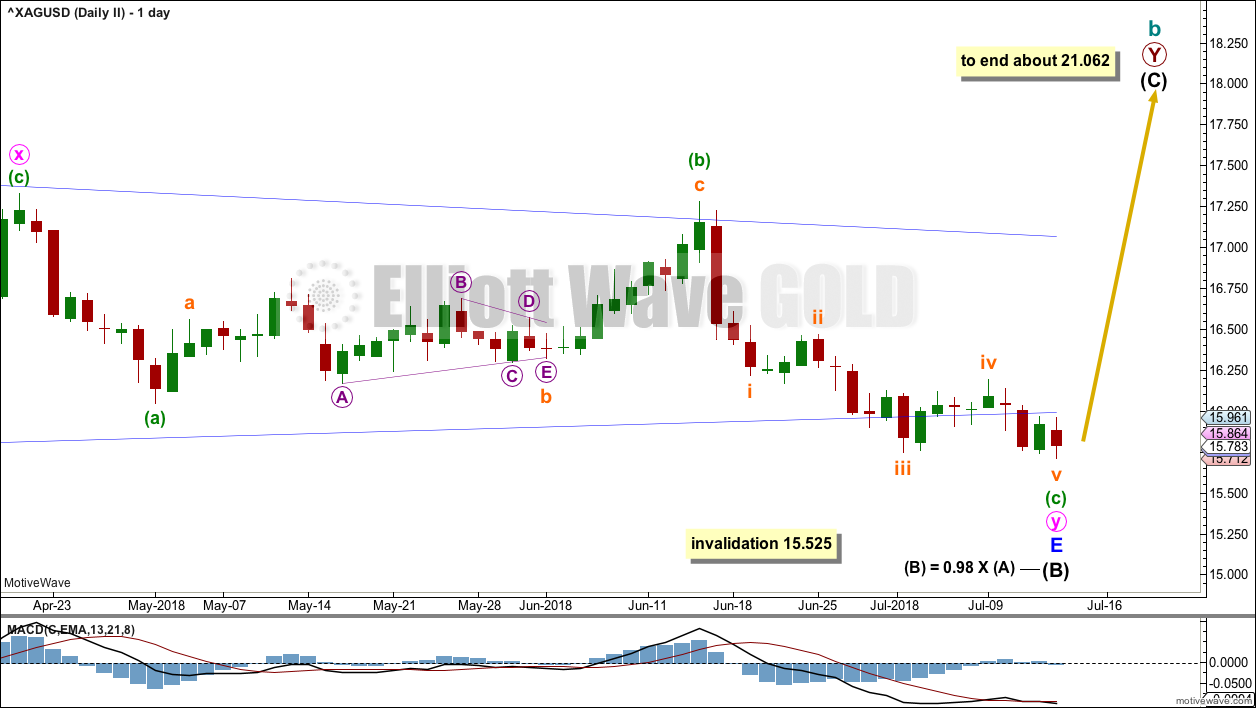
Minor wave E has overshot the A-C trend line. This is not the most common look for an E wave of a triangle, but it does sometimes happen.
If minor wave E has moved a little lower this week, then minuette wave (c) no longer has a good fit as a five wave structure. To avoid an overlap between subminuette waves ii and iv, subminuette wave ii is seen as a flat correction with subminuette wave i ending earlier. This is possible and meets all Elliott wave rules, but it does not have the best look.
SECOND WAVE COUNT – SECOND WEEKLY CHART
Click chart to enlarge.
This wave count is identical to the Second Weekly Chart above up to the high labelled primary wave W. Thereafter, it looks at sideways movement as a huge triangle labelled primary wave X. This fits very well with MACD hovering about zero.
This wave count now also suffers from the problem that the overshoot for wave E of the triangle has lasted two weeks. This does not have a typical look.
Cycle wave b may be either a double zigzag or a double combination. Although both of these structures are labelled W-X-Y note that they are quite different and belong to two different families of corrections.
Double zigzags belong to the zigzag family of corrections. Single and multiple zigzags usually have strong slopes against the prior trend. To achieve a strong slope their X waves are usually brief and shallow, most especially brief. Here, primary wave X is not brief, but it is shallow.
Double combinations belong to the sideways group of corrections. The second structure in a double combination (and the third if there is one) exists to take up time and move price sideways. To achieve a sideways look their X waves are usually deep and may be time consuming. Here, primary wave X is not deep, but it is time consuming.
If cycle wave b is a double zigzag, then primary wave Y may move reasonably higher than the end of primary wave W at 21.062 to achieve its purpose of deepening the correction.
If cycle wave b is a double combination, then primary wave Y must subdivide as a flat correction and may end about the same level as primary wave W at 21.062, so that it achieves its purpose of taking up time and moving price sideways.
At this early stage, within primary wave Y, no second wave correction may move beyond the start of its first wave below 16.046.
ALTERNATE WAVE COUNT
WEEKLY CHART
Click chart to enlarge.
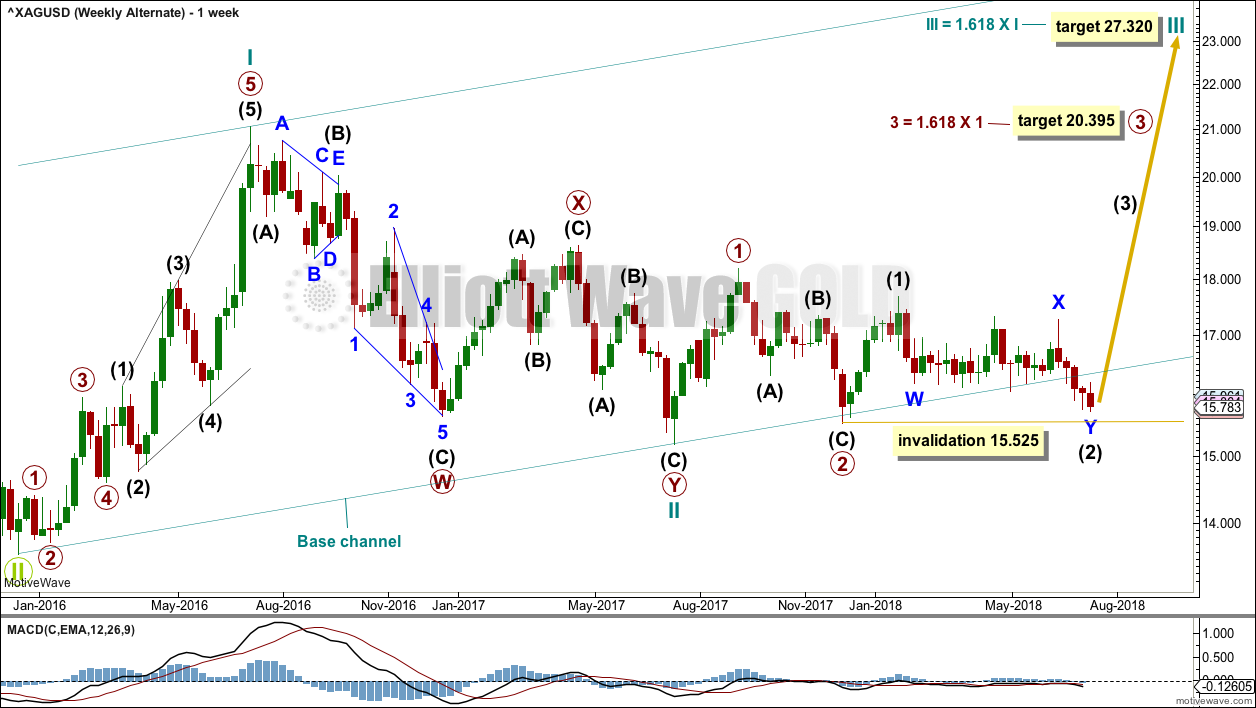
This alternate wave count looks at the possibility that the bear market may be over for Silver and a new bull market may have begun.
A series of three overlapping first and second waves may now be complete for cycle waves I and II, primary waves 1 and 2, and intermediate waves (1) and (2).
A third wave now at three large degrees may be beginning.
Targets calculated for third waves assume the most common Fibonacci ratios to their respective first waves. As price approaches each target, if the structure is incomplete or price keeps rising through the target, then the next Fibonacci ratio in the sequence would be used to calculate a new target.
Within primary wave 3, intermediate wave (2) may not move beyond the start of intermediate wave (1) below 15.525.
The large base channel is drawn about cycle waves I and II. A lower degree second wave correction should find support (in a bull market) about a base channel drawn about a first and second wave one or more degrees higher. This base channel is now breached at the weekly chart level with two full weekly candlesticks below and not touching it, so the probability of this alternate wave count is reduced. The probability is too low now in my judgement to publish a daily chart for this wave count.
TECHNICAL ANALYSIS
WEEKLY CHART
Click chart to enlarge. Chart courtesy of StockCharts.com.
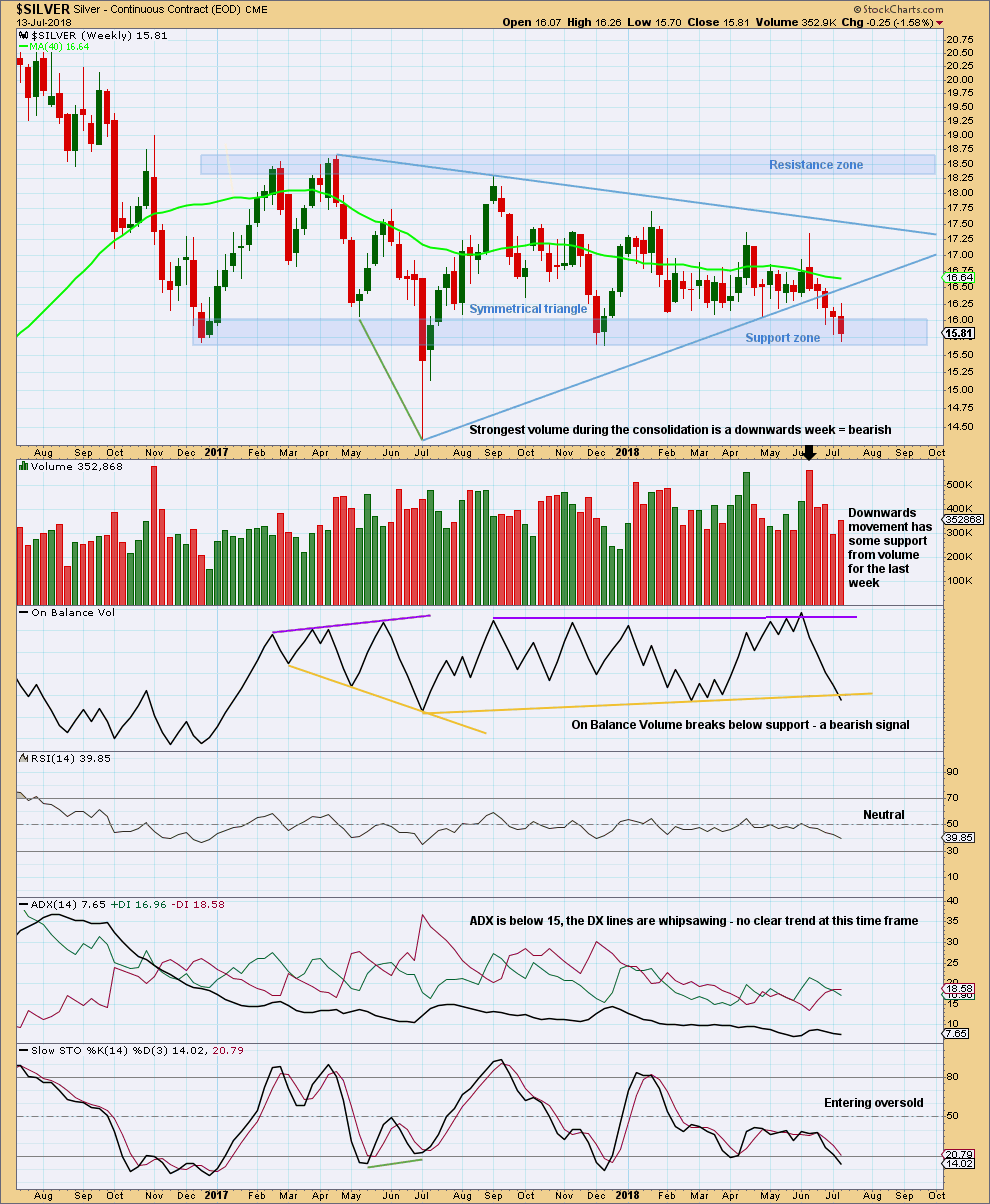
Price remains range bound. It has been coiling now for about a year. A technical principle is the longer price remains within a consolidation the longer the resulting trend will be after price breaks out.
Resistance is in a zone about 18.30 to final resistance about 18.65. Support is in a zone about 16.00 to final support about 15.65. So far, during this consolidation, it is a downwards week that has the strongest volume; this suggests a downwards breakout may be more likely than upwards.
With price now at the lower edge of the support zone, look for a possible downwards breakout shortly. If price closes below 15.65, that would be a downwards breakout. If that happens, look for a possible throwback to resistance before price starts to move strongly lower. However, please note that throwbacks to resistance after a downwards breakout do not always happen, and it is not as common as a pullback to support after an upwards breakout. Be prepared to not see much of a throwback if price does break downwards.
A downwards breakout does not require support from volume for confidence; but if volume does support it, then we may have more confidence in it.
On Balance Volume has been giving conflicting bullish and bearish signals in recent weeks. On Balance Volume gives a new bearish signal this week.
DAILY CHART
Click chart to enlarge. Chart courtesy of StockCharts.com.
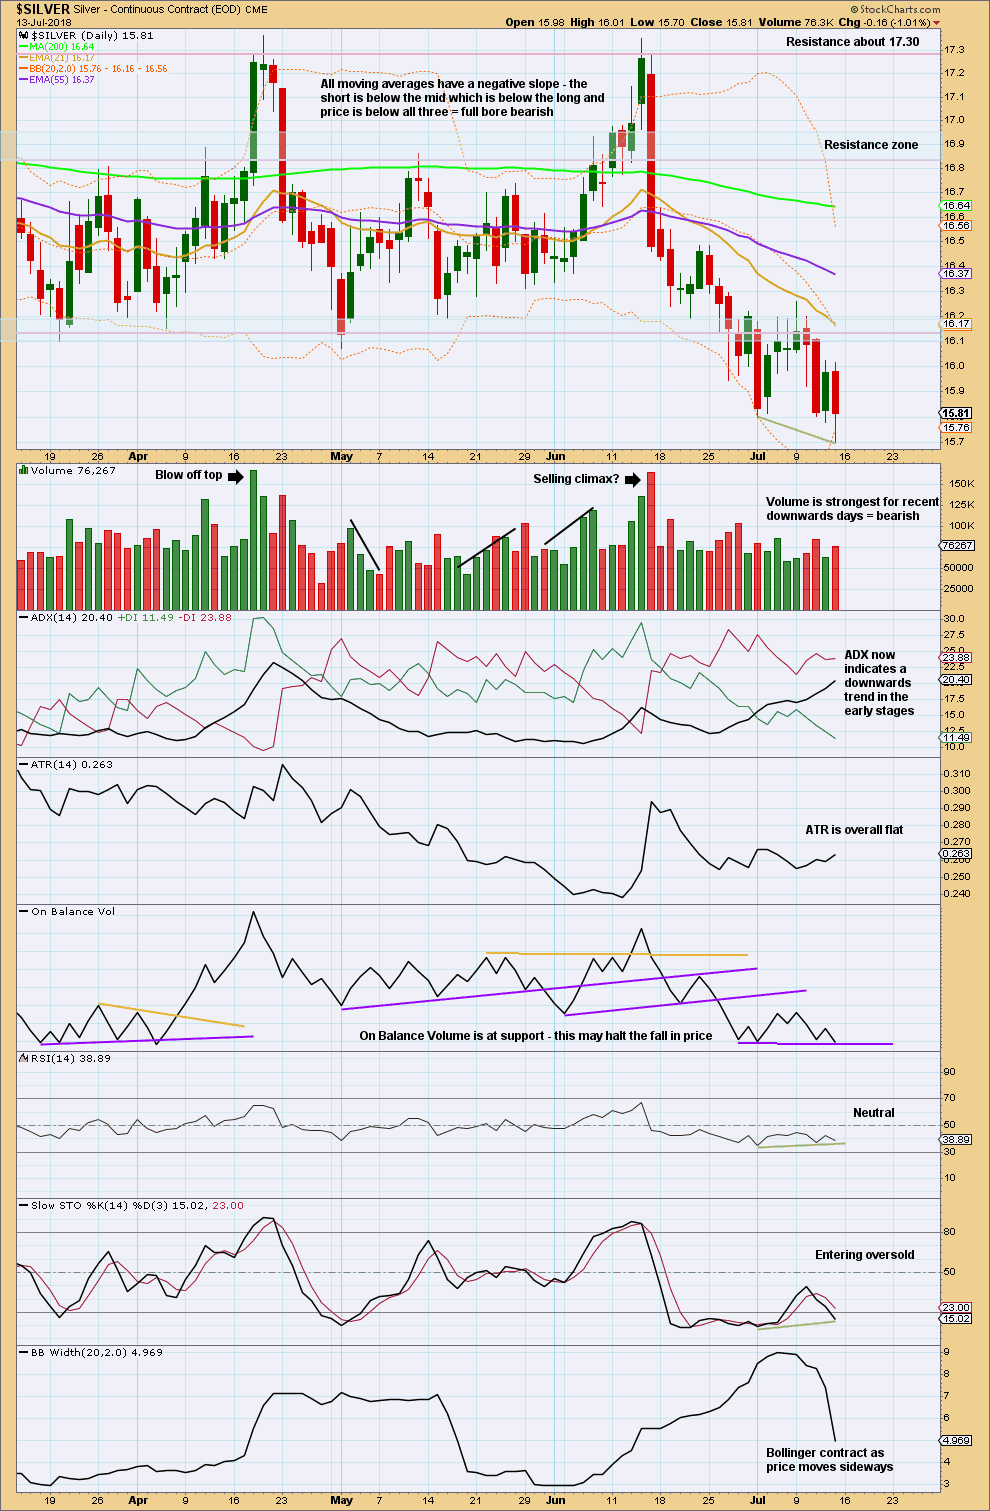
The daily chart shows only the end of the coil of this large consolidation that has lasted about a year.
The last low for Friday exhibits some weakness with bullish divergence between price and both of RSI and Stochastics. This supports the main Elliott wave count, which expects a small upwards swing to begin next week.
If On Balance Volume breaks below support first though, then look out for an imminent downwards breakout of the larger consolidation at the weekly chart level.
Published @ 10:11 p.m. EST on 14th July, 2018.