
Downwards movement was expected. Although Silver has not made a new low below the prior low three weeks ago, it did move lower for the week.
Summary: A classic downwards breakout from a very long held consolidation still looks like it has occurred, and now a backtest of resistance at prior support may have completed.
The trend is down. Bounces and consolidations may be used as opportunities to join the trend.
The next small wave down may be limited to no lower than 14.611; another small consolidation may be expected before this point.
Always trade with stops, and invest only 1-5% of equity on any one trade.
Last monthly charts can be viewed here.
New updates to this analysis are in bold.
ELLIOTT WAVE COUNTS
MAIN WAVE COUNT
WEEKLY CHART
Click chart to enlarge.
This main wave count now has good support from classic technical analysis, so it will be favoured. This wave count looks highly likely.
The first wave count expects that the bear market, which began from the April 2011 high, is incomplete.
Cycle wave a is seen as a five wave impulse for this main wave count. There are multiple corrective structures possible still for cycle wave b.
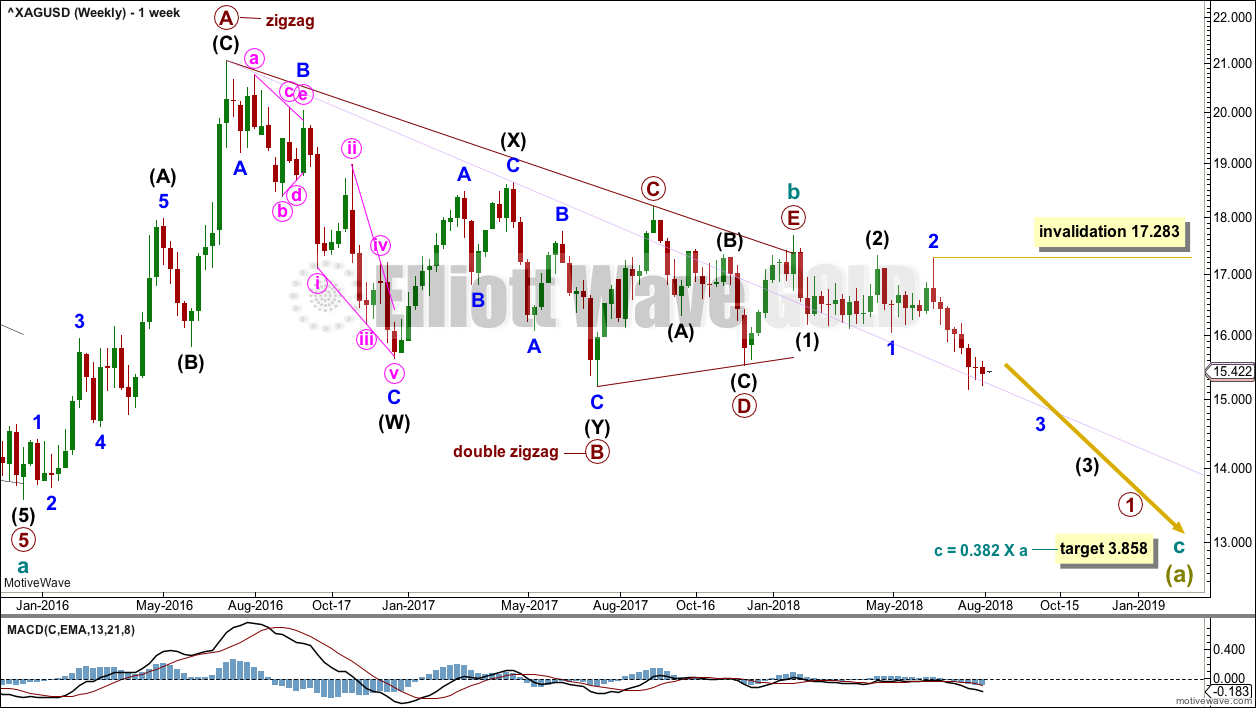
This first weekly chart sees cycle wave b as a now possibly complete regular contracting triangle.
Primary wave E of the triangle may have ended with an overshoot of the A-C trend line.
So far, within the new downwards trend, there may now be two overlapping first and second waves and a third wave at two degrees may be unfolding lower. Look out for a selling climax to end one or both of minor wave 3 and intermediate wave (3). Commodities can exhibit very strong fifth waves; this tendency is especially prevalent in fifth waves to end third wave impulses.
Within minor wave 3, no second wave correction may move beyond the start of its first wave above 17.283.
DAILY CHART
Click chart to enlarge.
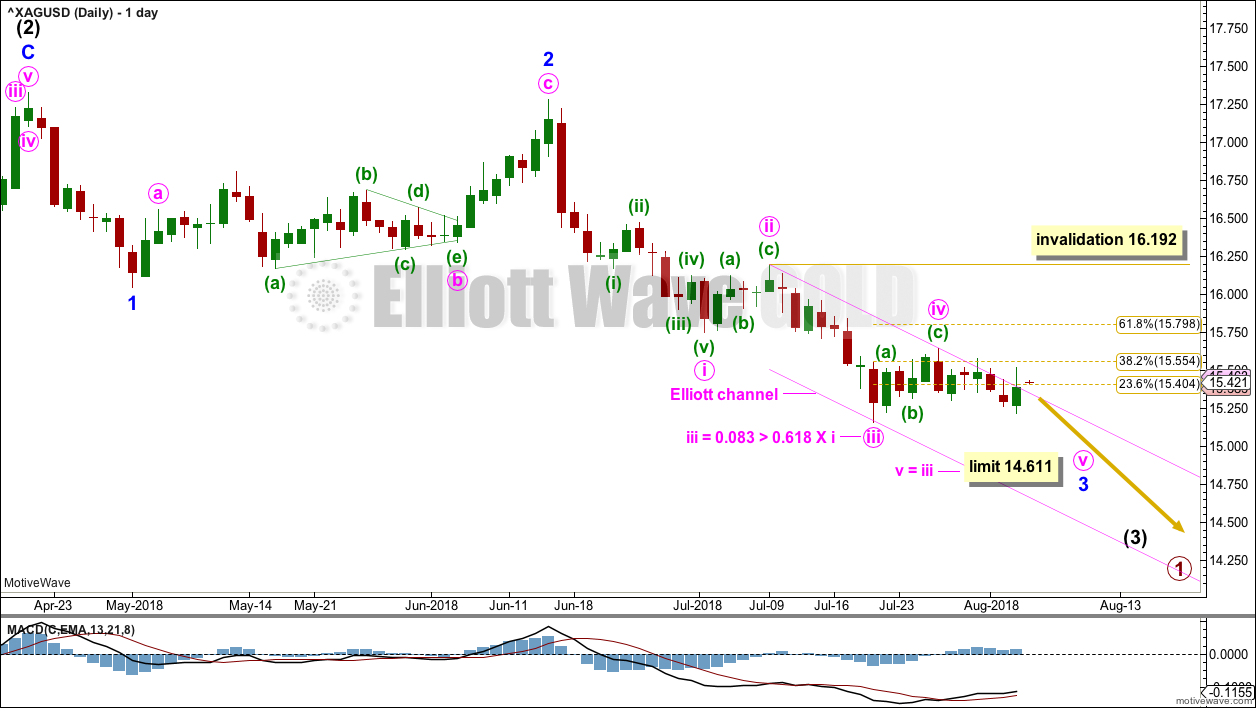
Intermediate wave (3) may only subdivide as an impulse. Within intermediate wave (3), minor waves 1 and 2 may now be complete.
Minor wave 3 may only subdivide as an impulse.
Within minor wave 3, minute waves i, ii, iii and now iv may all be complete. If this labelling is correct, then minute wave iii is shorter than minute wave i. This limits minute wave v to no longer than equality in length with minute wave iii, so that the core Elliott wave rule stating a third wave may never be the shortest is met.
If minute wave iii was over at the last low, then minute wave iv may also be over at the last small high, or it may continue a little further sideways. Minute wave iv may not move into minute wave i price territory above 15.748.
It is also still possible that minute wave iii may not be complete. The degree of labelling from the high labelled minute wave ii may again be moved down one degree, so that only minuette wave (i) within minute wave iii may be complete. Minuette wave (ii) may not move beyond the start of minuette wave (i) above 16.192. The invalidation point will be left at this point to allow for this possibility.
Minor wave 3 may end with one more low. When that is complete, then minor wave 4 may begin. Minor wave 2 was a very deep 0.96 zigzag. Given the guideline of alternation, minor wave 4 may be expected to be shallow and most likely a time consuming sideways type of correction, like a combination, flat or triangle. Minor wave 4 may not move into minor wave 1 price territory above 16.046.
SECOND WAVE COUNT
WEEKLY CHART
Click chart to enlarge.
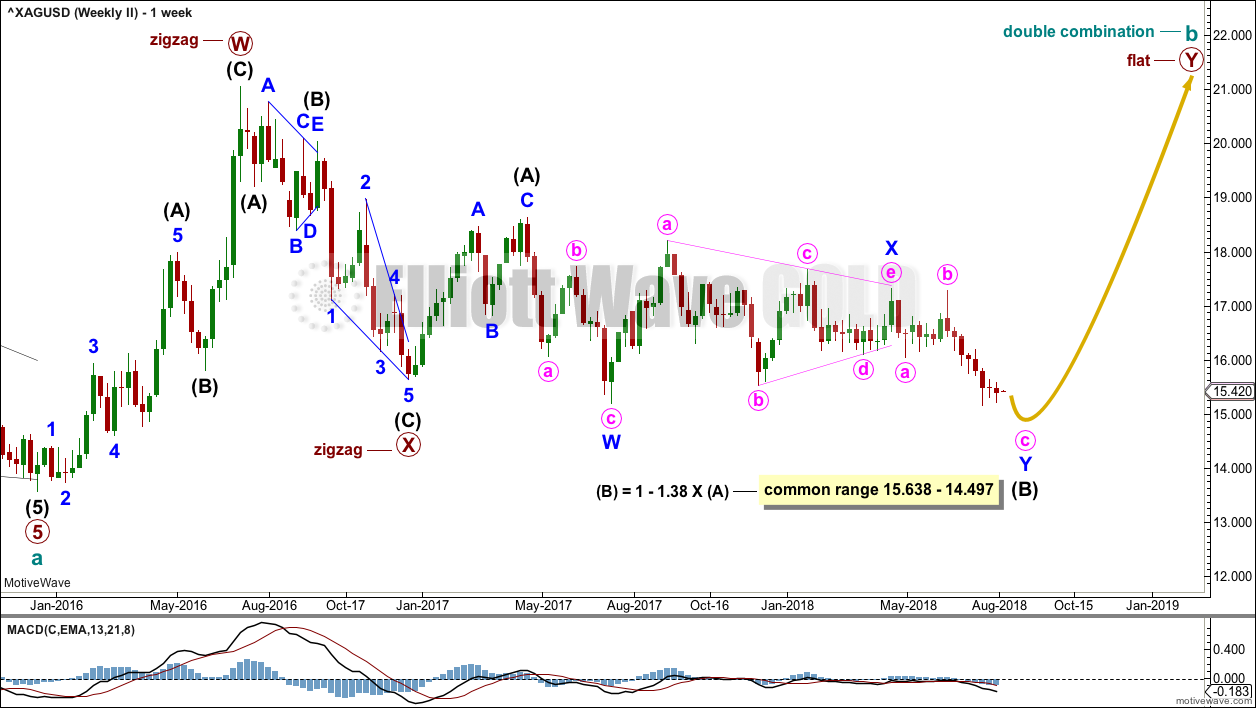
Cycle wave b may still be completing as a double combination: zigzag – X – flat. The second structure, a flat correction for primary wave Y, may be underway.
Within a flat correction, intermediate wave (B) must retrace a minimum 0.9 length of intermediate wave (A) at 15.938. Intermediate wave (B) has met this minimum requirement; the rule for a flat correction is met. Intermediate wave (B) may be continuing a little lower as a double zigzag.
The purpose of combinations is to take up time and move price sideways. To achieve this purpose the second structure in the double normally ends about the same level as the first.
DAILY CHART
Click chart to enlarge.
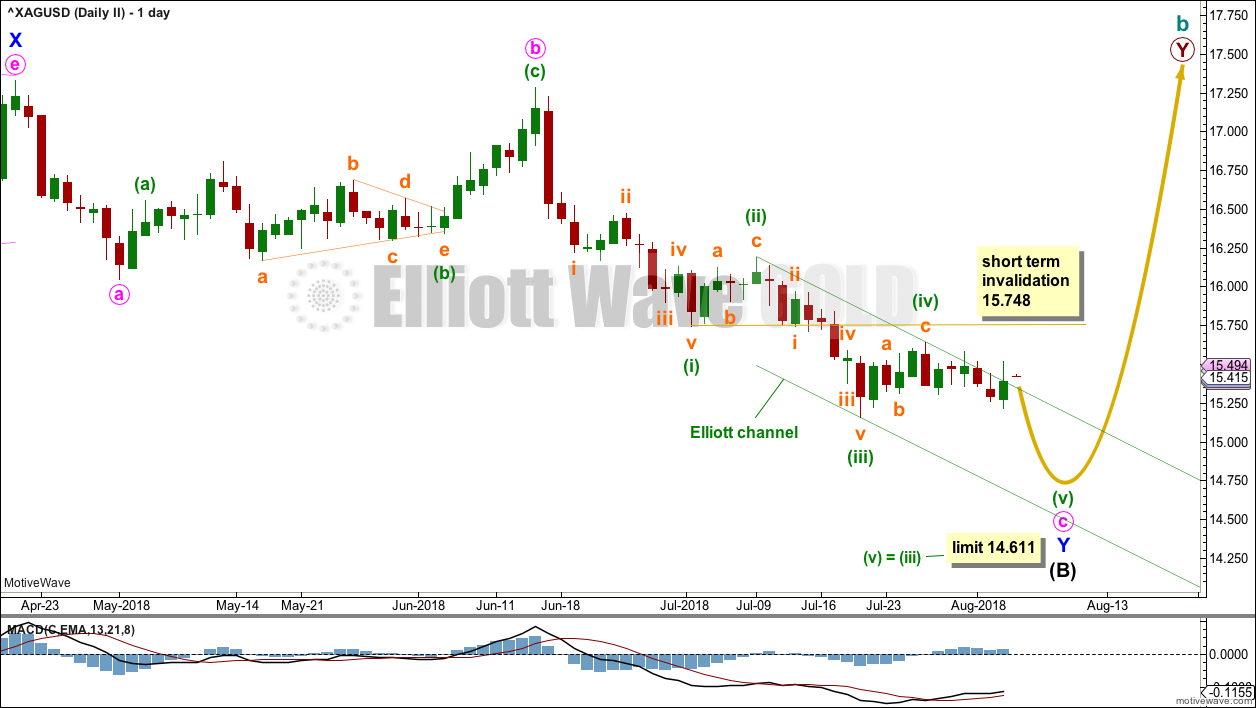
This daily chart shows all of the second possible zigzag in the double for intermediate wave (B). The second zigzag is labelled minor wave Y.
Within the zigzag of minor wave Y, minute wave c must subdivide as a five wave structure. At this stage, current labelling shows it is unfolding as an impulse. Also at this stage, it is not possible to see minute wave c complete as the last low. Therefore, more downwards movement to complete the structure looks most likely. It needs one more low for the structure to be complete.
If minuette wave (iii) is correctly labelled as complete, then minuette wave (iv) may not move into minuette wave (i) price territory above 15.748.
The channel is this week redrawn as an Elliott channel using the second technique: the first trend line is drawn from the ends of minuette waves (ii) to (iv), then a parallel copy is placed upon the end of minuette wave (iii). The channel is slightly overshot but mostly contains all movement so far.
Only one slight new low is expected for this second wave count to complete the entire structure for intermediate wave (B). As soon as that happens the short term invalidation point no longer applies and an intermediate degree trend change would be expected.
This wave count considers the possibility that the downwards breakout could have been false and that price may return to within the consolidation zone above about 16.00.
ALTERNATE WAVE COUNT
WEEKLY CHART
Click chart to enlarge.
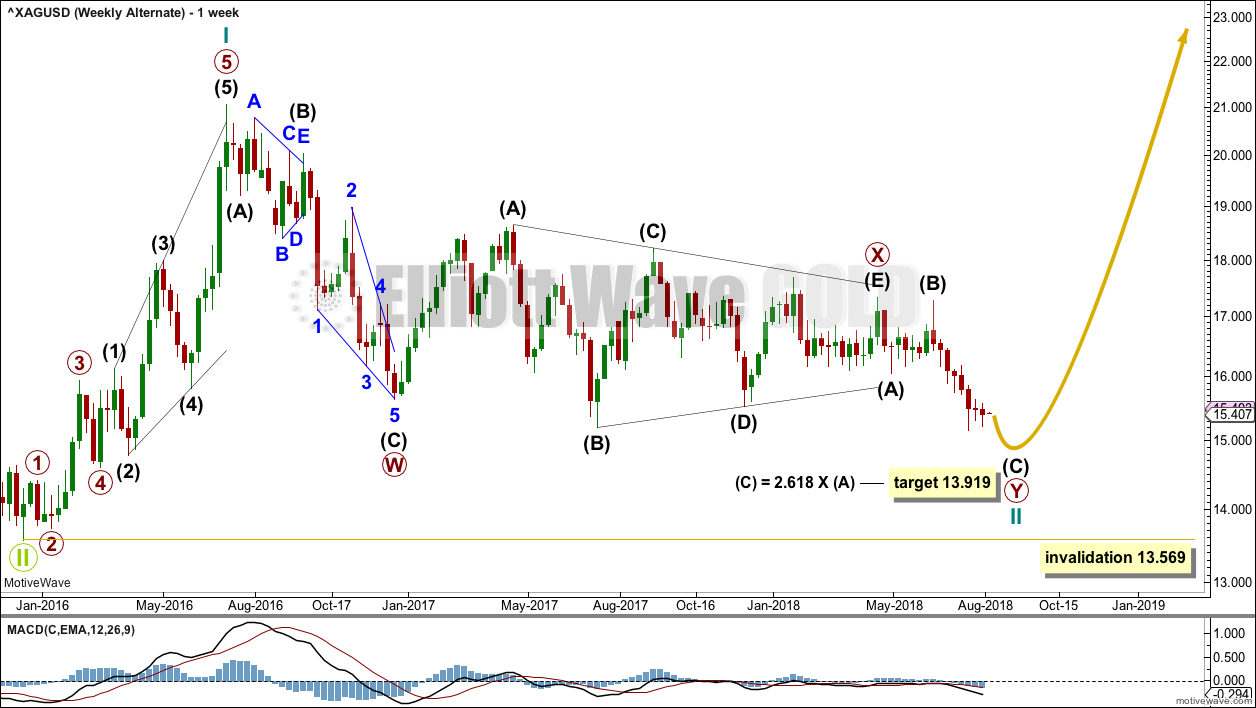
This alternate wave count looks at the possibility that the bear market may be over for Silver and a new bull market may have begun.
This wave count remains valid if cycle wave II is considered to be continuing.
Cycle wave II may be continuing further as a double zigzag. The first zigzag in the double may be complete, labelled primary wave W. The double may be joined by a corrective structure in the opposite direction, a triangle labelled primary wave X.
The second zigzag in the double may be incomplete. It is labelled primary wave Y.
Within primary wave Y, intermediate wave (C) has passed both equality in length with intermediate wave (A) and 1.618 the length of intermediate wave (A). The structure of intermediate wave (C) is incomplete.
A target is calculated using the next Fibonacci ratio in the sequence.
Cycle wave II may not move beyond the start of cycle wave I below 13.569.
DAILY CHART
Click chart to enlarge.
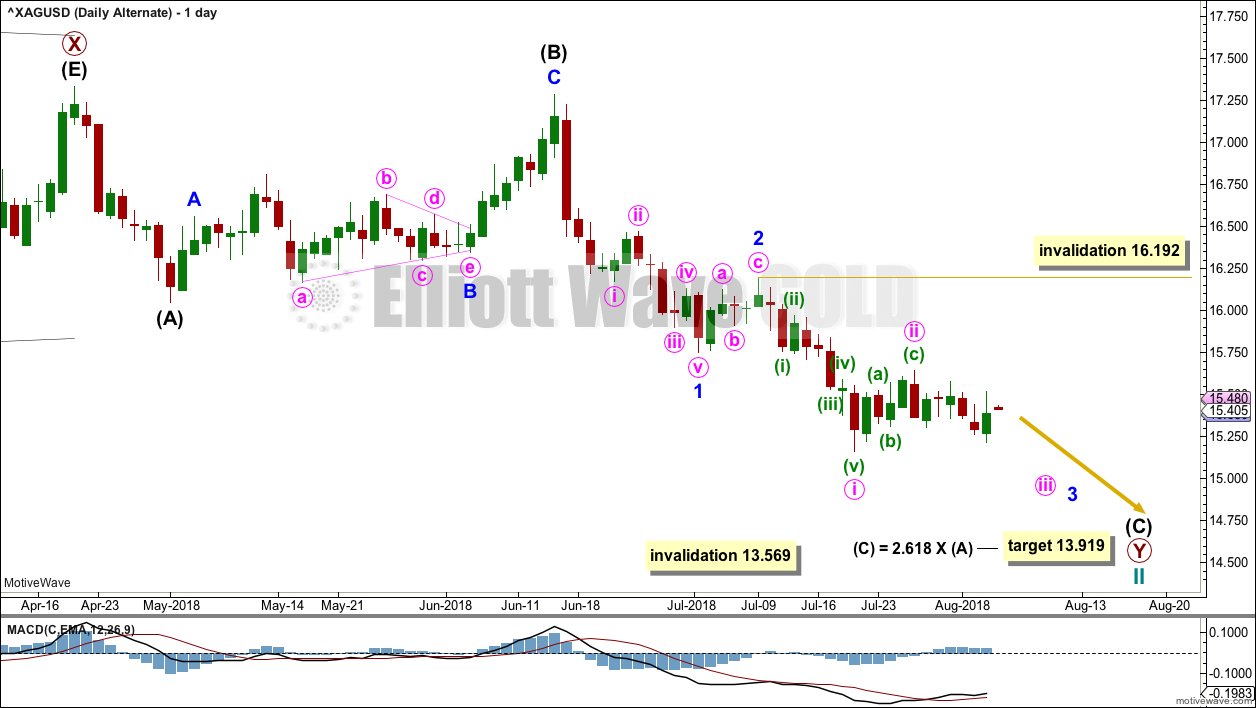
A five wave impulse for intermediate wave (C) may be unfolding lower for this wave count.
Within the impulse, minor waves 1 and 2 may be complete and minor wave 3 may be incomplete.
Within minor wave 3, minute waves i and ii may be complete. If minute wave ii continues any higher, then it may not move beyond the start of minute wave i above 16.192.
TECHNICAL ANALYSIS
WEEKLY CHART
Click chart to enlarge. Chart courtesy of StockCharts.com.
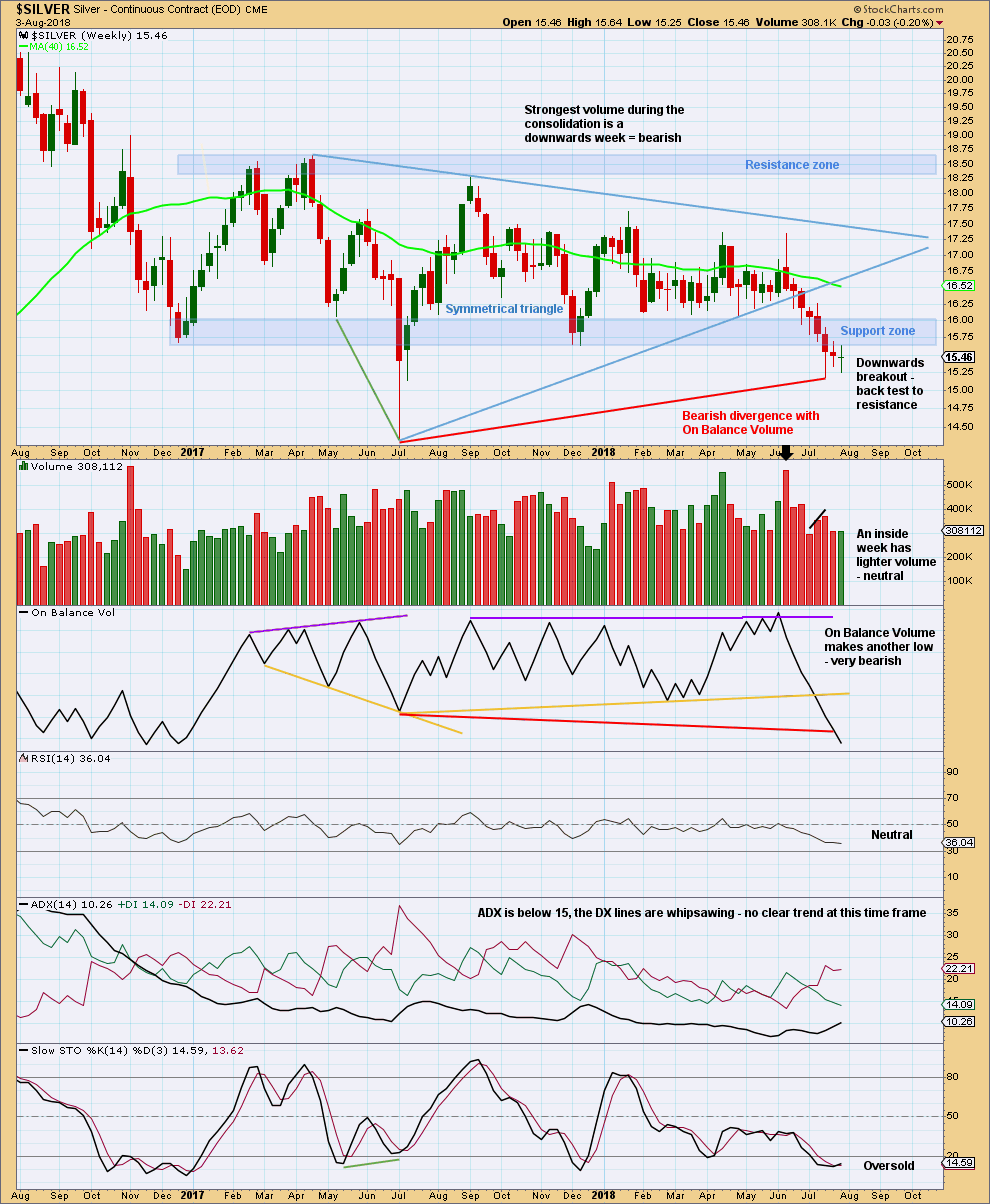
It still looks like Silver has seen a classic downwards breakout from the shaded support zone, which is now providing resistance (this week saw a bounce and a small back test).
On Balance Volume is very bearish.
ADX is now rising and the -DX line is above the +DX line. If ADX rises to 15, it would indicate a new downwards trend at this time frame. This would be the strongest signal ADX can give.
DAILY CHART
Click chart to enlarge. Chart courtesy of StockCharts.com.
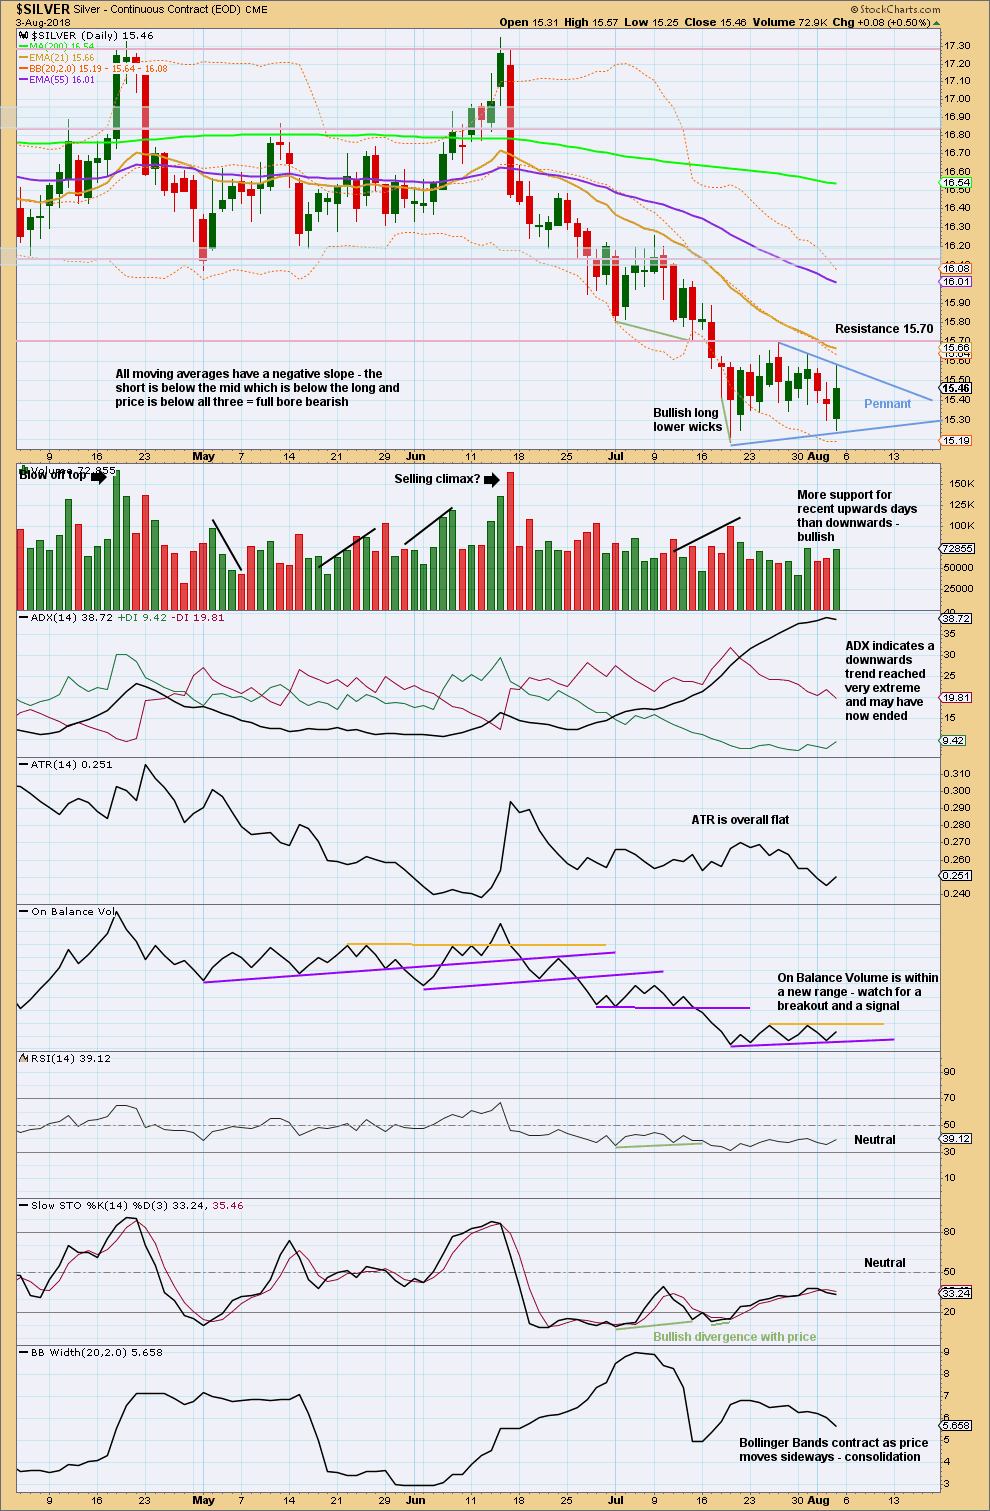
A small pennant pattern looks like it may be forming. These are reliable continuation patterns.
During the pennant pattern, it is upwards days that have strongest volume. This contradicts the expected downwards breakout from the pattern.
Watch On Balance Volume carefully over the next week. A breakout will provide a signal for the next direction for price.
Published @ 02:52 a.m. EST on 6th August, 2018.