
A bounce was expected to begin this week. Price has moved higher for the week as expected.
Summary: Look now for price to either consolidate sideways or bounce higher.
The larger trend remains down until proven otherwise.
Monthly charts are reviewed in this analysis.
New updates to this analysis are in bold.
ELLIOTT WAVE COUNTS
MAIN WAVE COUNT
MONTHLY CHART
Click chart to enlarge.
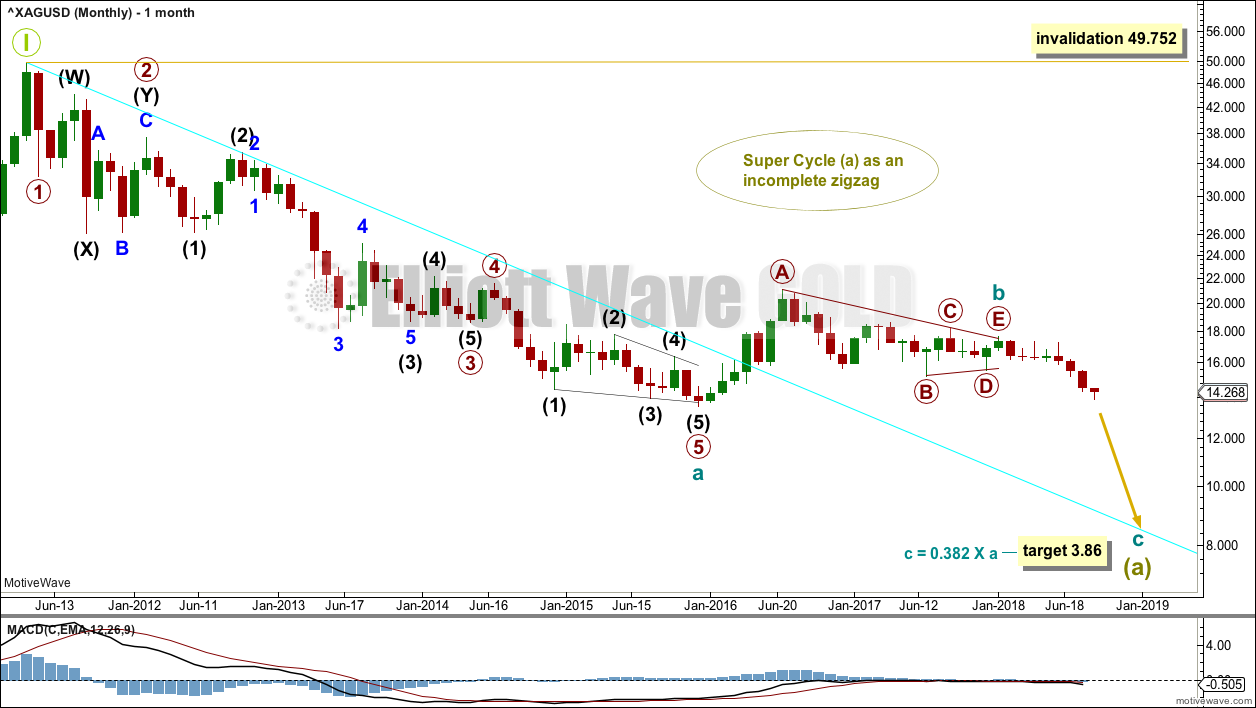
Grand Super Cycle wave I may have ended at the last high. That may also be the end of a Grand Super Cycle wave III, to be in line with Gold analysis (but for Silver there is not as much historic data available).
Either way, the structure may be the same whether this be a second or fourth wave correction.
The Grand Super Cycle correction may be an incomplete flat or combination, with Super Cycle wave (a) downwards an incomplete zigzag.
Two weekly charts are given below which follow this main monthly chart. The first weekly chart considers cycle wave b as a complete triangle. The second weekly chart considers cycle wave b as an incomplete double combination. If cycle wave a has subdivided as a five wave structure, then cycle wave b may not move beyond its start above 49.752.
WEEKLY CHART – TRIANGLE
Click chart to enlarge.
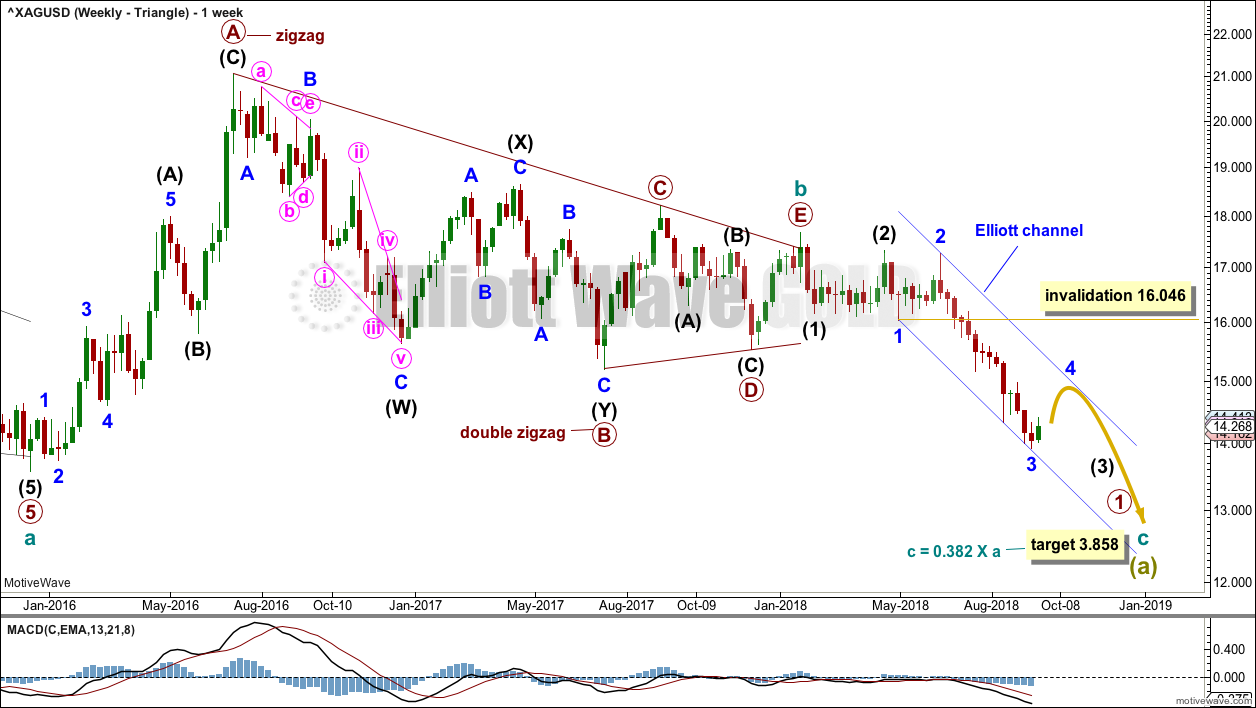
This first wave count has good support from classic technical analysis, so it will be favoured. This wave count looks highly likely.
The first wave count expects that the bear market, which began from the April 2011 high, is incomplete.
Cycle wave a is seen as a five wave impulse for this main wave count. There are multiple corrective structures possible still for cycle wave b.
This first weekly chart sees cycle wave b as a now possibly complete regular contracting triangle.
Primary wave E of the triangle may have ended with an overshoot of the A-C trend line.
So far, within the new downwards trend, minor wave 3 may now be over with a selling climax. This is typical behaviour of commodities.
Minor wave 4 may now unfold sideways. Minor wave 4 may not move into minor wave 1 price territory above 16.046.
Draw an Elliott channel about downwards movement as shown. Copy it over to the daily chart. Minor wave 4 may find resistance about the upper edge, if it gets that high.
DAILY CHART – TRIANGLE
Click chart to enlarge.
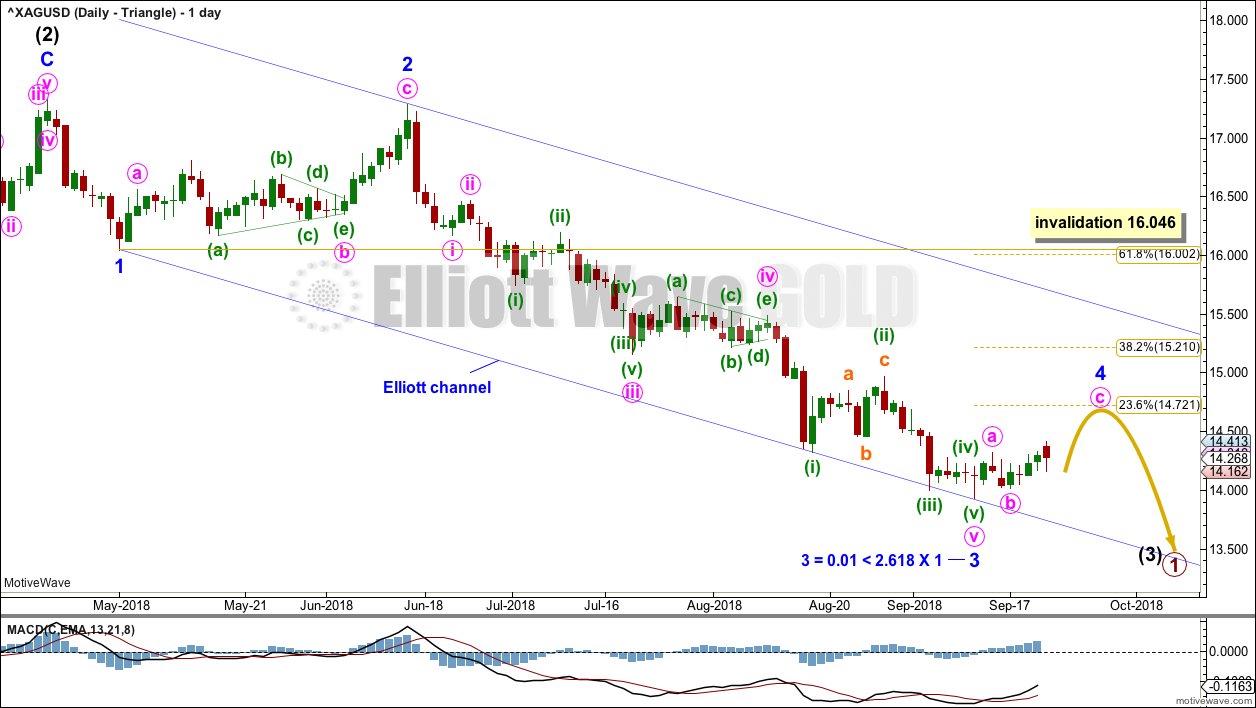
Intermediate wave (3) may only subdivide as an impulse. Minor wave 3 now exhibits a good Fibonacci ratio to minor wave 1.
Minor wave 2 was a very deep 0.96 zigzag lasting 32 days (6 weeks). Given the guideline of alternation, minor wave 4 may be expected to most likely be a shallow sideways flat, triangle or combination. The 0.236 and 0.382 Fibonacci ratios are both reasonable targets.
Minor wave 4 may last anywhere from 3 to 13 weeks to show reasonable proportion.
If minor wave 4 unfolds as an expanded flat or running triangle, then within it there may be a new low below its start at 13.929.
WEEKLY CHART – COMBINATION
Click chart to enlarge.
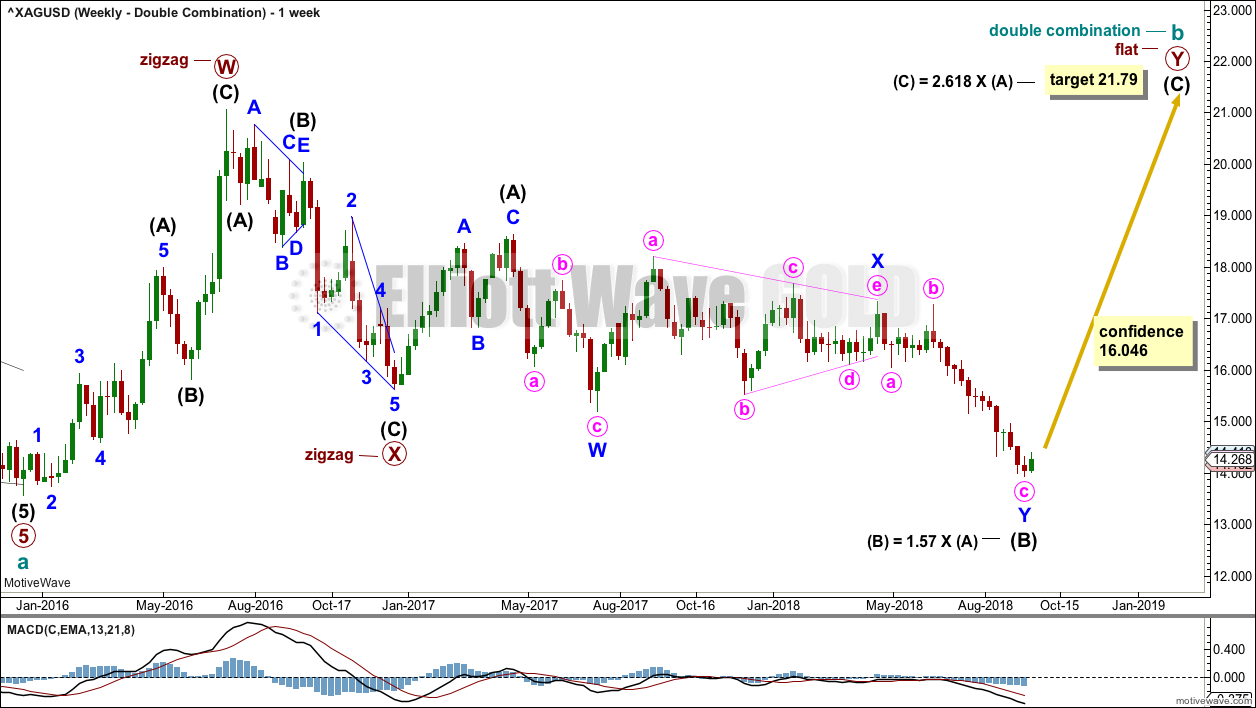
Cycle wave b may still be completing as a double combination: zigzag – X – flat. The second structure, a flat correction for primary wave Y, may be underway.
Within a flat correction, intermediate wave (B) has now met and passed the minimum 0.9 length of intermediate wave (A) at 15.938.
The purpose of combinations is to take up time and move price sideways. To achieve this purpose the second structure in the double normally ends about the same level as the first.
Intermediate wave (B) may be over. Intermediate wave (C) may now begin as a large five wave motive structure higher. A target is calculated for intermediate wave (C) that expects it to end reasonably close to the 21.062, so that primary wave Y ends about the same level as primary wave W.
DAILY CHART – COMBINATION
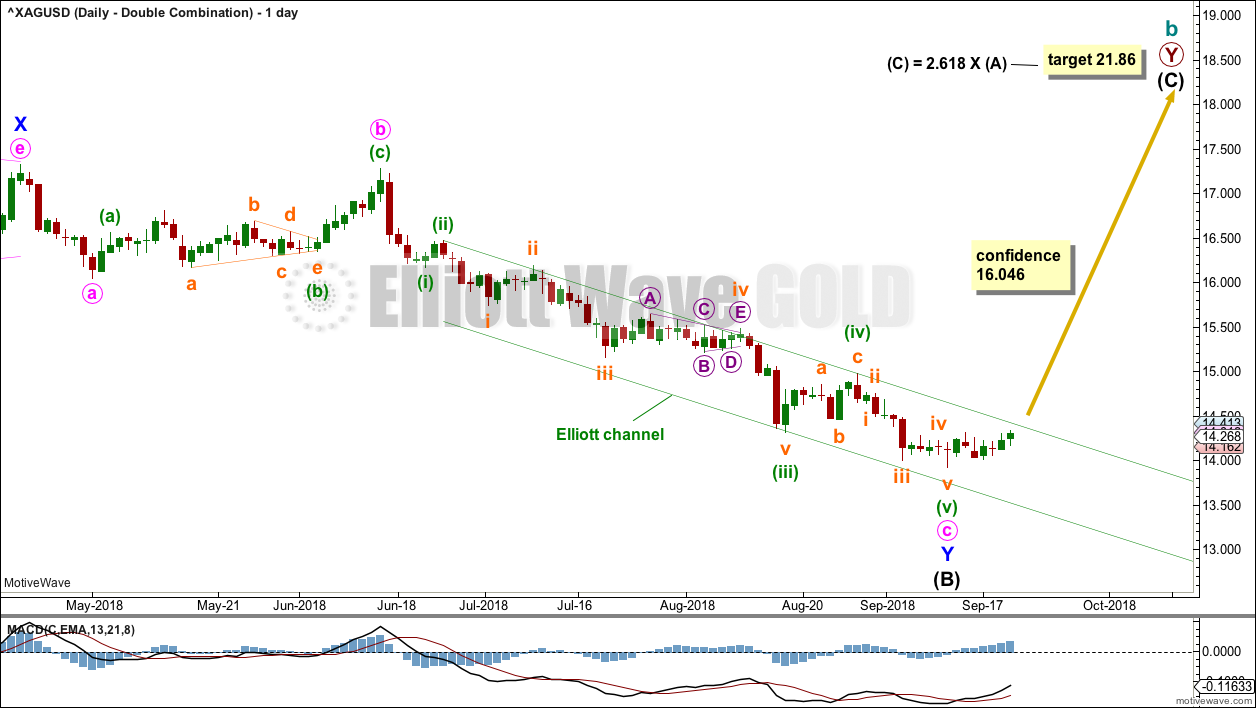
Click chart to enlarge.
Within the zigzag of minor wave Y, minute wave c may again be a complete five wave structure.
A new high above 16.046 would invalidate the first triangle wave count and offer some confidence in this combination wave count. At that stage, the downwards breakout may be considered false and a new upwards wave may be underway. This wave count does not have good support from classic technical analysis.
ALTERNATE WAVE COUNTS
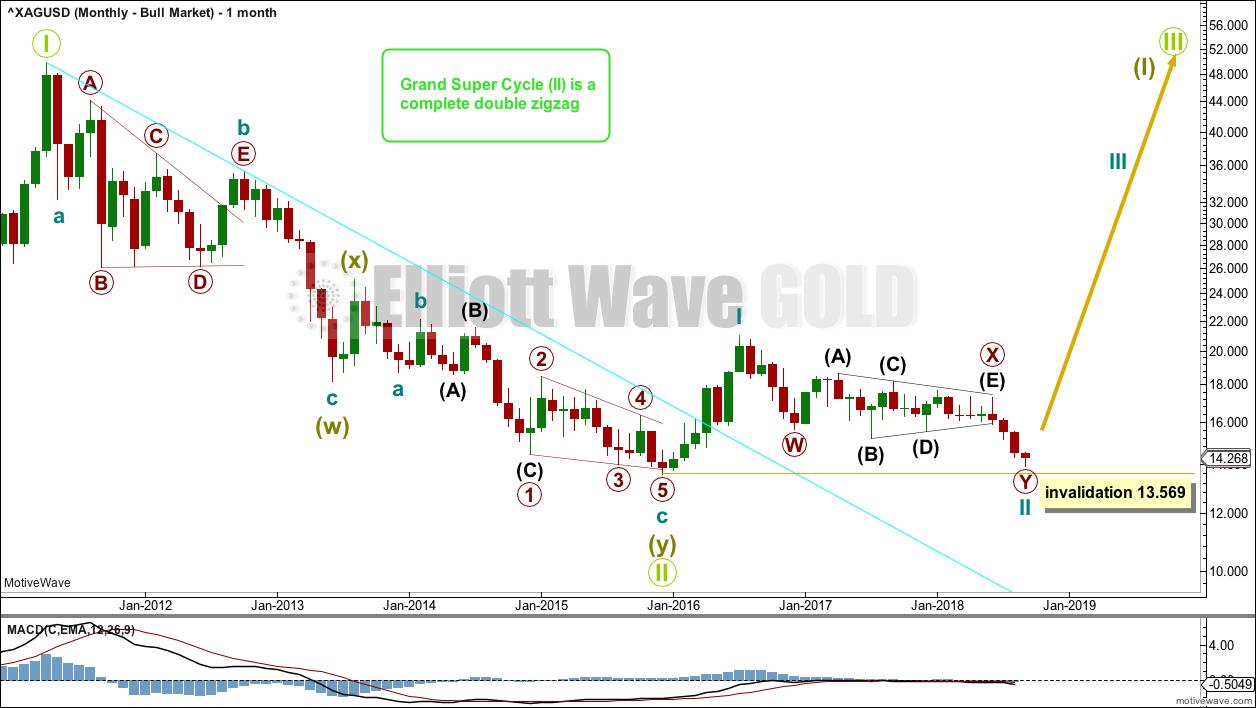
MONTHLY CHART – BULL WAVE COUNT
Click chart to enlarge.
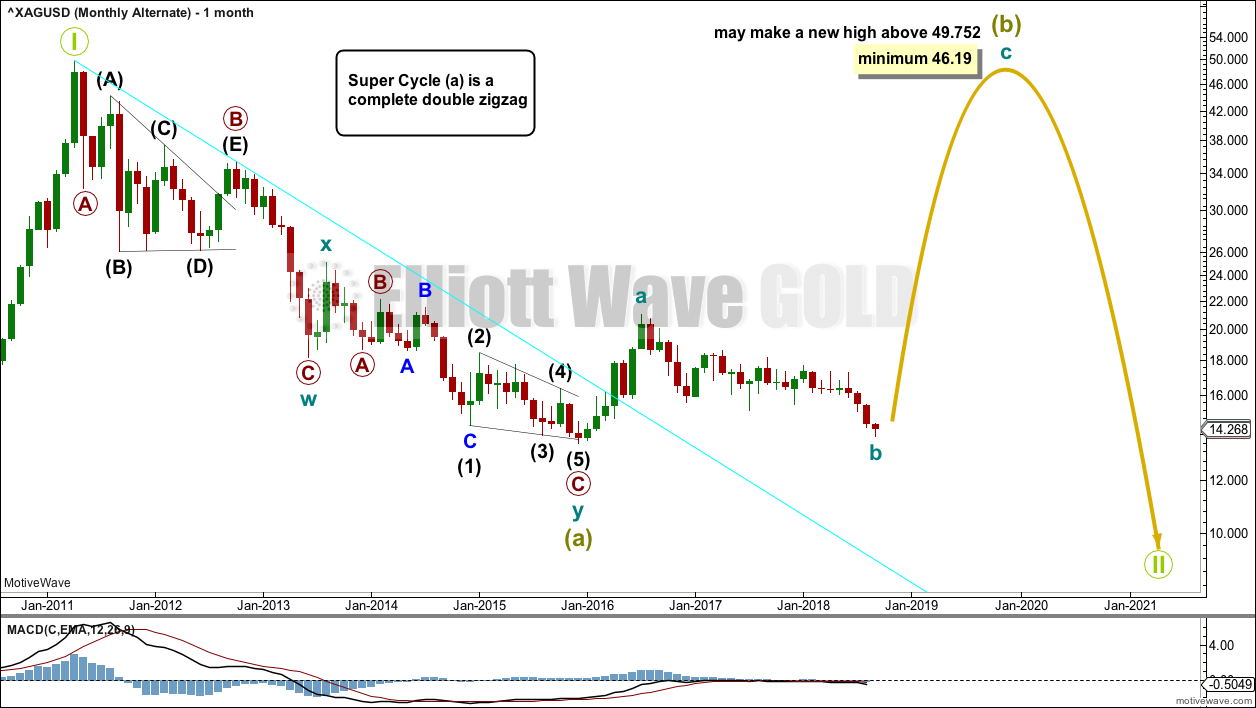
This alternate wave count looks at the possibility that the bear market may be over for Silver and a new bull market may have begun.
Grand Super Cycle wave II may be a complete double zigzag. Within this structure, there is a typically brief and shallow super cycle wave (x). The brevity of this X wave is acceptable within this structure.
If Grand Super Cycle wave II is complete, then a new substantial bull market may be in the very early stages for silver.
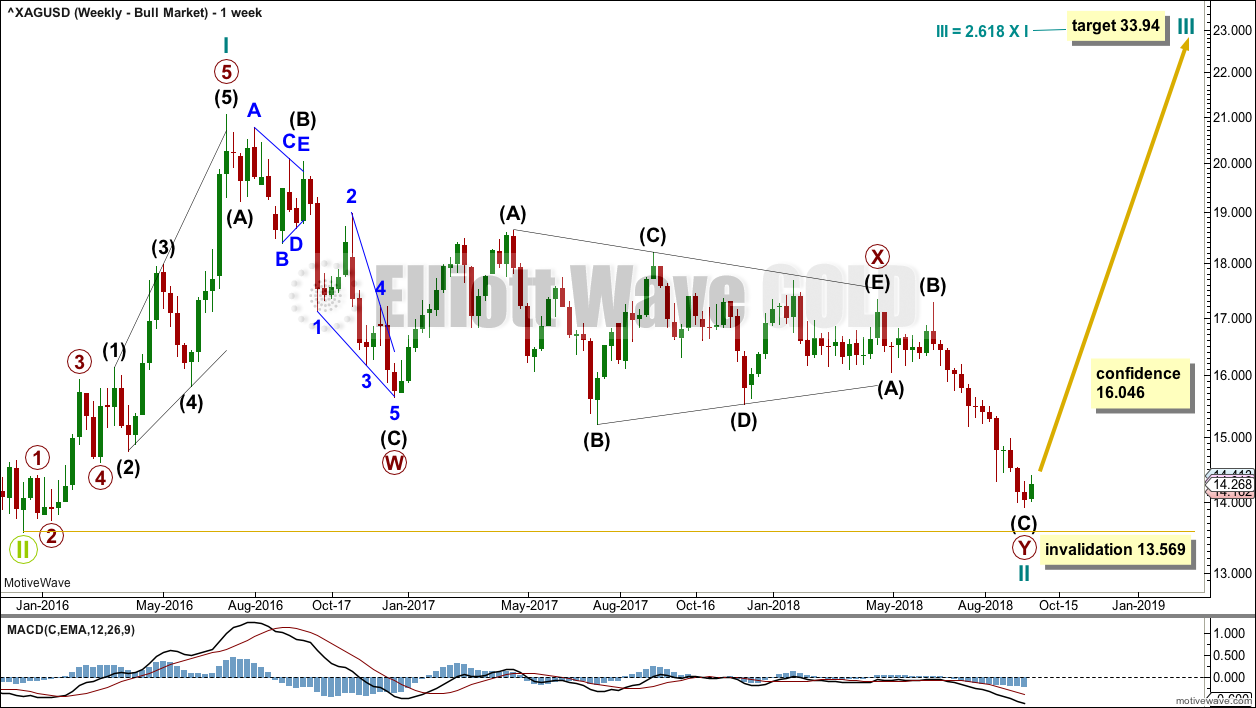
WEEKLY CHART – BULL WAVE COUNT
Click chart to enlarge.
Cycle wave II may be a complete double zigzag. Cycle wave II would be very deep at 0.95 of cycle wave I. This is typical behaviour for the first second wave correction within a new trend for commodities.
If it continues any further, then cycle wave II may not move beyond the start of cycle wave I below 13.569.
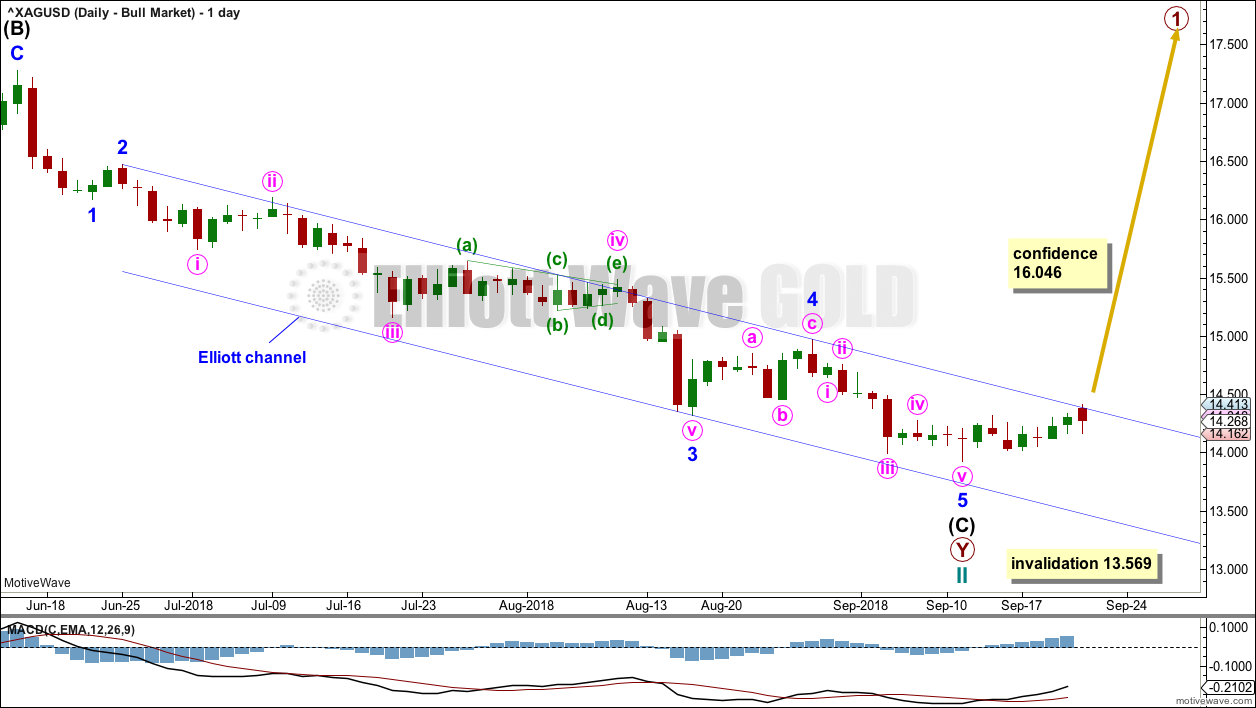
DAILY CHART – BULL WAVE COUNT
Click chart to enlarge.
A five wave impulse for intermediate wave (C) may be complete for this wave count.
This wave count at the end of this week now has a little support from classic technical analysis.
MONTHLY CHART – SECOND ALTERNATE WAVE COUNT
Click chart to enlarge.
By simply moving the degree of labelling all back down one degree, within the last bear market from April 2011 to December 2015, it is possible that Grand Super Cycle wave II is an incomplete flat correction.
If super cycle wave (a) is a double zigzag, then Grand Super Cycle wave II may not continue further as a combination because multiples may not subdivide into multiples.
If super cycle wave (a) is a corrective structure, then Grand Super Cycle wave II may be unfolding as a flat correction. Within the flat correction, super cycle wave (b) must retrace a minimum 0.9 length of super cycle wave (a), and may make a new high above the start of super cycle wave (a) as in an expanded flat.
Grand Super Cycle wave II may not unfold as a triangle. Triangles may not occur as the sole corrective structure in a second wave position.
This wave count does not diverge in expected direction from the bullish wave count at this time, and may not diverge for some years. It will be left as another possibility to consider if it remains valid in another one to few years time.
TECHNICAL ANALYSIS
WEEKLY CHART
Click chart to enlarge. Chart courtesy of StockCharts.com.
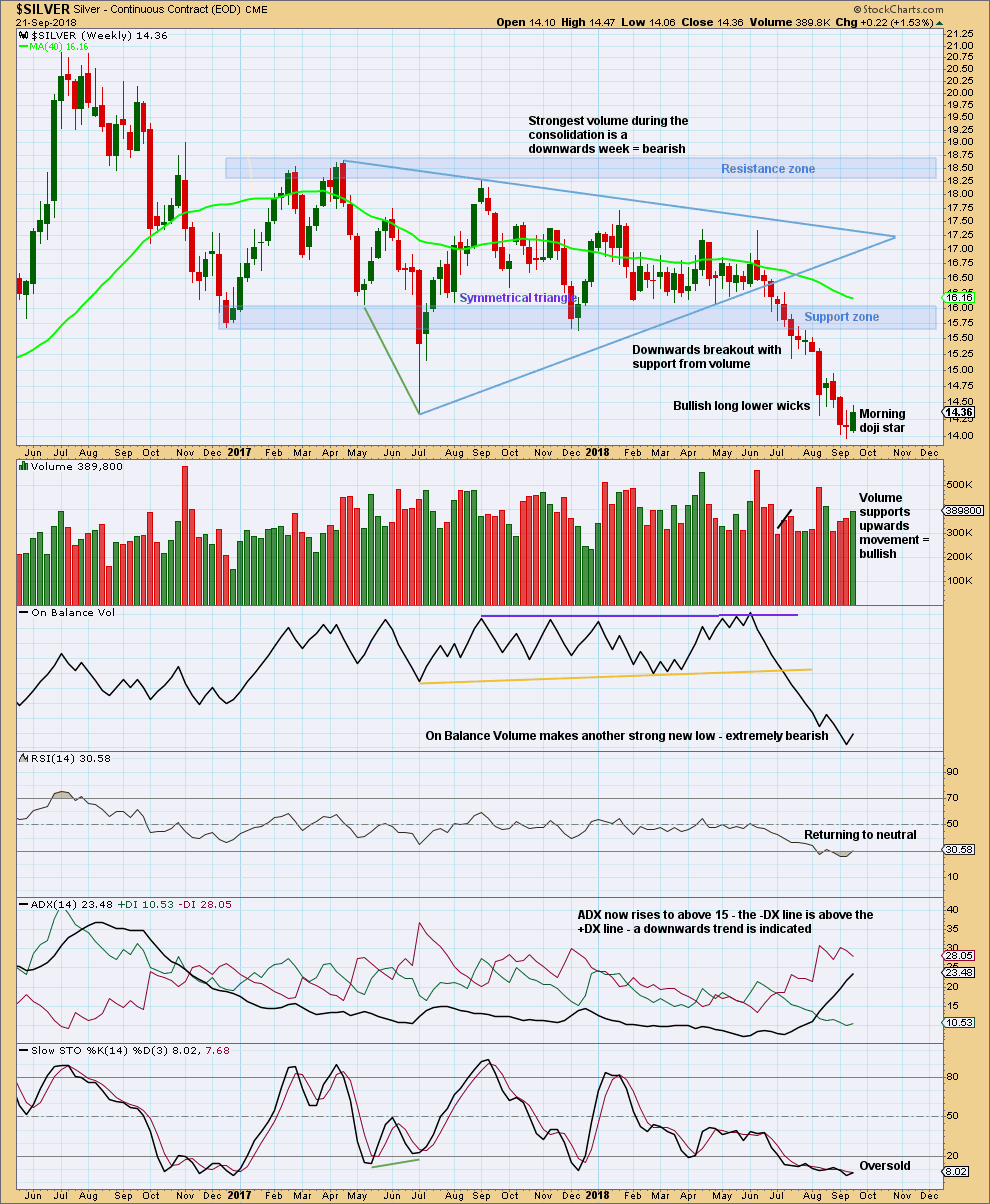
Silver has seen a classic downwards breakout from the shaded support zone, which then provided resistance for a small back test. It is possible that another back test may come.
ADX is giving the strongest signal it can give, rising from a low level below both directional lines. The trend is not yet extreme.
It looks like for the short to mid term a low is in place; the Morning Doji Star candlestick reversal pattern should be given reasonable weight here. If members opened short positions just after the breakout, then they may like to consider taking profits.
It is possible that price may now consolidate or bounce up to test resistance at prior support.
A target from the breakout of the symmetrical triangle is about 12.08.
DAILY CHART
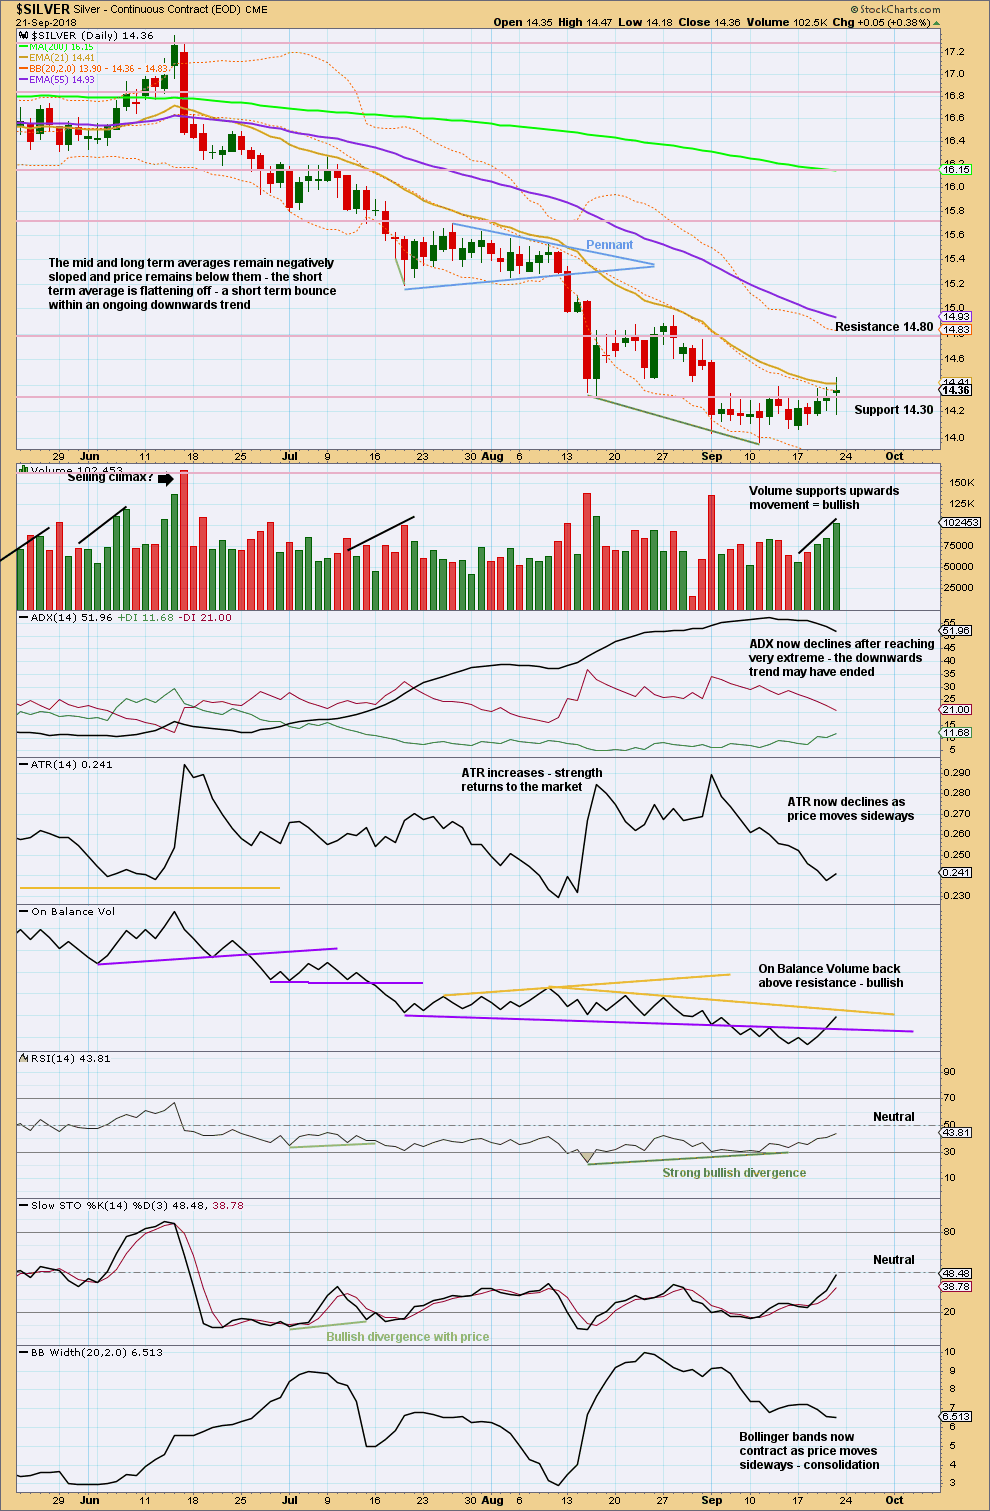
Click chart to enlarge. Chart courtesy of StockCharts.com.
Upwards or sideways movement looks most likely for next week. Next resistance is about 14.80, and for the mid term final resistance may be about 15.60.
Published @ 10:20 p.m. EST on 22nd September, 2018.
—
Careful risk management protects your trading account(s).
Follow my two Golden Rules:
1. Always trade with stops.
2. Risk only 1-5% of equity on any one trade.