
A consolidation was expected for last week, but Silver has moved lower.
The trend has been identified as down since the break below support on the 17th of July.
Summary: A classic downwards breakout from a very long held consolidation has occurred.
The trend is down. Bounces and consolidations may be used as opportunities to join the trend.
Downwards movement is deeply oversold and volume has all but disappeared. Look out for a bounce here. The preferred Elliott wave count has a target at 15.705. If this unfolds as expected, it may present an excellent opportunity for short positions when the bounce is complete.
Last monthly charts can be viewed here.
New updates to this analysis are in bold.
ELLIOTT WAVE COUNTS
WEEKLY CHART – TRIANGLE
Click chart to enlarge.
This first wave count has good support from classic technical analysis, so it will be favoured. This wave count looks highly likely.
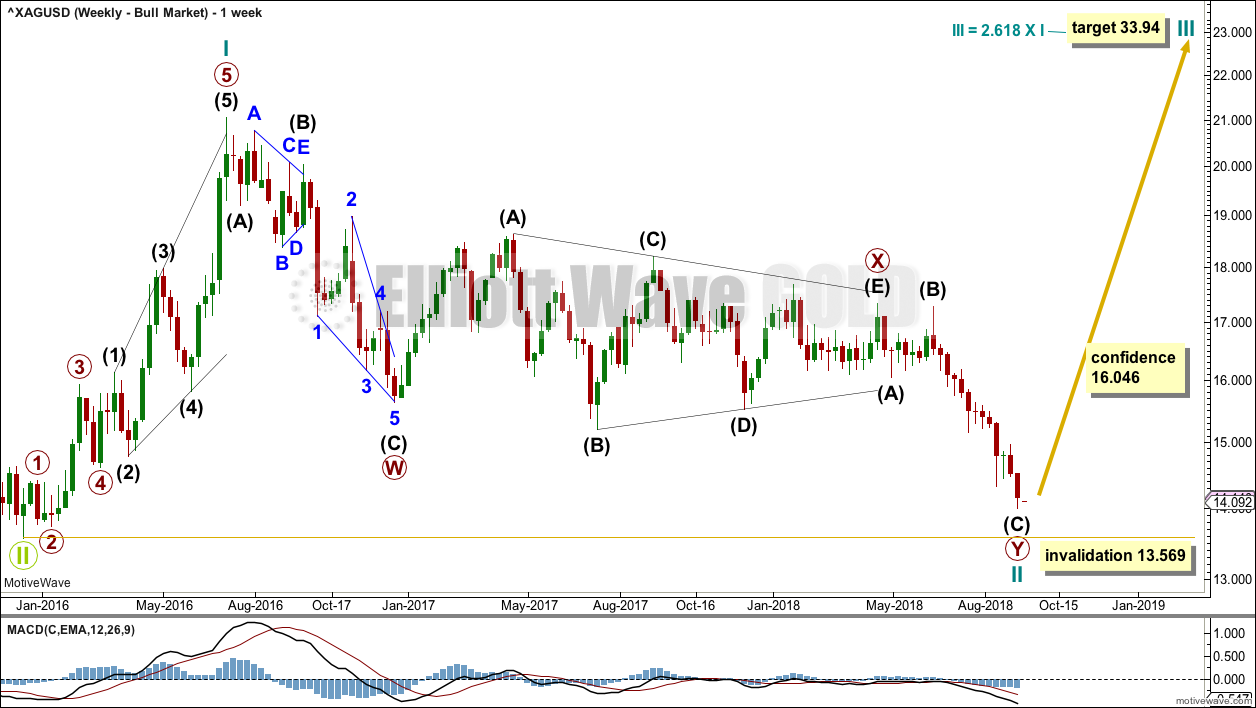
The first wave count expects that the bear market, which began from the April 2011 high, is incomplete.
Cycle wave a is seen as a five wave impulse for this main wave count. There are multiple corrective structures possible still for cycle wave b.
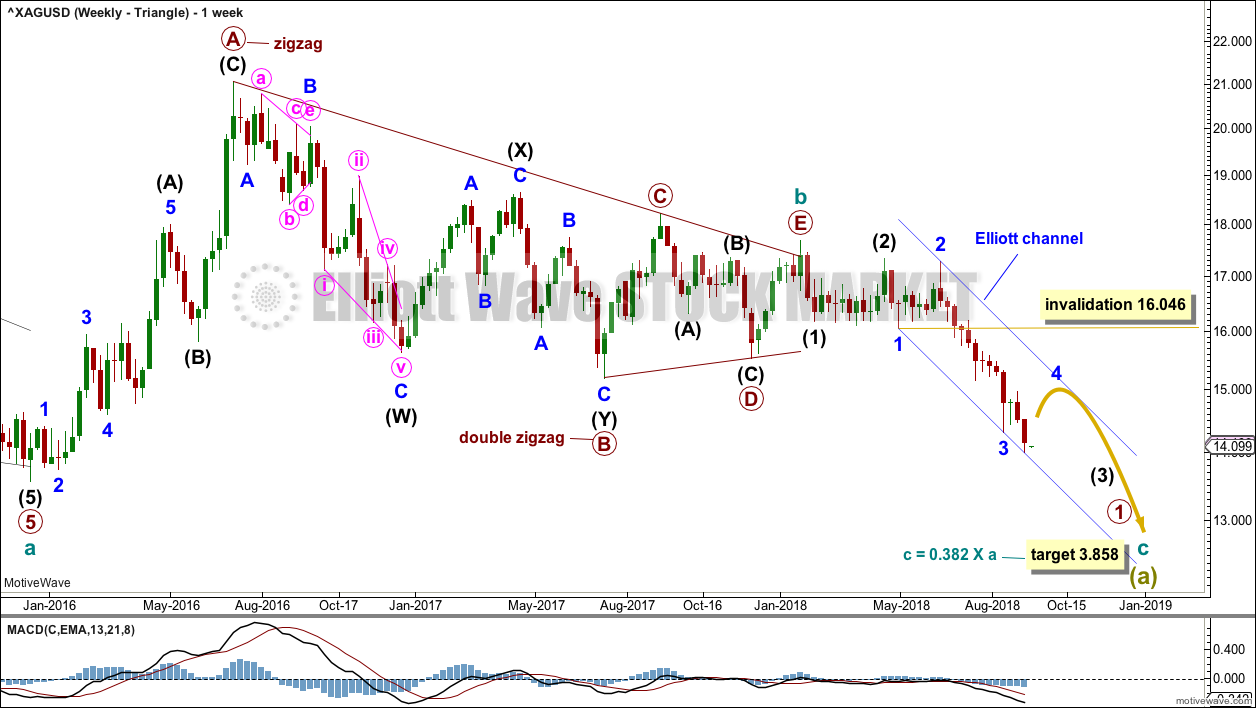
This first weekly chart sees cycle wave b as a now possibly complete regular contracting triangle.
Primary wave E of the triangle may have ended with an overshoot of the A-C trend line.
So far, within the new downwards trend, minor wave 3 may now be over with a selling climax. This is typical behaviour of commodities.
Minor wave 4 may now unfold sideways. Minor wave 4 may not move into minor wave 1 price territory above 16.046.
Draw an Elliott channel about downwards movement as shown. Copy it over to the daily chart. Minor wave 4 may find resistance about the upper edge, if it gets that high.
DAILY CHART – TRIANGLE
Click chart to enlarge.
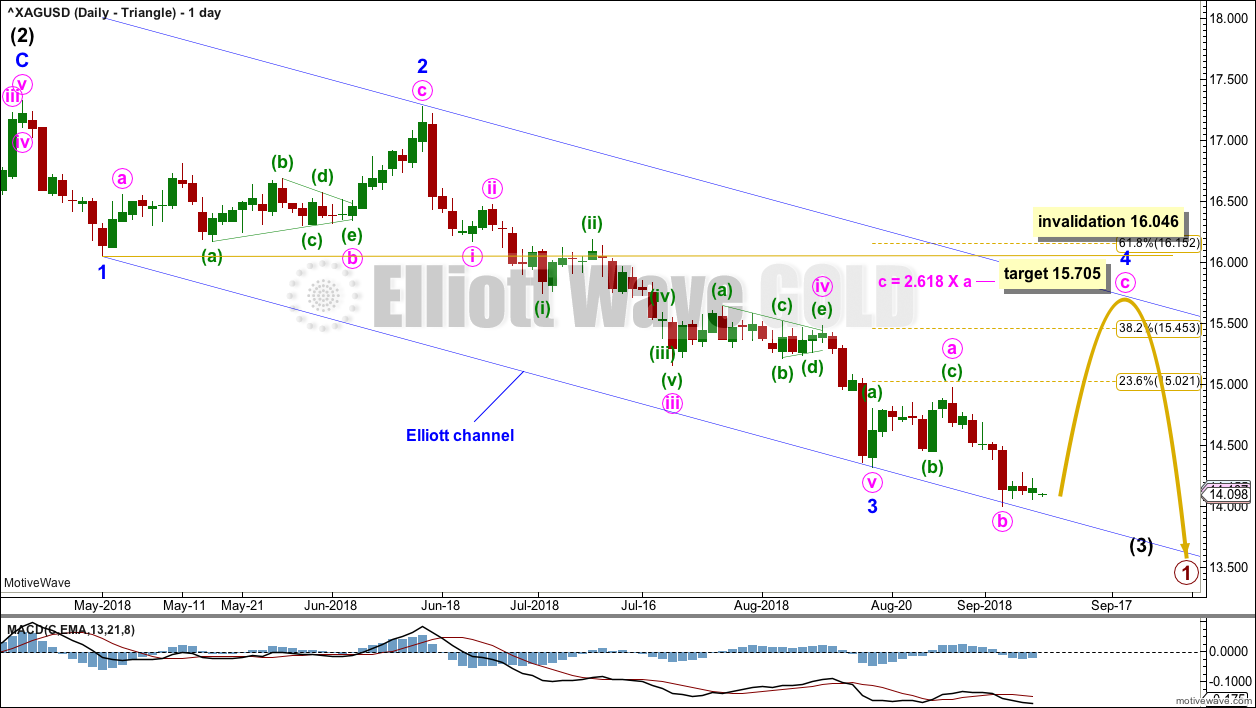
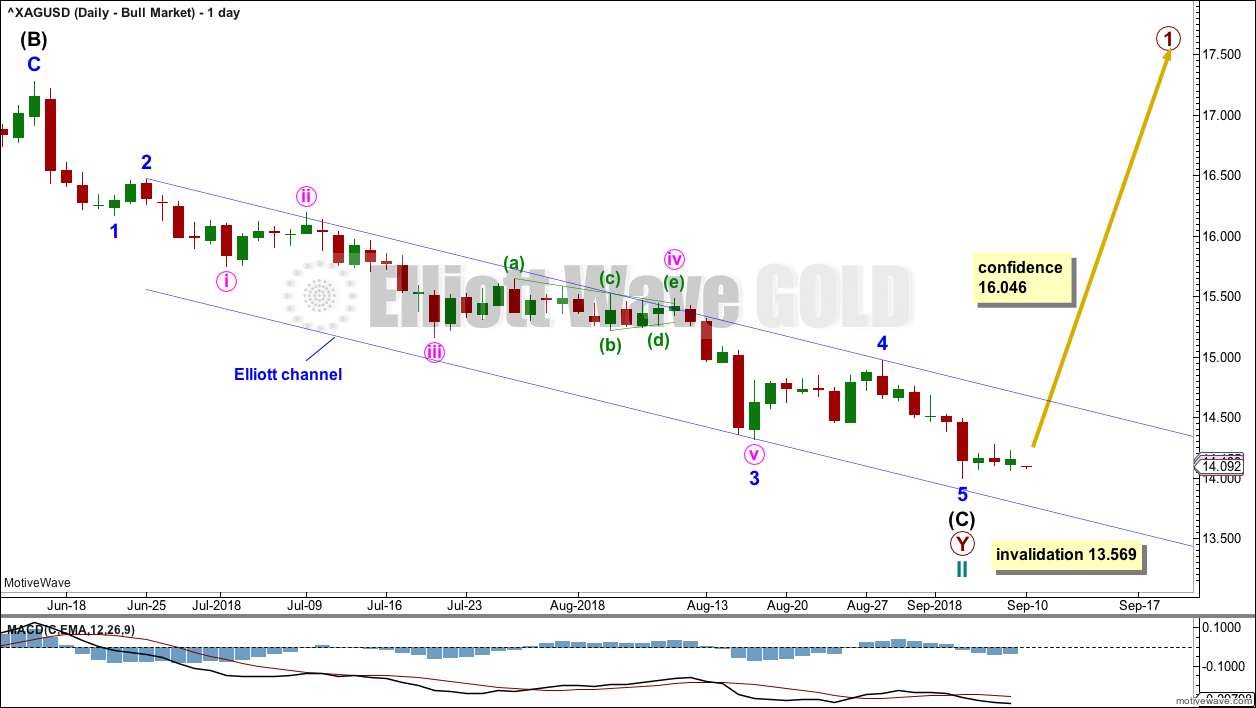
Intermediate wave (3) may only subdivide as an impulse. Within intermediate wave (3), minor waves 1, and now 3 may now be complete.
Minor wave 2 was a very deep 0.96 zigzag lasting 32 days (6 weeks). Given the guideline of alternation, minor wave 4 may be expected to most likely be a shallow sideways flat, triangle or combination. The 0.382 Fibonacci ratio would be a reasonable target.
Minor wave 4 may last anywhere from 3 to 13 weeks to show reasonable proportion. So far it has lasted 3 weeks. However, Silver does not always exhibit good proportion.
Minor wave 4 may now be unfolding as an expanded flat or running triangle. Within either of these structures, minute waves a and b may now be over. A target is calculated for minute wave c of an expanded flat. If minor wave 4 continues as a triangle, the target would not be reached and price may only move sideways for a few weeks.
WEEKLY CHART – COMBINATION
Click chart to enlarge.
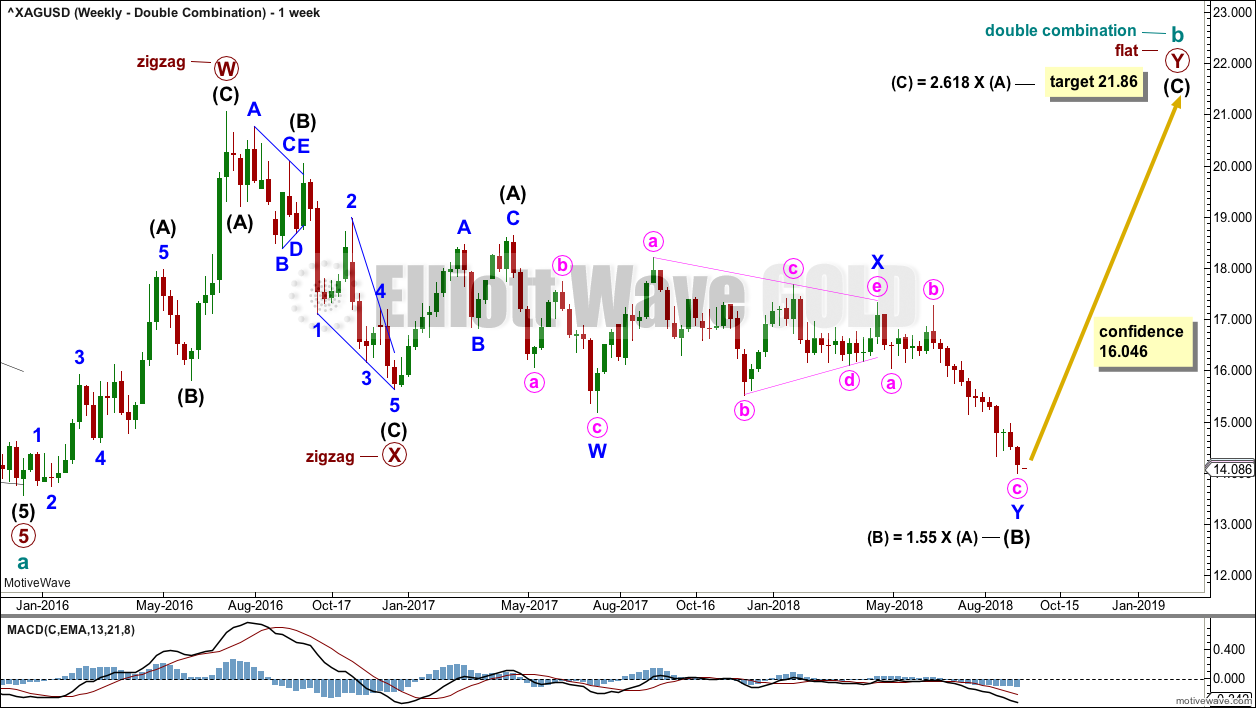
Cycle wave b may still be completing as a double combination: zigzag – X – flat. The second structure, a flat correction for primary wave Y, may be underway.
Within a flat correction, intermediate wave (B) has now met and passed the minimum 0.9 length of intermediate wave (A) at 15.938.
The purpose of combinations is to take up time and move price sideways. To achieve this purpose the second structure in the double normally ends about the same level as the first.
Intermediate wave (B) may again be over. Intermediate wave (C) may now begin as a large five wave motive structure higher. A target is re-calculated for intermediate wave (C) that expects it to end reasonably close to the 21.062, so that primary wave Y ends about the same level as primary wave W.
DAILY CHART – COMBINATION
Click chart to enlarge.
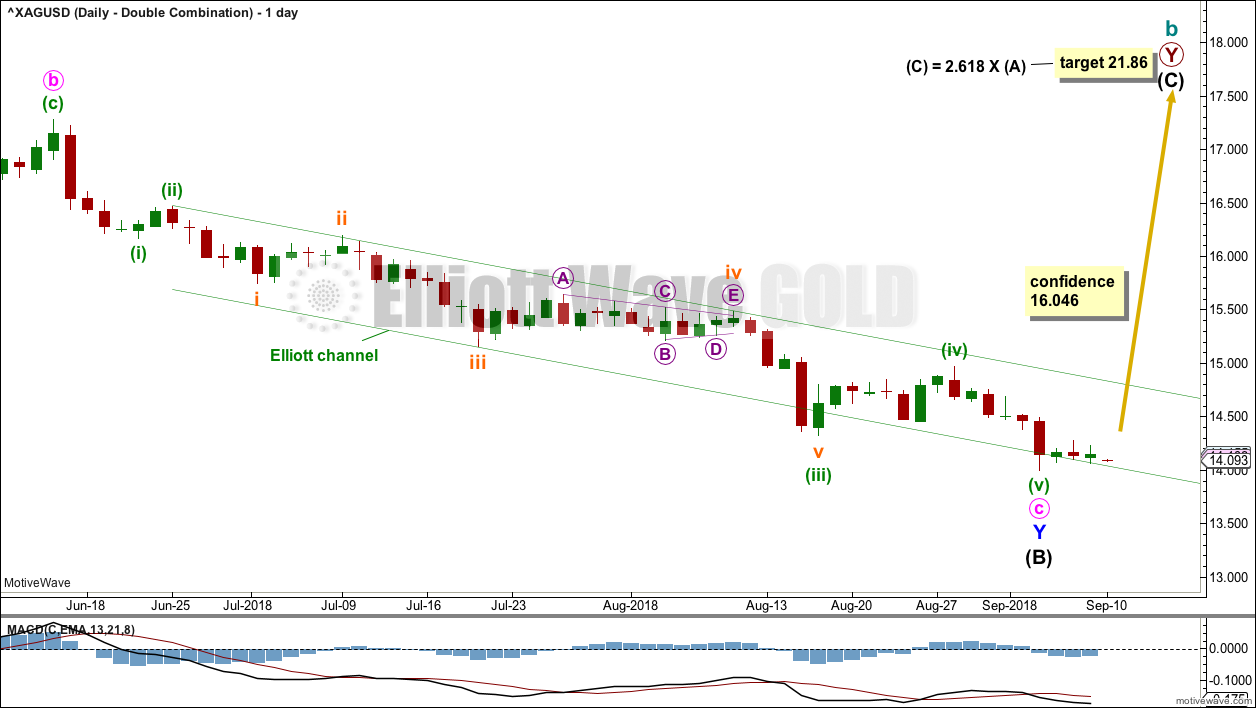
Within the zigzag of minor wave Y, minute wave c may again be a complete five wave structure.
A new high above 16.046 would invalidate the first triangle wave count and offer some confidence in this combination wave count. At that stage, the downwards breakout may be considered false and a new upwards wave may be underway. This wave count does not have good support from classic technical analysis.
WEEKLY CHART – BULL WAVE COUNT
Click chart to enlarge.
This alternate wave count looks at the possibility that the bear market may be over for Silver and a new bull market may have begun.
Cycle wave II may be a complete double zigzag. Cycle wave II would be very deep at 0.90 of cycle wave I. This is typical behaviour for the first second wave correction within a new trend for commodities.
If it continues any further, then cycle wave II may not move beyond the start of cycle wave I below 13.569.
DAILY CHART – BULL WAVE COUNT
Click chart to enlarge.
A five wave impulse for intermediate wave (C) may be complete for this wave count.
This wave count does not have support from classic technical analysis. It is judged to have a very low probability.
TECHNICAL ANALYSIS
WEEKLY CHART
Click chart to enlarge. Chart courtesy of StockCharts.com.
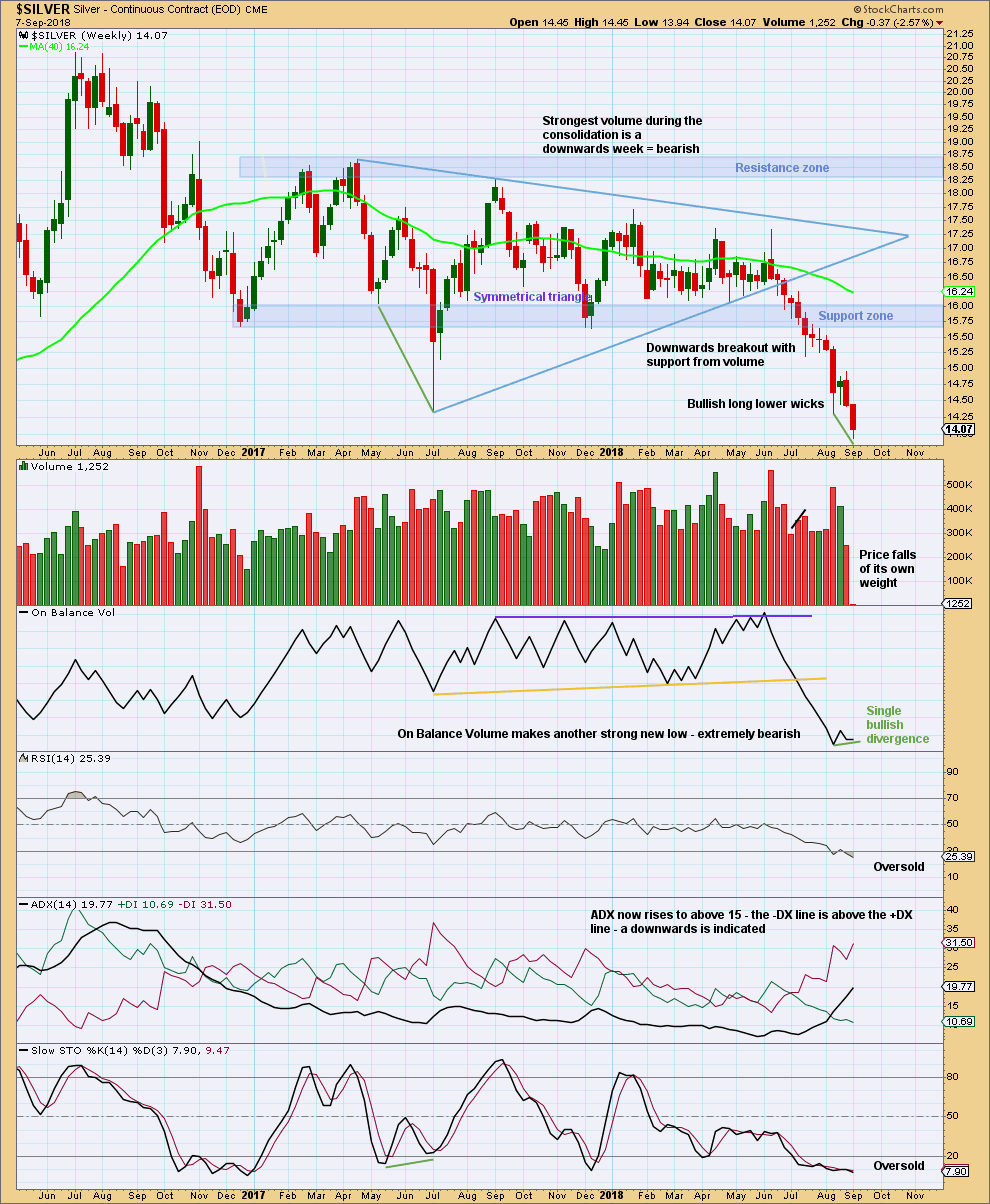
Silver has seen a classic downwards breakout from the shaded support zone, which then provided resistance for a small back test. It is possible that another back test may come.
ADX is giving the strongest signal it can give, rising from a low level below both directional lines. This indicates a trend in the early stages.
Volume for the last week is minuscule, so much so that it looks suspicious. If this data is correct, then it offers very strong support to the triangle Elliott wave count; there should be something “off” or “wrong” about B waves, and this volume looks very off.
A target from the breakout of the symmetrical triangle is about 12.08.
DAILY CHART
Click chart to enlarge. Chart courtesy of StockCharts.com.
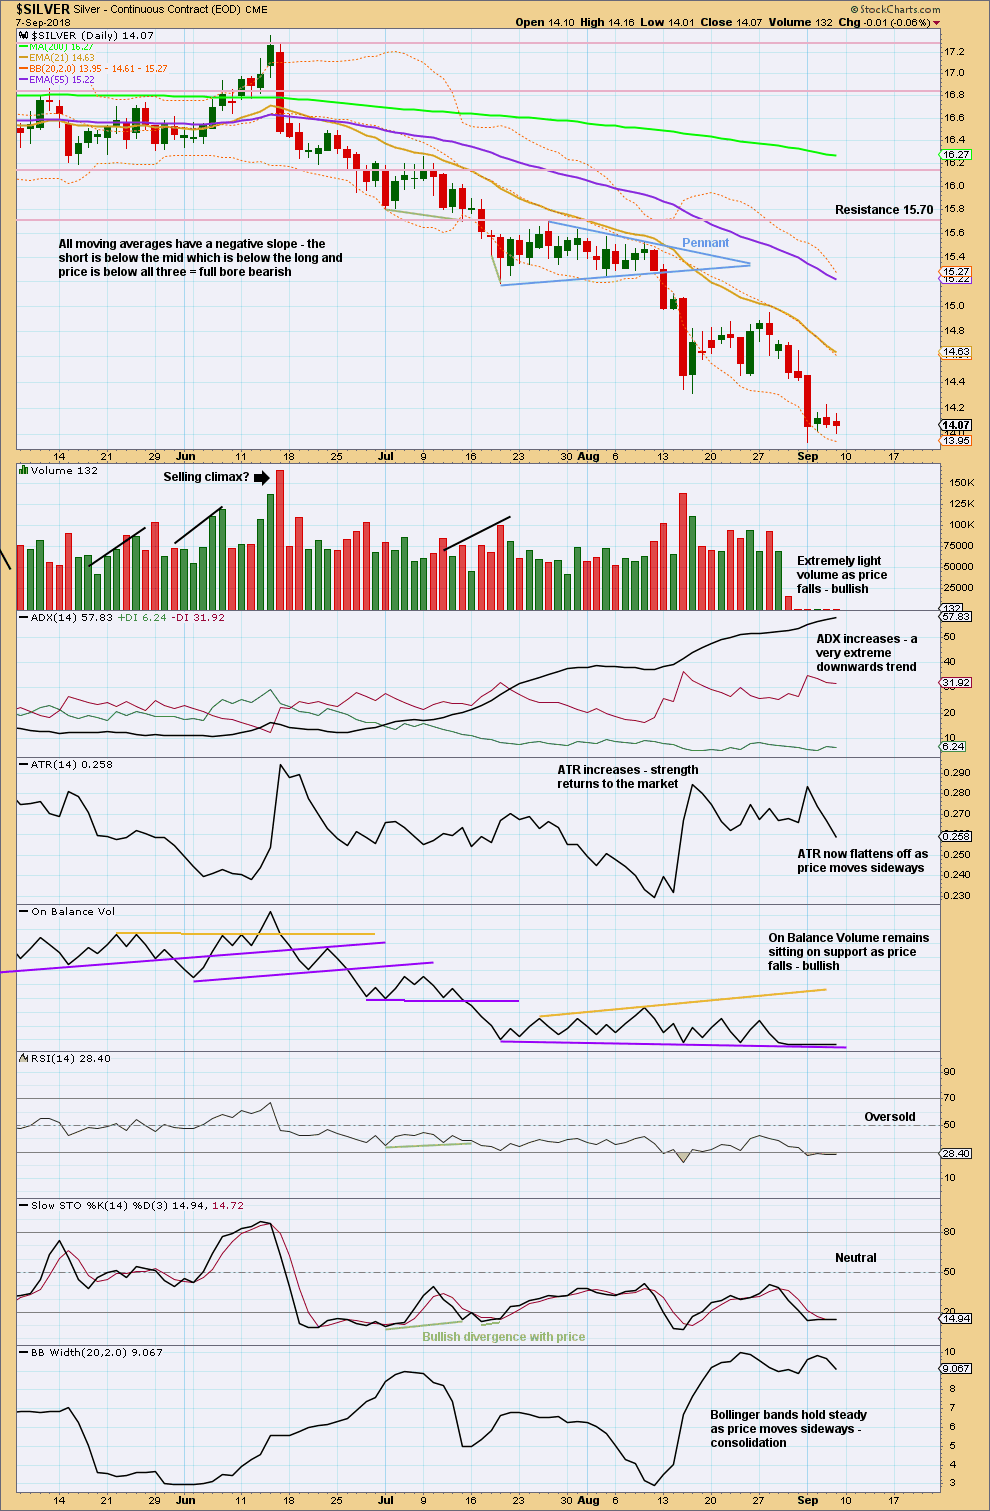
Look now for a consolidation or bounce to backtest resistance at prior support, which is about 15.70. If this happens and price gets up that high, then look out for a sharp reversal and the new downwards trend to continue in earnest.
This is one of the simplest trade set ups: look for a long consolidation (the longer the better) with clearly identified support and resistance, then look for a breakout and back test, then enter in the direction of the breakout.
If Silver behaves like this for us in the next few weeks, it may offer a very good high probability trade entry point for a long term trade that may possibly be able to run for a year.
For the short term, with ADX so extreme, some consolidation may be expected.
If volume data is to be believed, then the strong downwards day of Tuesday 3rd September was unusually light. This looks suspicious, but it may be because downwards movement is a B wave.
Published @ 04:12 a.m. EST on 10th September, 2018.
—
Careful risk management protects your trading account(s).
Follow my two Golden Rules:
1. Always trade with stops.
2. Risk only 1-5% of equity on any one trade.