
ELLIOTT WAVE ANALYSIS
MONTHLY CHART
Click chart to enlarge.
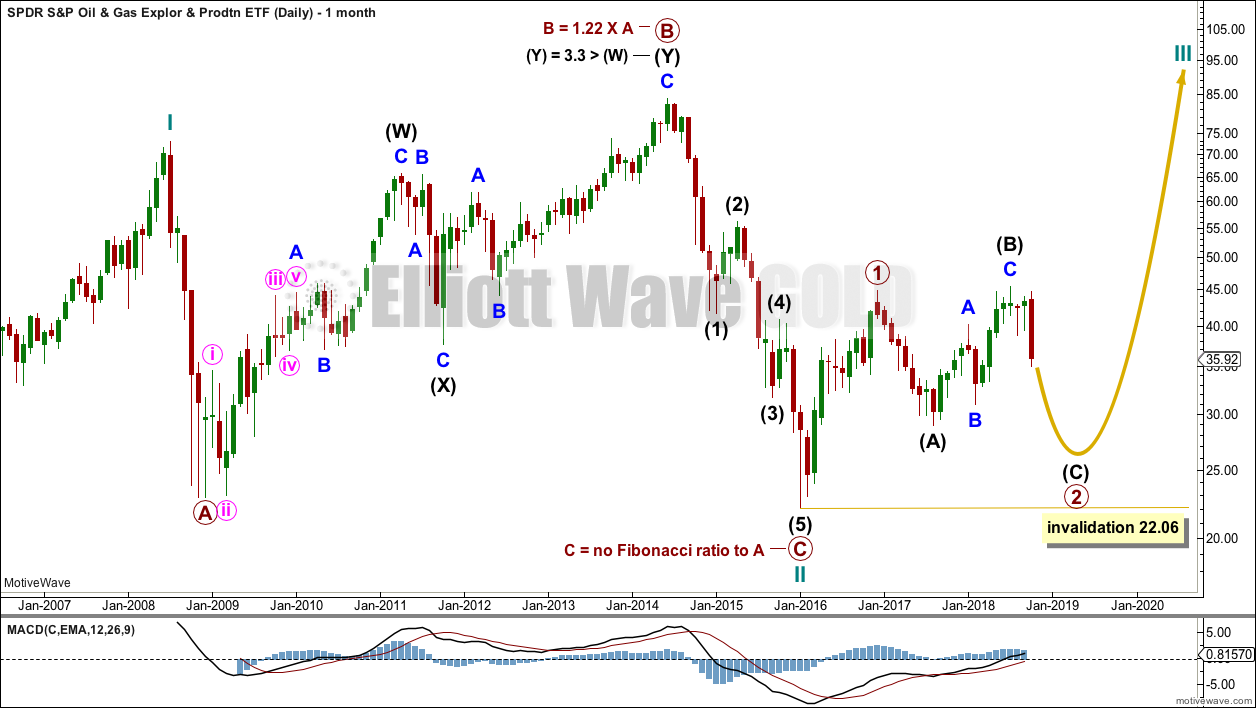
A very large expanded flat may have ended at the last low. This is labelled cycle wave II.
Within cycle wave II, primary wave B is within the normal range of up to 1.38 times the length of primary wave A. Primary wave C moves below the end of primary wave A avoiding a truncation and a rare running flat.
If this part of the wave count is correctly labelled, then the bear market may be over for XOP. A three wave structure moving lower indicates the larger trend may be upwards.
The alternate idea would be that this expanded flat may be only wave W of a double flat or combination; the correction would continue sideways for a few more years.
WEEKLY CHART
Click chart to enlarge.
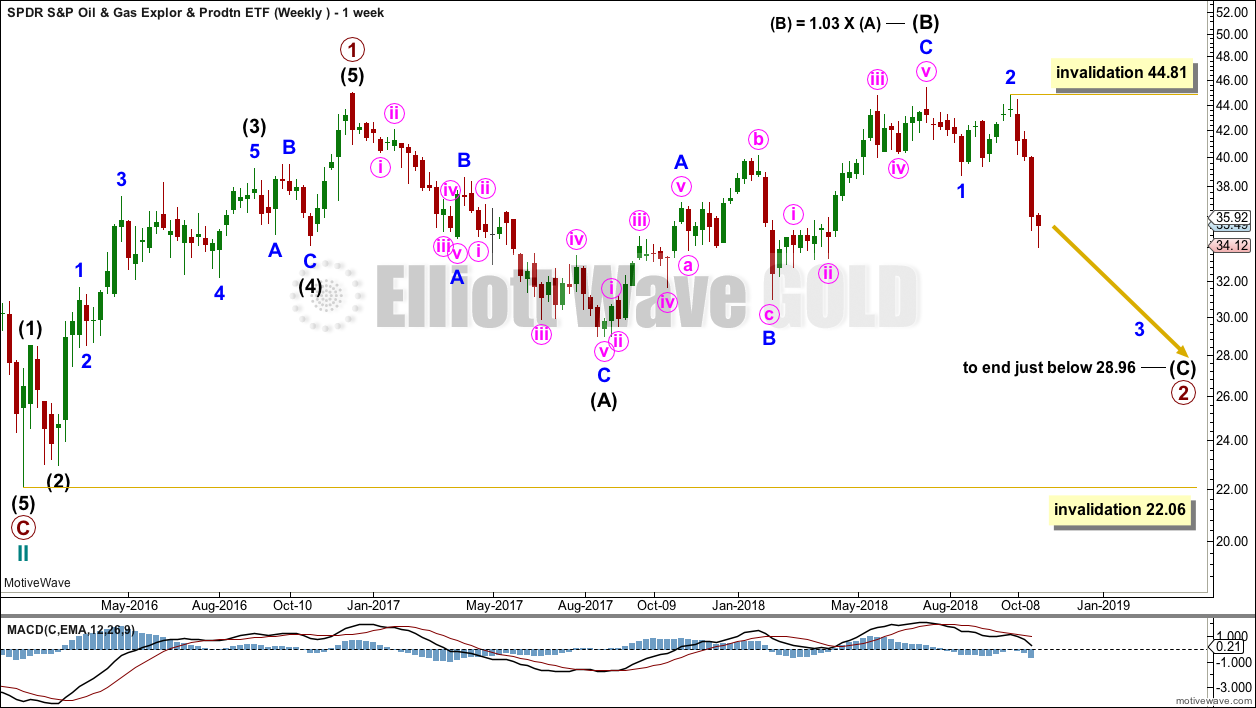
From the end of cycle wave II, a five up may have completed. This is labelled primary wave 1.
Primary wave 2 may be an incomplete regular flat correction. Regular flats usually have C waves that end slightly beyond the end of their A waves.
Intermediate wave (C) must subdivide as a five wave structure. So far minor waves 1 and 2 may be complete. Minor wave 3 may only subdivide as an impulse. Strong downwards movement last week fits expectations for a third wave.
Primary wave 2 may not move beyond the start of primary wave 1 below 22.06.
DAILY CHART

Click chart to enlarge.
Minor wave 3 exhibits strength. It looks like a third wave.
Within minor wave 3, minute wave i and ii may be complete.
Within minute wave iii, minuette waves (i), (ii) and now (iii) may be complete. Minuette wave (iv) may not move into minuette wave (i) price territory above 40.26.
Overall, this wave count expects more downwards movement to at least slightly below 28.96. This target may be met in another few months.
Along the way down, another consolidation to last about one to two months for minor wave 4 may be expected. When it arrives, minor wave 4 may not move into minor wave 1 price territory.
Draw an acceleration channel about downwards movement. Draw the first trend line from the low labelled minor wave 1 to the last low, then place a parallel copy up on the high labelled minor wave 2. As price keeps moving lower, keep redrawing the channel. When minor wave 3 is complete, then the upper edge of this channel may provide resistance for minor wave 4.
TECHNICAL ANALYSIS
Click chart to enlarge.
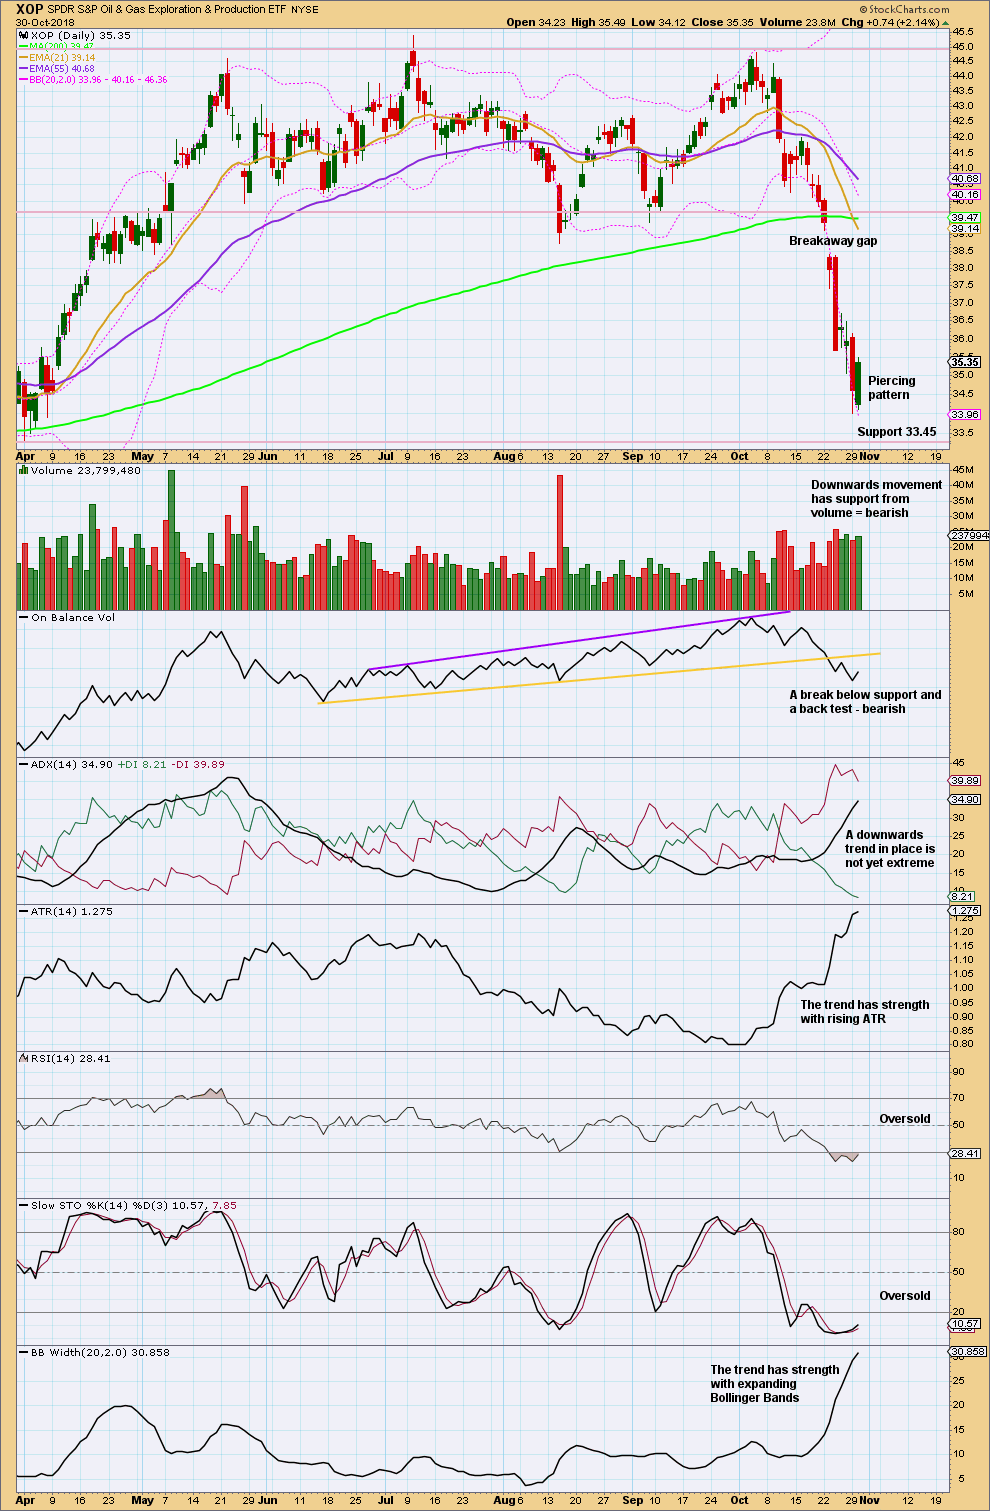
Price consolidated, with support about 39.65 and resistance about 45.00, from the 7th of May 2018 to the 22nd of October 2018.
Price broke out from the consolidation zone on the 22nd of October on a strong downwards day. The following day gapped lower on another strong downwards day with support from volume, creating a breakaway gap. This looks like a classic downwards breakout.
If price bounces up here to test resistance, then expect strong resistance at the breakaway gap at 39.10.
Currently RSI is oversold and there is a bullish candlestick pattern. Expect a small bounce or consolidation here.
The target is about 32.99.
Published @ 02:37 a.m. EST.
—
Careful risk management protects your trading account(s).
Follow my two Golden Rules:
1. Always trade with stops.
2. Risk only 1-5% of equity on any one trade.
Thanks for covering XOP today. Since I’m in DRIP and GUSH this helps a lot. Same with GDX and NUGT & DUST. I’m glad you cover GDX on the GOLD analysis. It’d be nice to see XOP covered on the USOIL analysis.
I second that. I would even pay extra for coverage of xop. The leverage available in this market through etf’s is attractive and less risky than futures.
Excellent… Thanks for doing this, Lara… Very very much appreciated…
Question: Given XOP is probably going to be weak, is it possible that WTIC’s correction will be longer than thought and may go to $55?
Mathieu
There is no reliable correlation between these two markets.
The correlation coefficient can swing from positive (which is is more often) right through 0 to negative.
And so I would not expect one market to move in a certain direction based upon analysis of the other market. They are separate, they can move in opposite directions.
Hi Lara, thank you so much!!! I have a small position which I must get rid of at this bounce and rebuy later. I believe your target of 32.99 is a typo. Can you clarify the short term target for the Bounce? I presuming it would be slightly shy of the break away gap, the new upward resistance. Did you mean 37.99? My plan is to sell the bounce and short against resistance. Your info will prevent a fire in my trading account so thank you! More lessons for me about gaps;)
I calculated the target by taking the widest part of the consolidation and deducting that from the breakout point.
The high on the 10th of July at 45.38 to the low on 15th August at 38.72:
45.38 – 38.72 = 6.66 (widest part of the consolidation)
Breakout point about 39.65 – 6.66 = 32.99
I don’t have a target for the bounce. I would expect it could get up to the breakaway gap to test resistance there, but in bear moves back tests are not so reliable.
I see XOP is bouncing today. I would label this just minuette (iv) or possibly minute iv, not yet minor 4.