
Downwards movement has continued for the week as expected. The target remains the same.
Summary: Oil is in a downwards trend. The probability that Oil may continue to move reasonably below 26.06 has increased.
Trends do not move in straight lines. There will be bounces and consolidations along the way. Look for a candlestick reversal pattern on the daily chart, or a breach of the narrow channel, to signal the first multi-week bounce or consolidation for a second wave. The target for this to begin is at 46.80.
New updates to this analysis are in bold.
MAIN ELLIOTT WAVE COUNT
MONTHLY CHART
Click chart to enlarge.
Classic technical analysis favours a bearish wave count for Oil at this time.
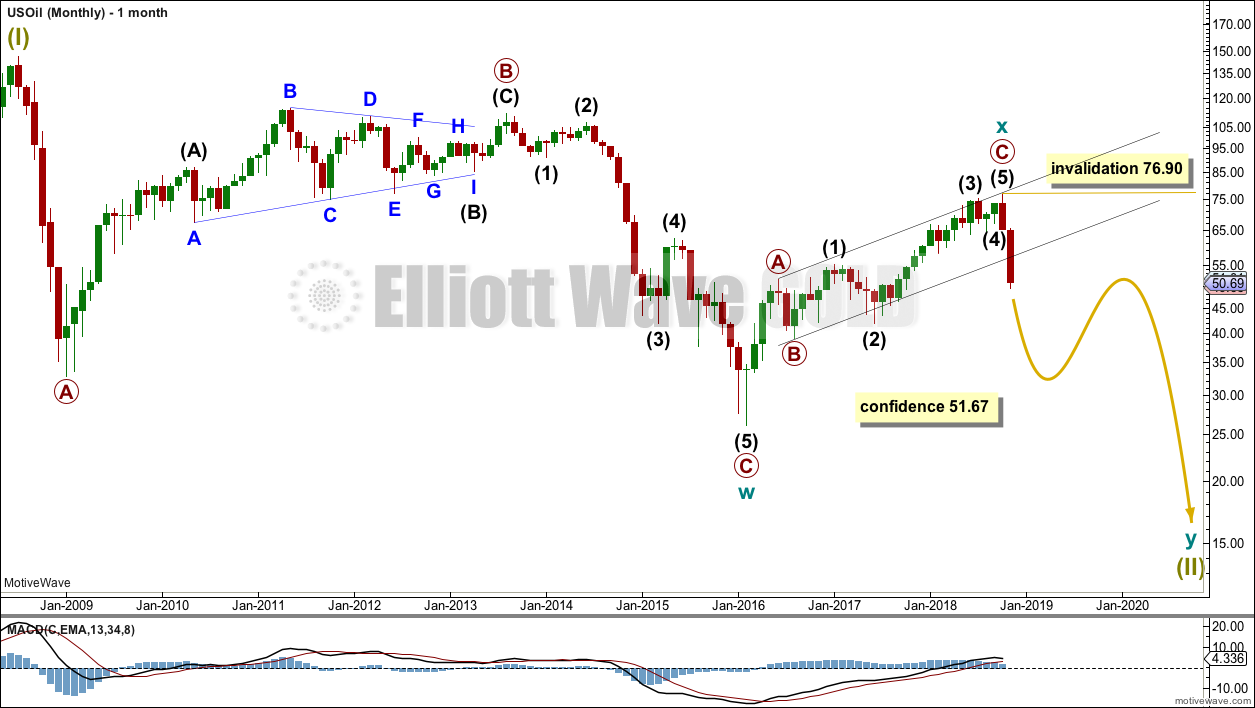
The large fall in price from the high in June 2008 to February 2016 is seen as a complete three wave structure. This large zigzag may have been only the first zigzag in a deeper double zigzag.
The first zigzag down is labelled cycle wave w. The double is joined by a now complete three in the opposite direction, a zigzag labelled cycle wave x.
The purpose of a second zigzag in a double is to deepen the correction when the first zigzag does not move price deep enough. Cycle wave y would be expected to move reasonably below the end of cycle wave w to deepen the correction. Were cycle wave y to reach equality with cycle wave w that takes Oil into negative price territory, which is not possible. Cycle wave y would reach 0.618 the length of cycle wave w at $2.33.
A better target calculation would be using the Fibonacci ratios between primary waves A and C within cycle wave y. This cannot be done until both primary waves A and B are complete.
Within cycle wave y, no second wave correction nor B wave may move beyond its start above 76.90.
WEEKLY CHART
Click chart to enlarge.
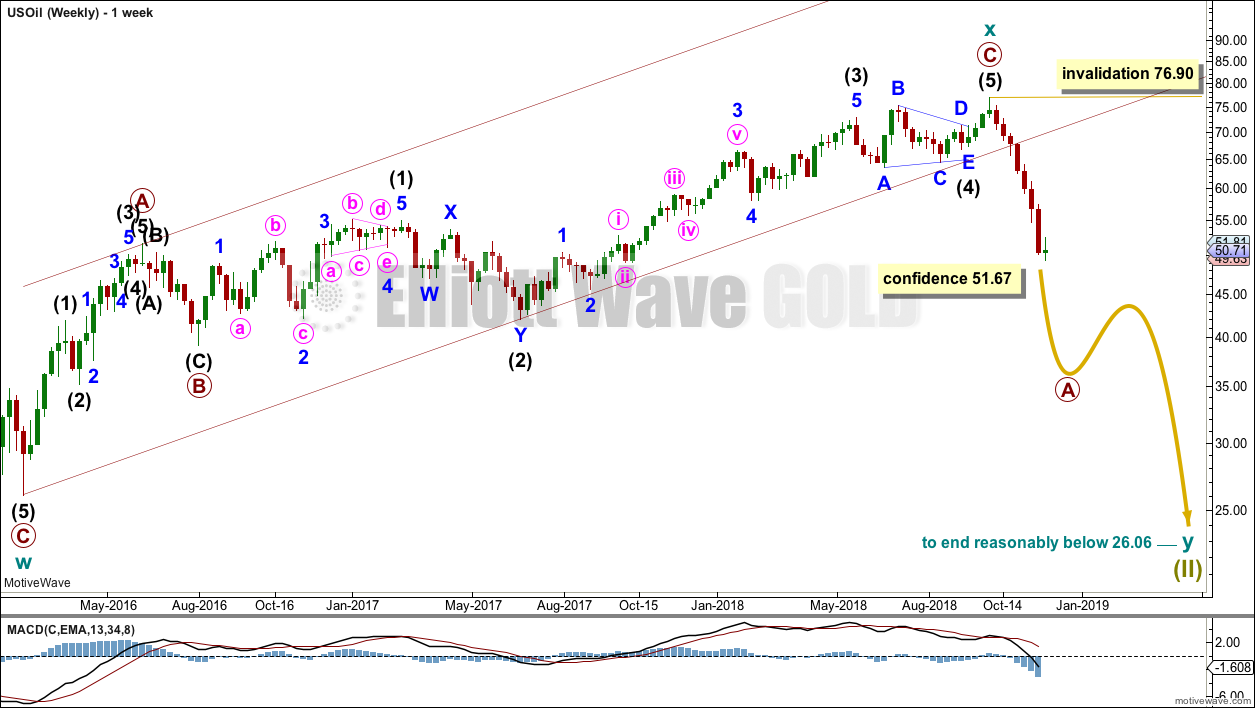
Cycle wave x is seen as a complete zigzag. Within the zigzag, primary wave C is a five wave impulse and within it intermediate wave 4 is a triangle.
A new low below 51.67 has added confidence in this bearish wave count. At that stage, the bullish alternate was invalidated.
DAILY CHART
Click chart to enlarge.
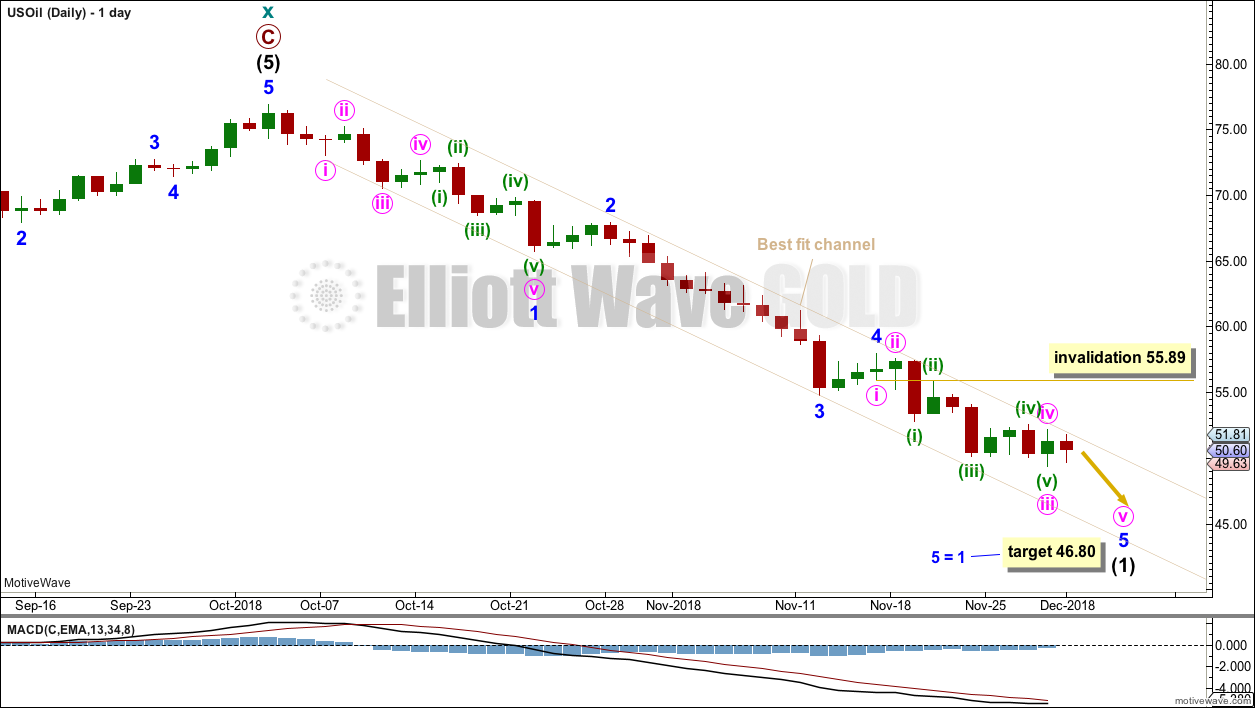
Attention now turns to the structure of downwards movement. An impulse is unfolding lower.
Minor wave 3 is longer than minor wave 1 and does not exhibit a Fibonacci ratio to minor wave 1.
Minor wave 4 has remained contained within the best fit channel.
The most common Fibonacci ratio for minor wave 5 is used to calculate a target for it to end. Minor wave 5 is subdividing as an impulse. Within the impulse, minute waves i through to iv may be complete. If minute wave iv continues, then it may not move into minute wave i price territory above 55.89. However, it should remain contained within the best fit channel.
Intermediate wave (1) may end next week.
However, if this analysis is wrong, it may be in expecting intermediate wave (1) to end sooner than it does. It must be accepted that while price remains within the channel intermediate wave (1) could continue for longer than this analysis expects. Look out for surprises to the downside.
Keep using the best fit channel as the first guide for an upcoming trend change. If the channel is breached by clearly upwards movement (not sideways), that would be an early indication that intermediate wave (1) may be over and intermediate wave (2) may have begun.
TECHNICAL ANALYSIS
MONTHLY CHART
Click chart to enlarge. Chart courtesy of StockCharts.com.
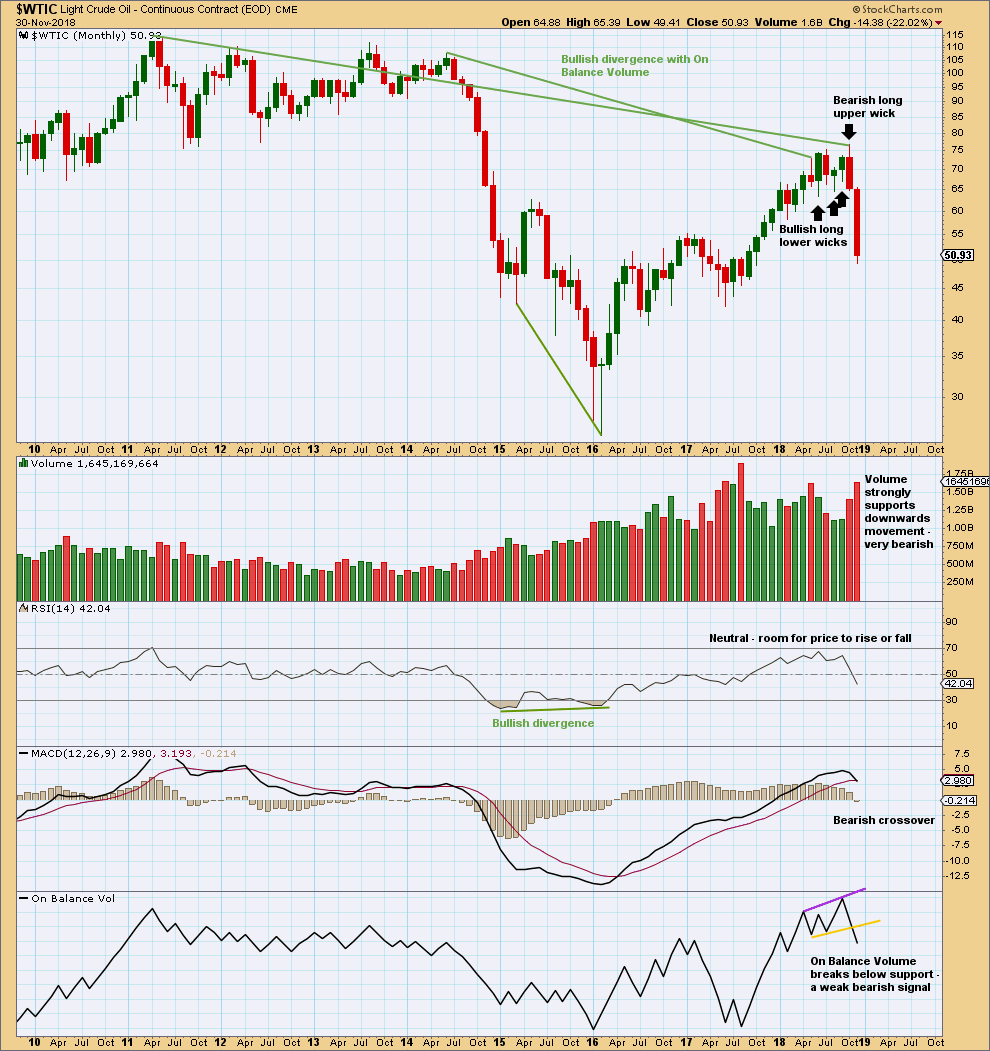
Strong support from volume and no long lower wick this month are very bearish. Expect price to continue falling at this time frame until there is a candlestick reversal pattern or at least a long lower wick.
The signal from On Balance Volume is weak because the trend line breached had only two anchor points and a reasonable slope. But it is still a bearish signal.
WEEKLY CHART
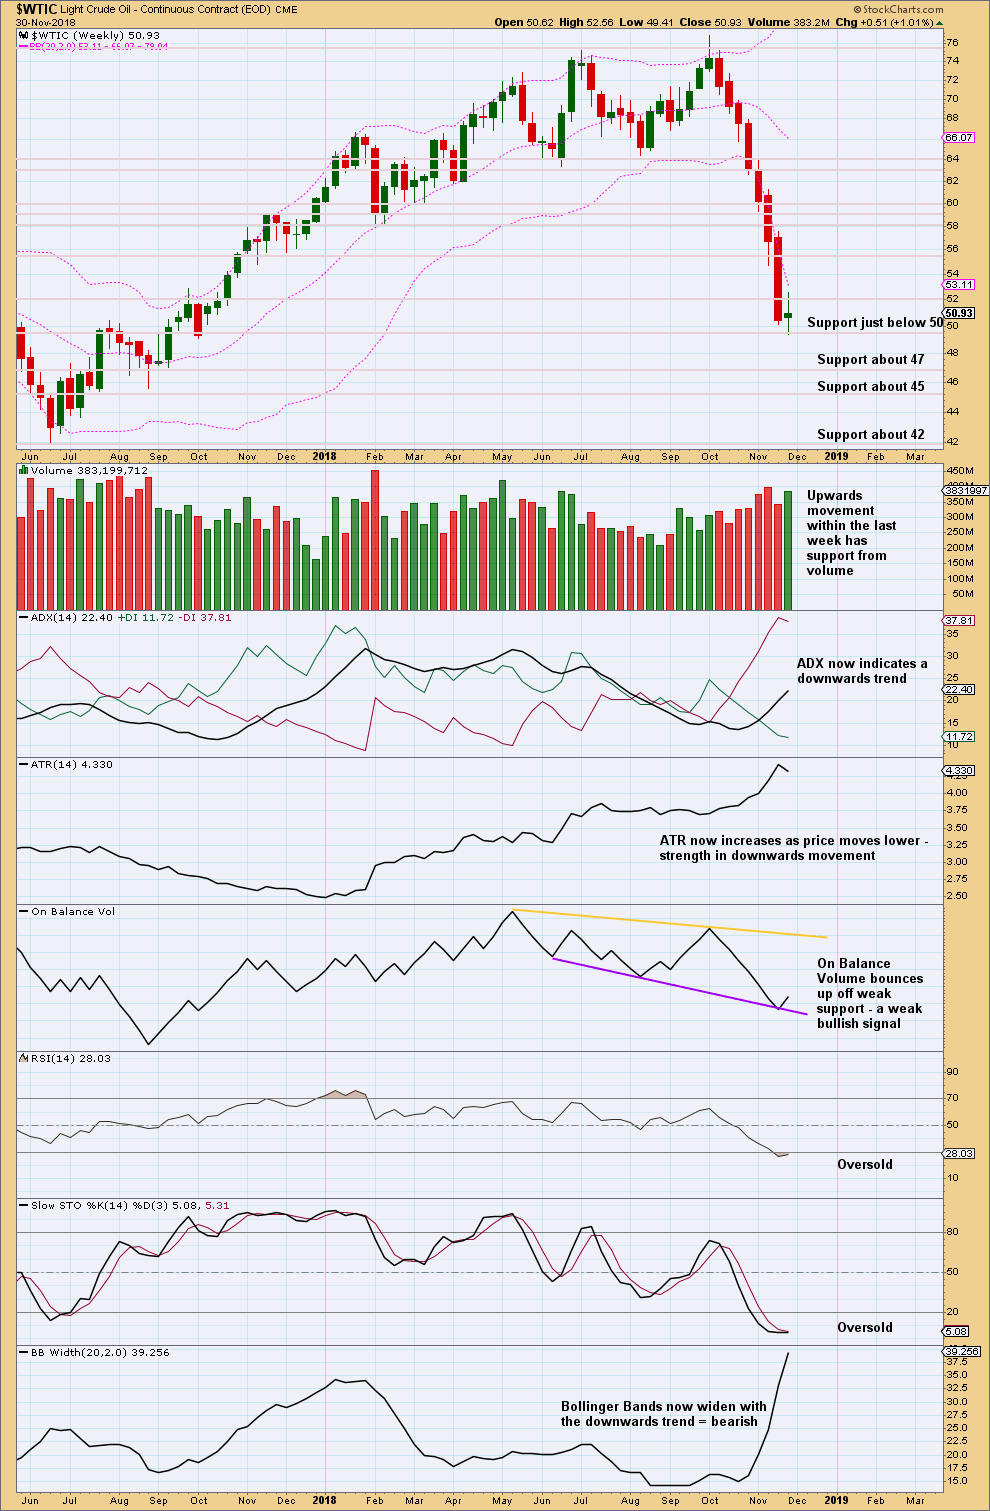
Click chart to enlarge. Chart courtesy of StockCharts.com.
The doji on its own is not a candlestick reversal pattern. With this week’s real body inside the real body of last week’s real body, the candlestick cannot be part of a Morning Doji star either.
The signal this week from On Balance Volume is weak because the trend line it bounced up from had only two prior anchor points and has a reasonable slope.
DAILY CHART
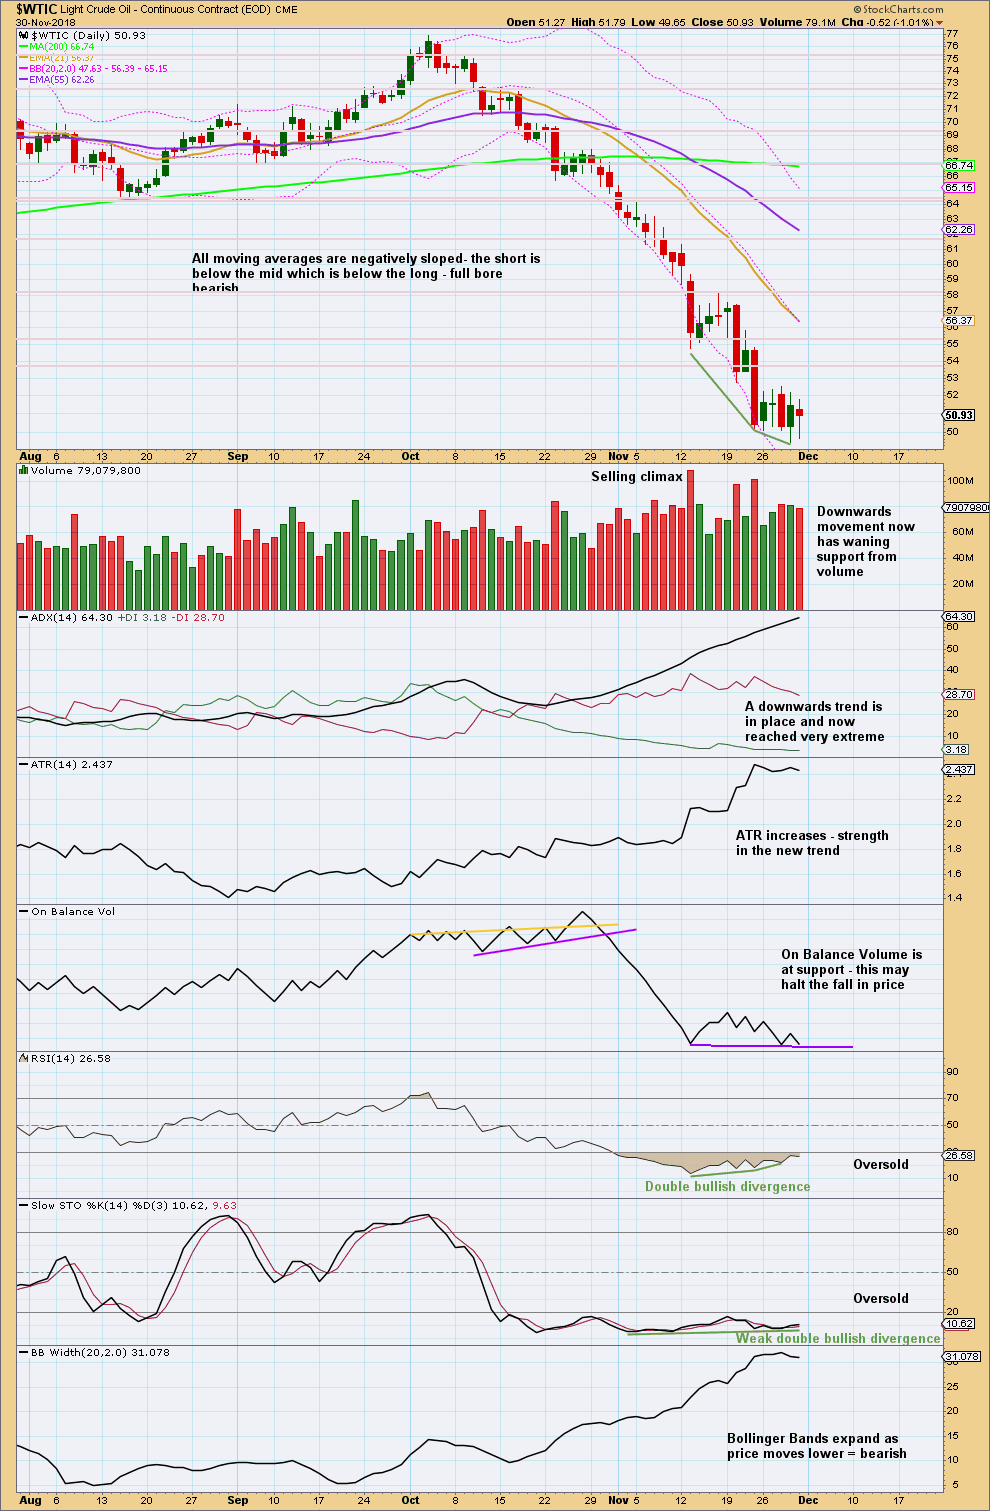
Click chart to enlarge. Chart courtesy of StockCharts.com.
I have taken some time to look back at the last strong bearish trend from Oil from about May 2014 to January 2016. I have noticed that downwards waves often end with support from volume, and sometimes do not even end with a long lower wick. Bullish reversal patterns are often but not always found at lows. RSI can reach very extreme and remain so for as long as three months when this market has a strong downwards trend. At lows Stochastics often will exhibit bullish divergence, but this can be rather weak. At lows RSI sometimes, not always, exhibits bullish divergence and can remain deeply oversold for long periods of time.
US Oil is a particularly difficult market to find lows in. It can trend strongly for very long periods of time with indicators remaining very extreme.
At this time, there is now clearly a downwards trend in place. This could continue for months yet. While price remains within the channel on the daily Elliott wave chart, expect it to continue to fall.
Expect that a low has been found only if a bullish candlestick reversal pattern appears, or the channel is clearly breached. But note that even if these occur, that any bounce may still be short lived.
This week members should be more alert for a possible low in place soon. Downwards movement is beginning to show some weakness. A bounce may be coming in the next week or so.
Published @ 03:05 a.m. EST on December 1, 2018.
—
Careful risk management protects your trading account(s).
Follow my two Golden Rules:
1. Always trade with stops.
2. Risk only 1-5% of equity on any one trade.