

S&P 500
Price moved overall lower as yesterday’s analysis expected.
Summary: A breach of the black Elliott channel has indicated primary wave 2 has arrived.
Primary wave 2 may last about a Fibonacci 13, 21 or 34 sessions in total. The first target is the 0.382 Fibonacci ratio of primary wave 1 about 2,589. The second target is the 0.618 Fibonacci ratio about 2,496.
If the expectation of a primary degree correction here is wrong, it may be in expecting it to be deeper and longer lasting than it turns out to be. There is evidence of underlying strength in this upwards movement from the December low.
The bigger picture still expects that a low may now be in place. At its end, primary wave 2 may offer a good entry opportunity to join the upwards trend.
The target is at 3,045 with a limit at 3,477.39.
The biggest picture, Grand Super Cycle analysis, is here.
The monthly chart was last published here.
ELLIOTT WAVE COUNT
WEEKLY CHART
Click chart to enlarge.
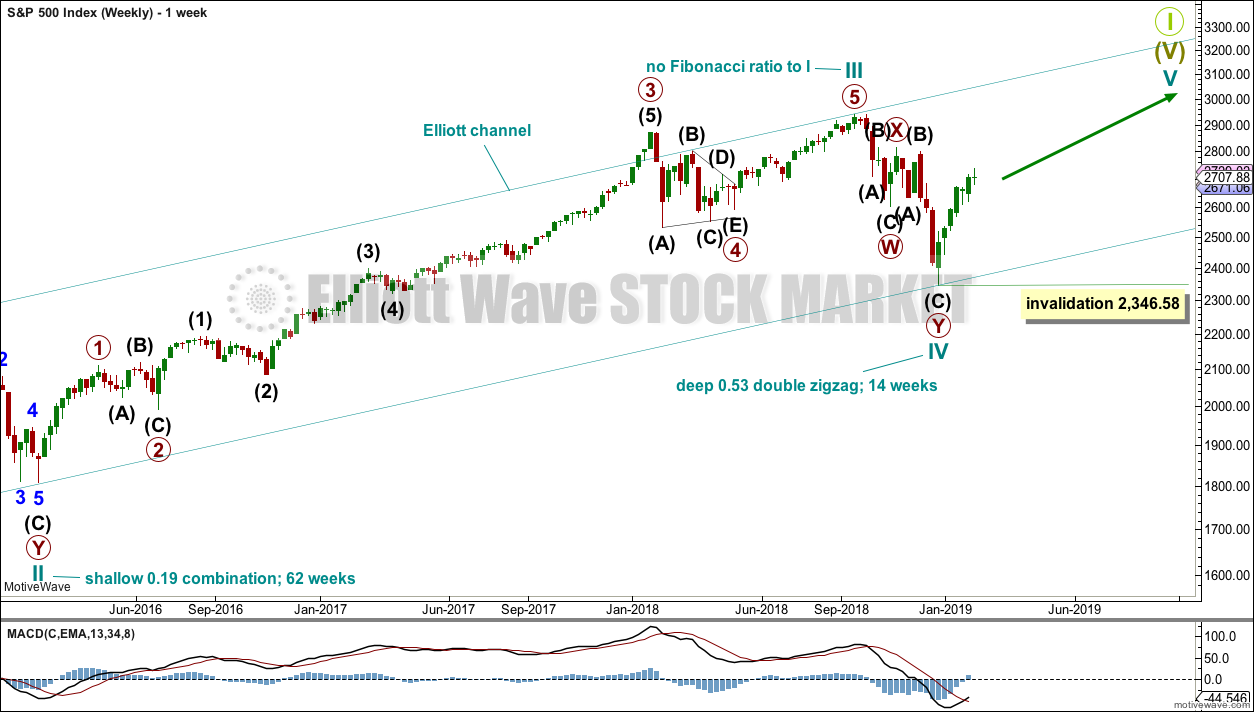
This weekly chart shows all of cycle waves III, IV and V so far.
Cycle wave II fits as a time consuming double combination: flat – X – zigzag. Combinations tend to be more time consuming corrective structures than zigzags. Cycle wave IV has completed as a multiple zigzag that should be expected to be more brief than cycle wave II.
Cycle wave IV may have ended at the lower edge of the Elliott channel.
Within cycle wave V, no second wave correction may move beyond the start of its first wave below 2,346.58.
Although both cycle waves II and IV are labelled W-X-Y, they are different corrective structures. There are two broad groups of Elliott wave corrective structures: the zigzag family, which are sharp corrections, and all the rest, which are sideways corrections. Multiple zigzags belong to the zigzag family and combinations belong to the sideways family. There is perfect alternation between the possible double zigzag of cycle wave IV and the combination of cycle wave II.
Although there is gross disproportion between the duration of cycle waves II and IV, the size of cycle wave IV in terms of price makes these two corrections look like they should be labelled at the same degree. Proportion is a function of either or both of price and time.
Draw the Elliott channel about Super Cycle wave (V) with the first trend line from the end of cycle wave I (at 2,079.46 on the week beginning 30th November 2014) to the high of cycle wave III, then place a parallel copy on the low of cycle wave II. Cycle wave V may find resistance about the upper edge.
DAILY CHART
Click chart to enlarge.
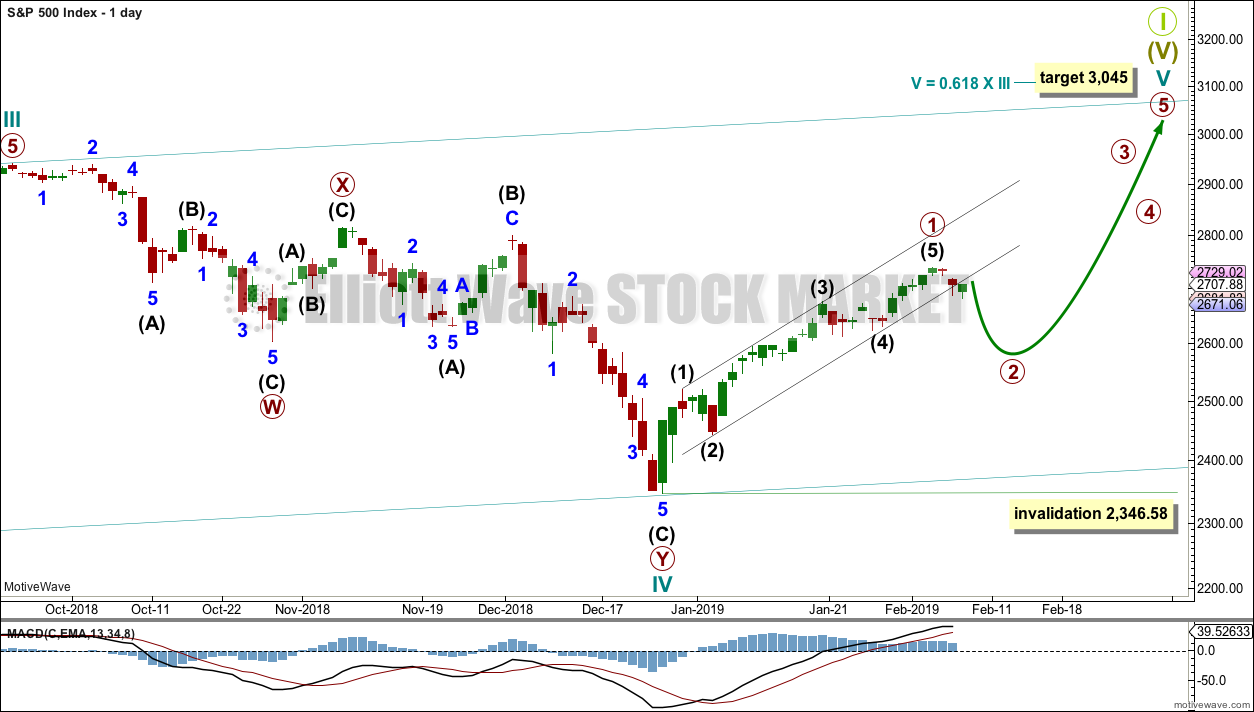
The daily chart will focus on the structure of cycle waves IV and V.
Cycle wave IV now looks like a complete double zigzag. This provides perfect alternation with the combination of cycle wave II. Double zigzags are fairly common corrective structures.
Within Super Cycle wave (V), cycle wave III may not be the shortest actionary wave. Because cycle wave III is shorter than cycle wave I, this limits cycle wave V to no longer than equality in length with cycle wave III at 3,477.39. A target is calculated for cycle wave V to end prior to this point.
Cycle wave V must subdivide as a five wave motive structure, either an impulse or an ending diagonal. An impulse is much more common and that will be how it is labelled. A diagonal would be considered if overlapping suggests it.
Within the five wave structure for cycle wave V, primary wave 1 may now be complete. Primary wave 1 lasted 27 sessions. Primary wave 2 may exhibit good proportion if it lasts a Fibonacci 21 or 34 sessions. Primary wave 2 would most likely subdivide as a zigzag, but it may be any corrective structure except a triangle.
Primary wave 2 may not move beyond the start of primary wave 1 below 2,346.58.
A new low below the start of intermediate wave (5) at 2,631.05 would add further confidence that primary wave 1 is over and primary wave 2 has begun.
TECHNICAL ANALYSIS
WEEKLY CHART
Click chart to enlarge. Chart courtesy of StockCharts.com.
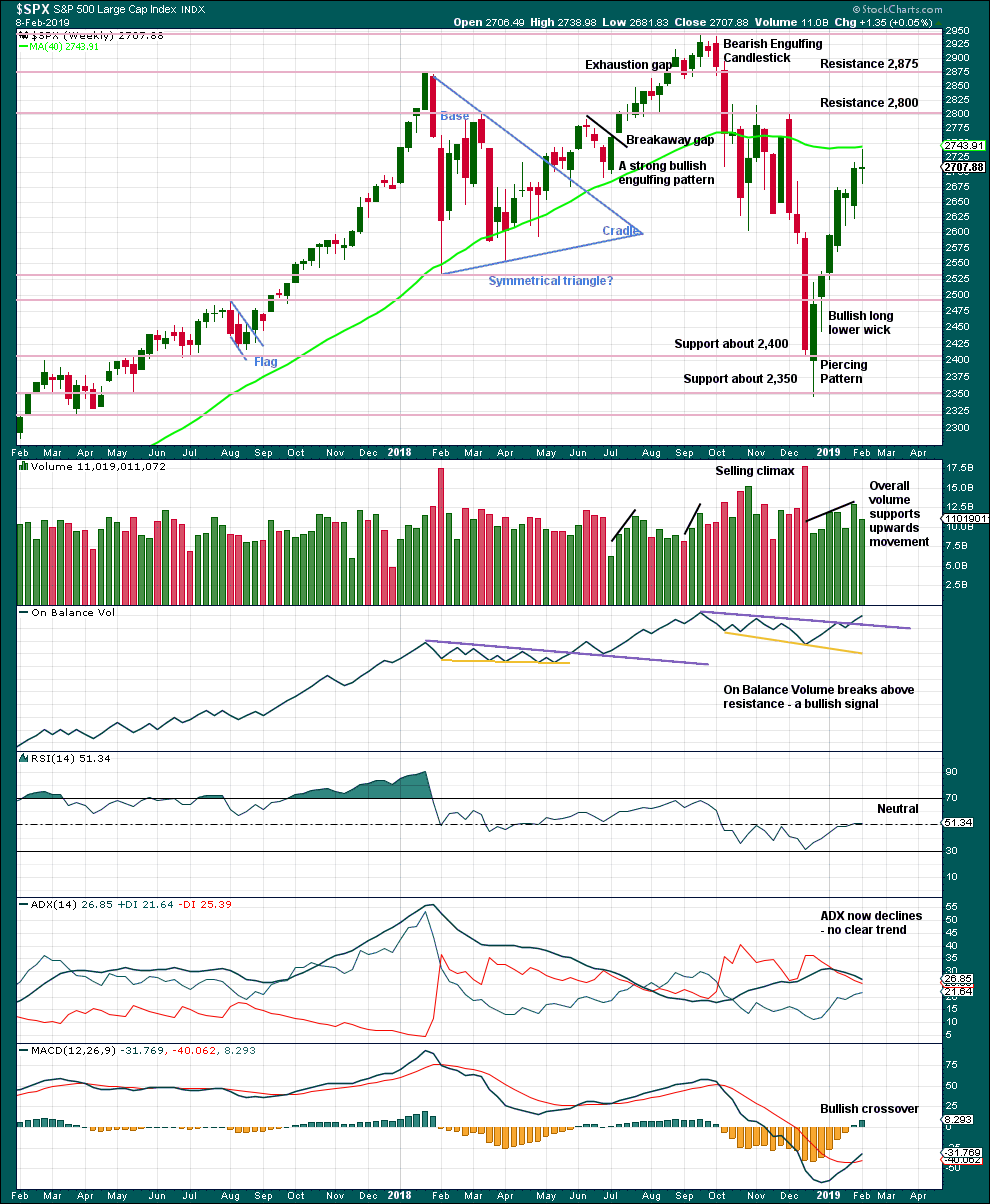
From the all time high to the low at the end of December 2018, price moved lower by 20.2% of market value meeting the definition for a bear market.
It should be noted that the large fall in price from May 2011 to October 2011 also met this definition of a bear market, yet it was only a very large pullback within a bull market, which so far has lasted almost 10 years.
Overall, volume supports upwards movement. There is plenty of room for price to rise further.
This week the long legged doji candlestick puts the trend for now from up to neutral. Risk of a pullback is heightened.
DAILY CHART
Click chart to enlarge. Chart courtesy of StockCharts.com.
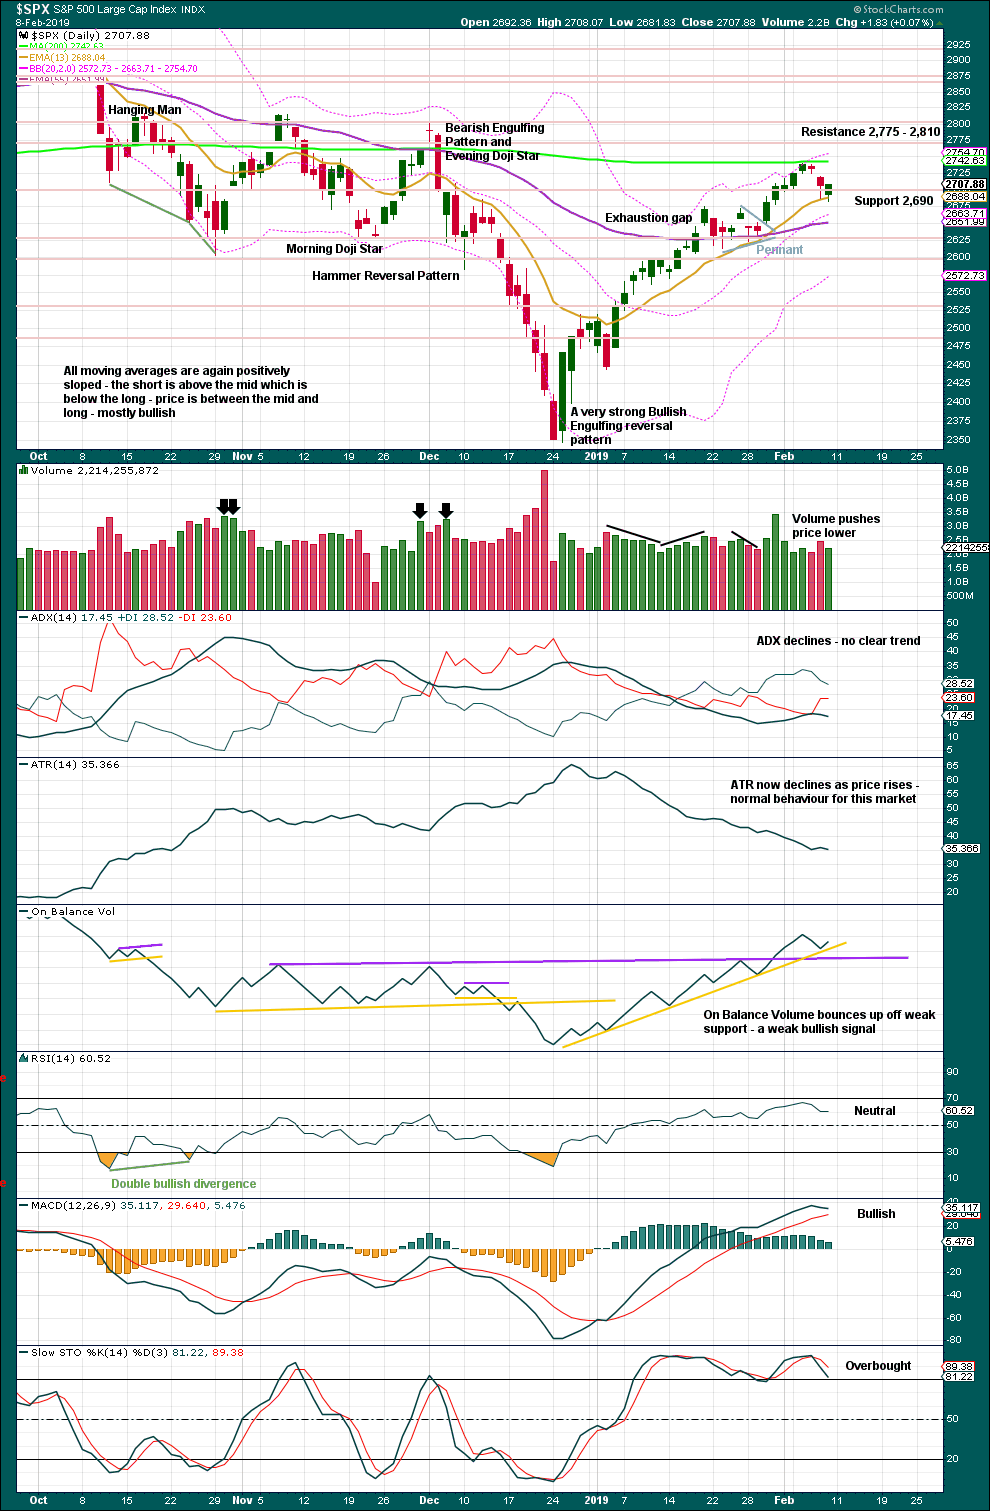
Over a fairly long period of time this ageing bull market has been characterised by upwards movement on light and declining volume and low ATR. For the short to mid term, little concern may be had if price now rises again on declining volume. Current market conditions have allowed for this during a sustained rise in price.
It is also normal for this market to have lower ATR during bullish phases, and strongly increasing ATR during bearish phases. Currently, declining ATR is normal and not of a concern.
Considering the larger picture from the Elliott wave count, some weakness approaching the end of Grand Super Cycle wave I is to be expected.
From Kirkpatrick and Dhalquist, “Technical Analysis” page 152:
“A 90% downside day occurs when on a particular day, the percentage of downside volume exceeds the total of upside and downside volume by 90% and the percentage of downside points exceeds the total of gained points and lost points by 90%. A 90% upside day occurs when both the upside volume and points gained are 90% of their respective totals”…
and “A major reversal is singled when an NPDD is followed by a 90% upside day or two 80% upside days back-to-back”.
The current situation saw two 80% downside days on December 20th and 21st, then a near 90% downside day with 88.97% downside on December 24th. This very heavy selling pressure on three sessions together may be sufficient to exhibit the pressure observed in a 90% downside day.
This has now been followed by two 90% upside days: on December 26th and again on 4th January.
The current situation looks very much like a major low has been found.
For the short term, price has found resistance at the 200 day moving average. Downwards movement here should be assumed to be another correction within an ongoing upwards trend until proven otherwise.
BREADTH – AD LINE
WEEKLY CHART
Click chart to enlarge. Chart courtesy of StockCharts.com. So that colour blind members are included, bearish signals
will be noted with blue and bullish signals with yellow.
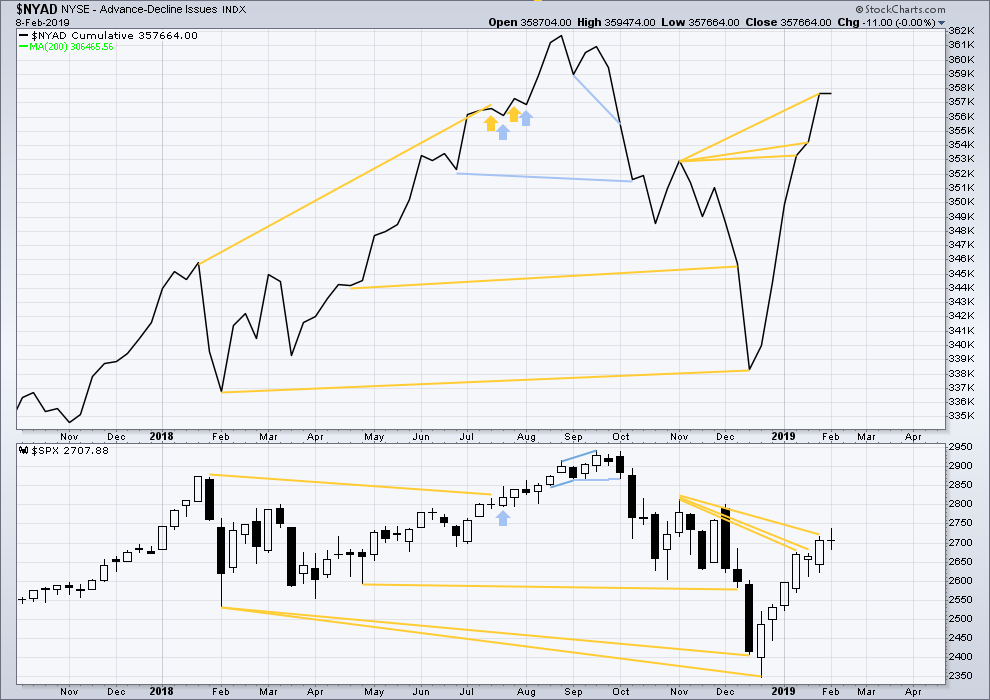
The AD line has made yet another new high above the prior swing high of the week beginning 5th of November 2018, but price has not. This divergence is bullish for the mid term.
This week price moved mostly sideways and the AD line is flat. This is considered to exhibit no divergence.
DAILY CHART
Click chart to enlarge. Chart courtesy of StockCharts.com. So that colour blind members are included, bearish signals
will be noted with blue and bullish signals with yellow.
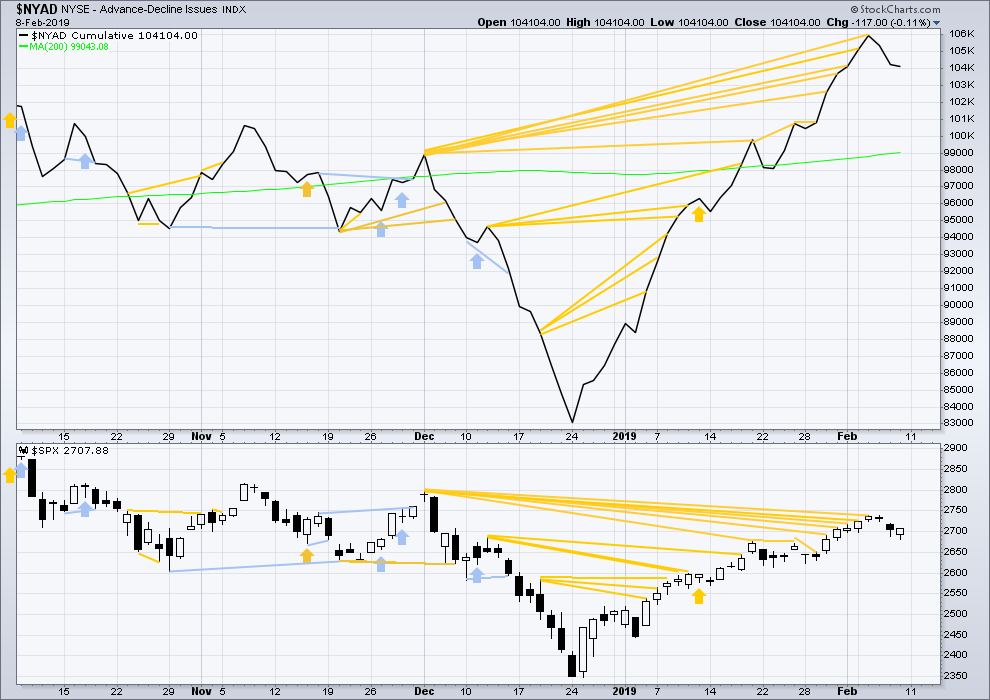
Breadth should be read as a leading indicator.
There is now a cluster of bullish signals from the AD line. This supports the Elliott wave count.
Downwards movement still has support from declining market breadth.
VOLATILITY – INVERTED VIX CHART
WEEKLY CHART
Click chart to enlarge. Chart courtesy of StockCharts.com. So that colour blind members are included, bearish signals
will be noted with blue and bullish signals with yellow.
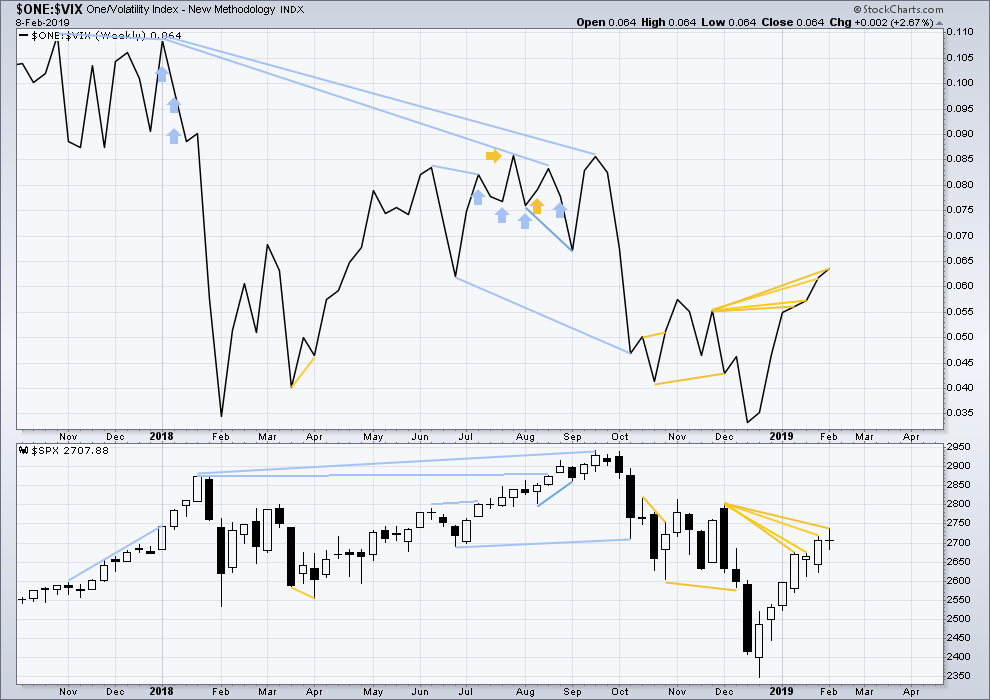
Inverted VIX has made another new high above the prior swing high of the weeks beginning 26th of November and 3rd of December 2018, but price has not. This divergence is bullish for the mid term.
DAILY CHART
Click chart to enlarge. Chart courtesy of StockCharts.com. So that colour blind members are included, bearish signals
will be noted with blue and bullish signals with yellow.
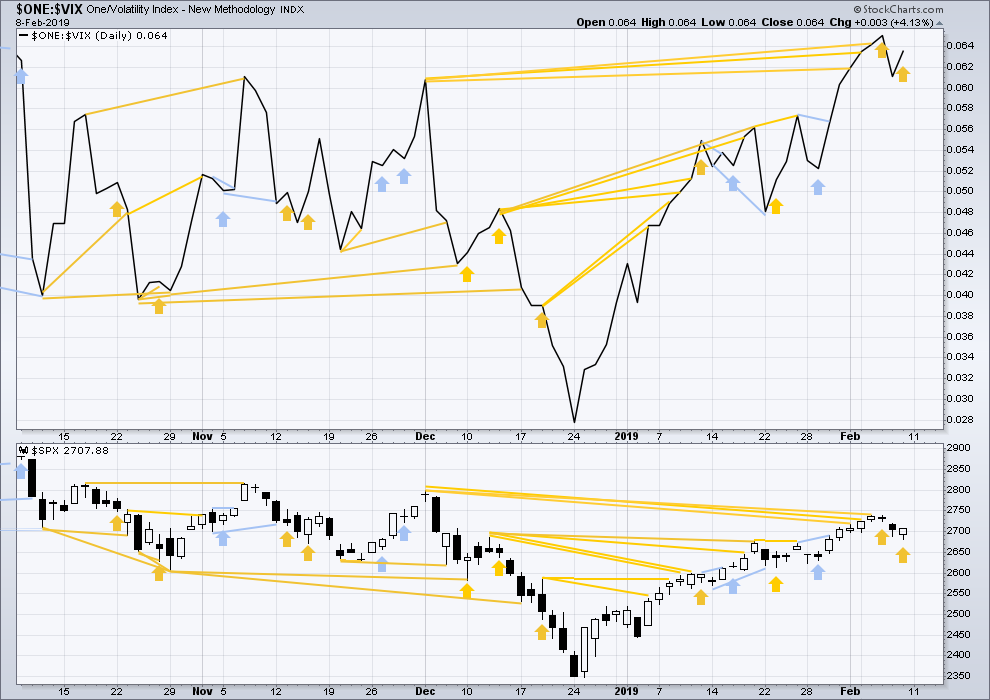
There is now a cluster of bullish signals from inverted VIX. This supports the Elliott wave count.
For the short term, price moved lower on Friday with a lower low and a lower high, but inverted VIX has moved higher. This divergence is bullish.
DOW THEORY
Dow Theory confirms a bear market. This does not necessarily mean a bear market at Grand Super Cycle degree though; Dow Theory makes no comment on Elliott wave counts. On the 25th of August 2015 Dow Theory also confirmed a bear market. The Elliott wave count sees that as part of cycle wave II. After Dow Theory confirmation of a bear market in August 2015, price went on to make new all time highs and the bull market continued.
DJIA: 23,344.52 – a close on the 19th of December at 23,284.97 confirms a bear market.
DJT: 9,806.79 – price has closed below this point on the 13th of December.
S&P500: 2,532.69 – a close on the 19th of December at 2,506.96 provides support to a bear market conclusion.
Nasdaq: 6,630.67 – a close on the 19th of December at 6,618.86 provides support to a bear market conclusion.
GOLD
Downwards movement this week fits both short-term outlooks. Classic analysis is used to determine the probability of each with clear price points for a breakout.
Summary: A new high on an upwards day with support from volume would be a classic upwards breakout. If that happens, then the target is at 1,338.
A new low now below 1,302.86 would indicate a high may be in place.
Some indication of a trend change is seen by a weak bearish engulfing reversal pattern and closure of the last gap.
For reasonable confidence in a trend change the remaining things may be seen:
1. A new low below 1,302.86.
2. A breach of the blue channel on the daily chart.
Once a trend change is indicated, then a new wave down to last years may be expected to make new lows below 1,046.27.
Grand SuperCycle analysis is here.
Last historic analysis with monthly charts is here.
Only two remaining wave counts have a reasonable probability and are published below: a triangle (the preferred wave count) and a double zigzag.
MAIN ELLIOTT WAVE COUNT
WEEKLY CHART – TRIANGLE
Click chart to enlarge.
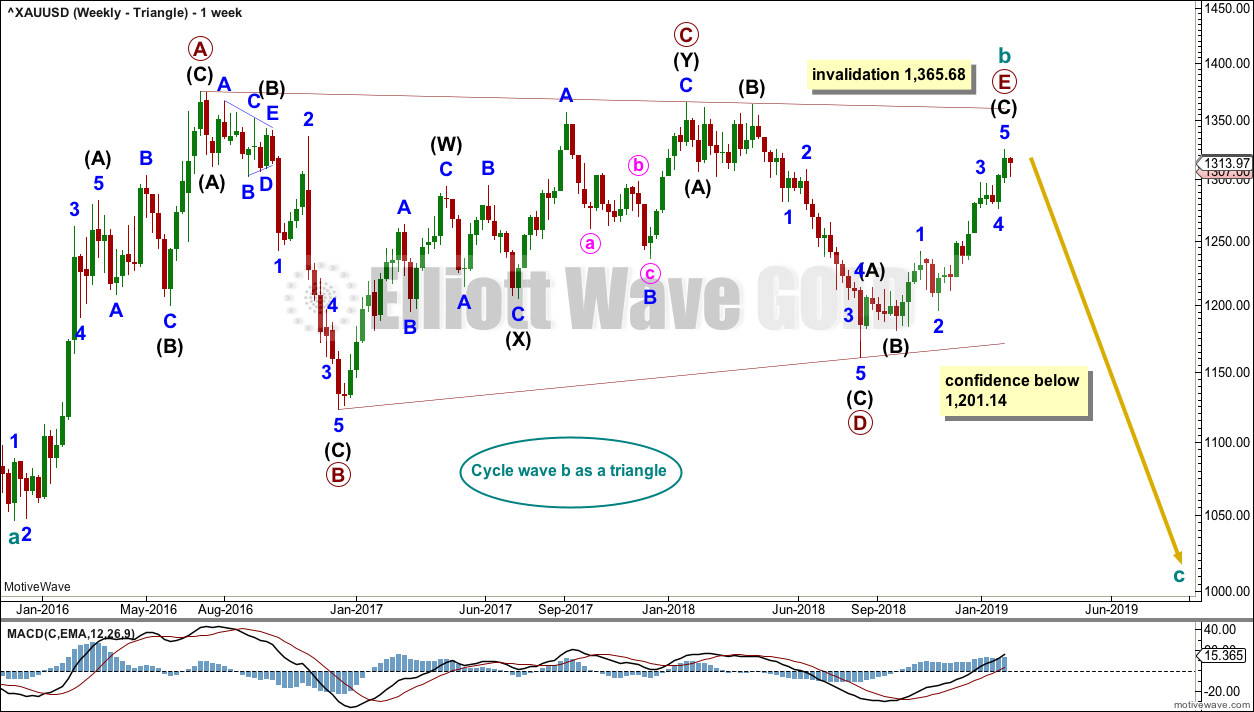
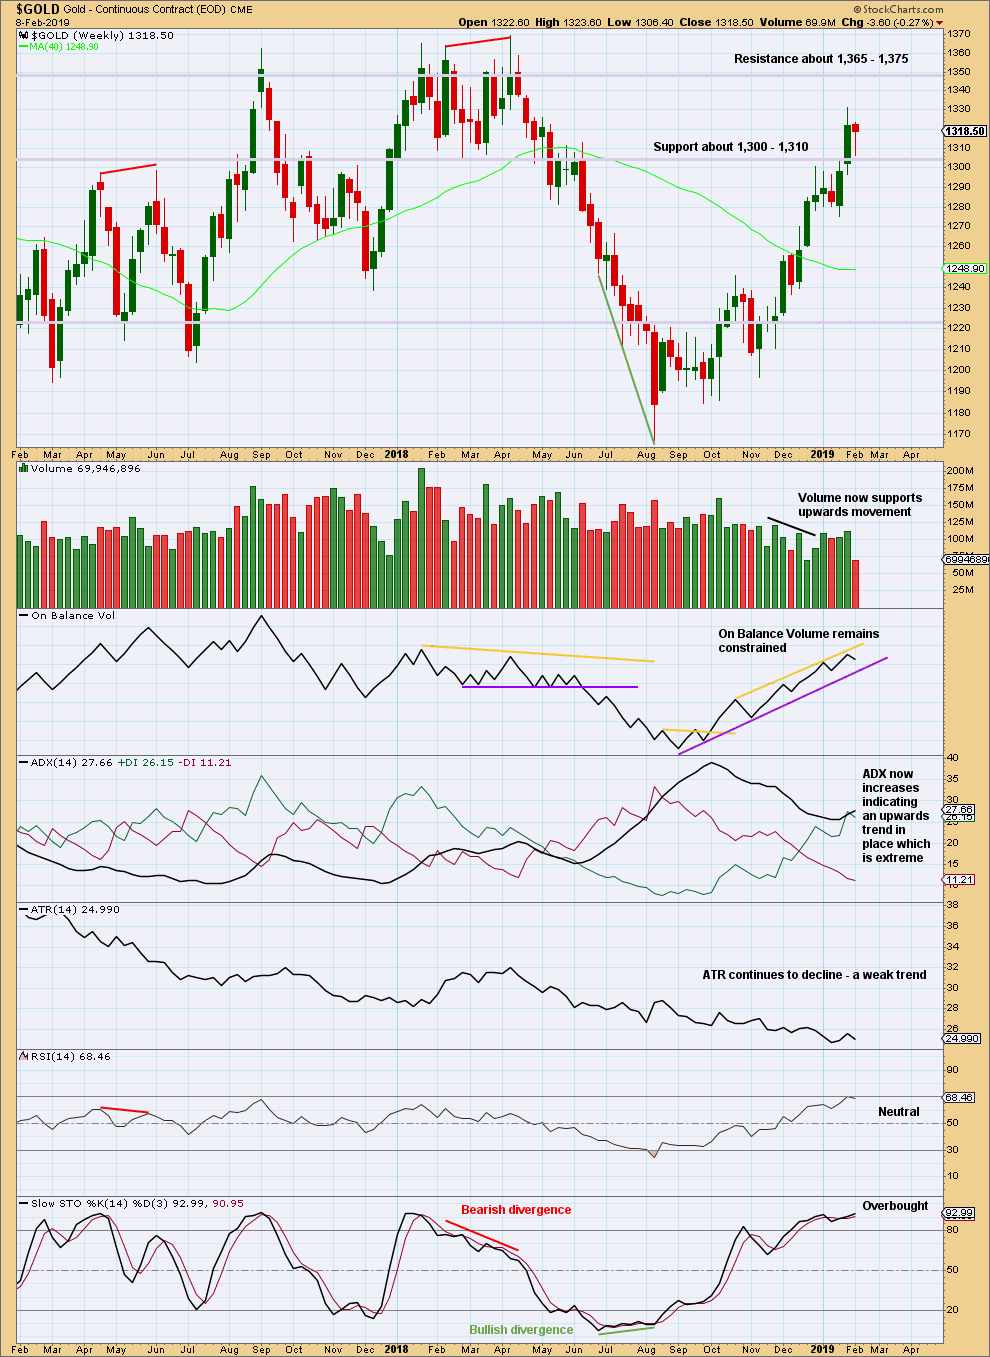
Cycle wave b may be a complete regular contracting triangle. If it continues further, then primary wave E may not move beyond the end of primary wave C above 1,365.68.
Within primary wave E, intermediate waves (A) and (B) may be complete. Intermediate wave (C) must subdivide as a five wave structure.
Four of the five sub-waves of a triangle must be zigzags, with only one sub-wave allowed to be a multiple zigzag. Wave C is the most common sub-wave to subdivide as a multiple, and this is how primary wave C for this example fits best. Primary wave E looks like it is unfolding as a single zigzag.
There are no problems in terms of subdivisions or rare structures for this wave count. It has an excellent fit and so far a typical look.
This wave count would now expect a cycle degree trend change. Cycle wave c would most likely make new lows below the end of cycle wave a at 1,046.27 to avoid a truncation.
It is possible now that primary wave E could have been over at last week’s high. Some reasonable weakness should be expected at its end. Triangles often end with declining ATR, weak momentum and weak volume.
If this weekly wave count is correct, then cycle wave c downwards should begin with some strength, ATR should show some increase, and MACD should exhibit an increase in downwards momentum.
DAILY CHART – TRIANGLE
Click chart to enlarge.
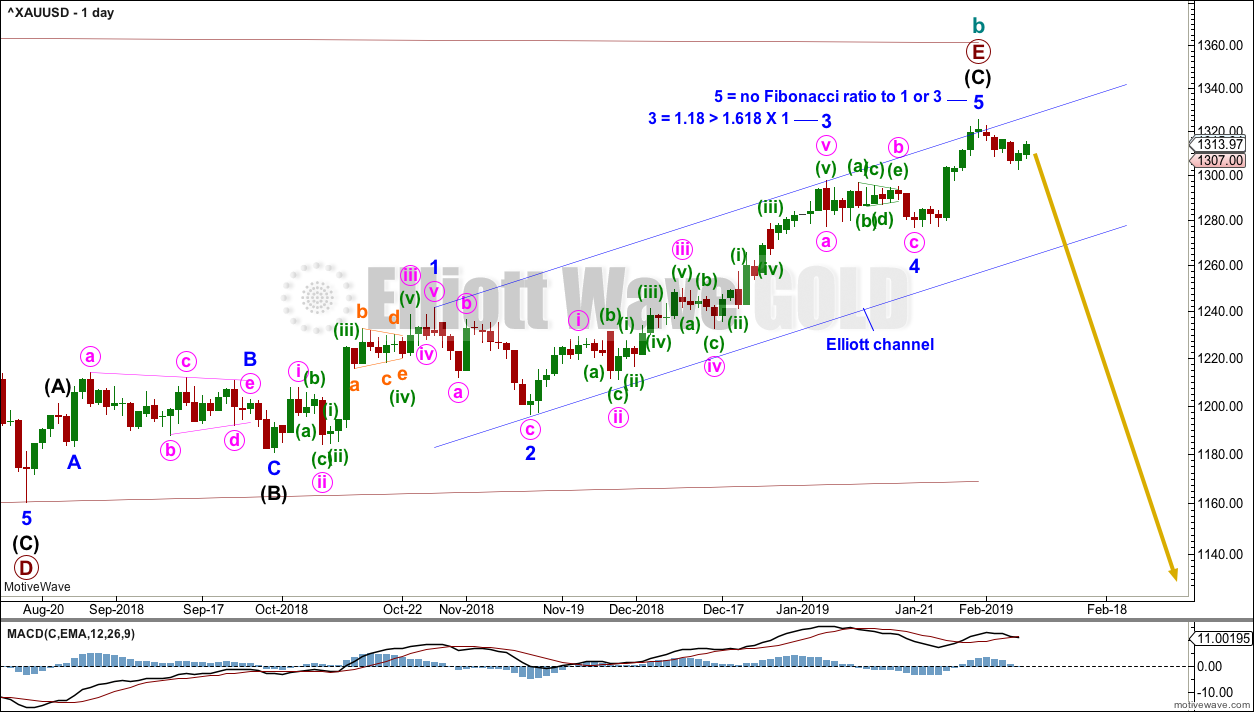
Primary wave E should subdivide as a zigzag. Intermediate waves (A) and (B) may now be complete. Intermediate wave (C) may be complete, but as yet there is no confidence in a high.
It is now possible to see minor wave 5 complete at the daily chart level. However, it is always safest to assume the trend remains the same until proven otherwise. For reasonable confidence in a trend change the remaining two things need to be seen:
1. A new low below 1,302.86.
2. A breach of the blue channel.
One target now remains for minor wave 5 to end.
WEEKLY CHART – DOUBLE ZIGZAG
Click chart to enlarge.
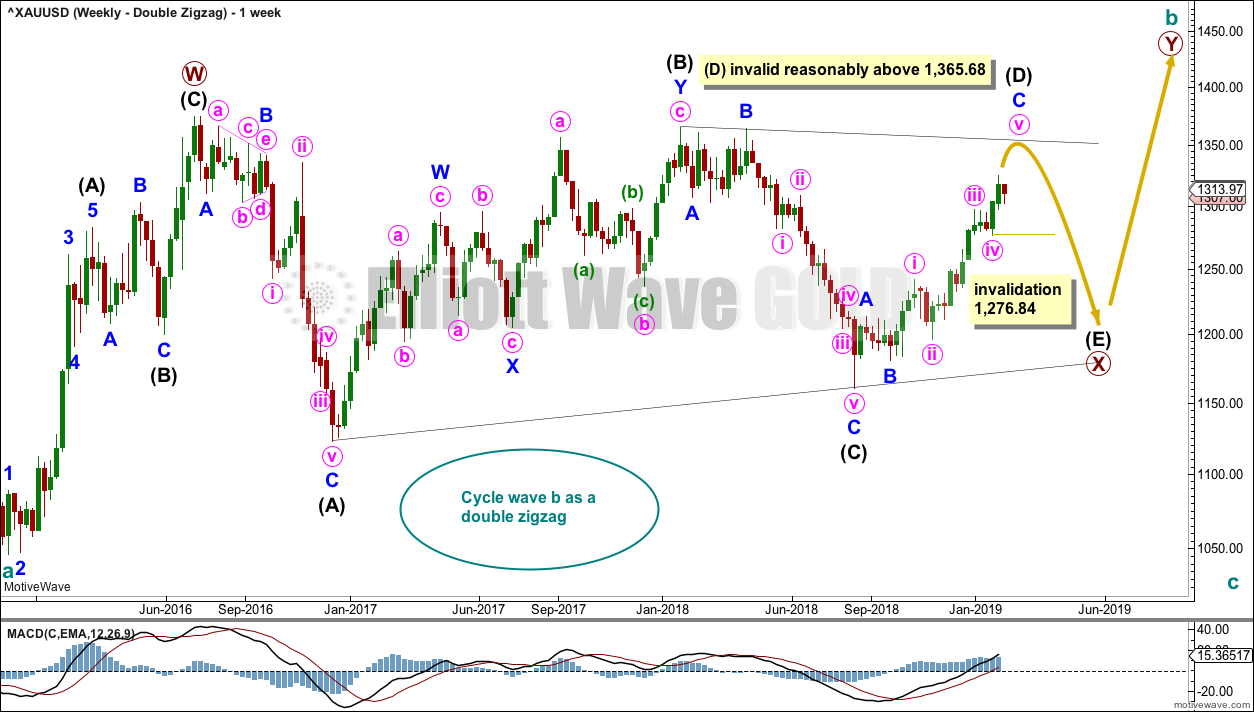
It is possible that cycle wave b may be a double zigzag or a double combination.
The first zigzag in the double is labelled primary wave W. This has a good fit.
The double may be joined by a corrective structure in the opposite direction, a triangle labelled primary wave X. The triangle would be about three quarters complete.
Within the triangle of primary wave X, intermediate wave (C) should be complete. Within intermediate wave (D), minor waves A and B may be complete. Minor wave C must subdivide as a five wave structure. Within minor wave C, minute wave iv should now be over. Within minute wave v, no second wave correction may move beyond its start below 1,276.84.
Intermediate wave (D) would most likely subdivide as a single zigzag. Intermediate wave (D) should end at the upper (B)-(D) trend line for this wave count, so that the triangle adheres neatly to this trend line. That price point is about 1,354. This wave count now requires upwards movement to continue. It would not be acceptable for the upper (B)-(D) trend line to have breaches or substantial overshoots. Elliott wave triangles almost always adhere very neatly to their trend lines.
Intermediate wave E should continue to exhibit weakness: ATR should continue to show a steady decline, and MACD may begin to hover about zero.
This wave count may now expect choppy overlapping movement in an ever decreasing range for a few more months.
Primary wave Y would most likely be a zigzag because primary wave X would be shallow; double zigzags normally have relatively shallow X waves.
Primary wave Y may also be a flat correction if cycle wave b is a double combination, but combinations normally have deep X waves. This would be less likely.
This wave count has good proportions and no problems in terms of subdivisions.
WEEKLY CHART – ALTERNATE BULLISH
Click chart to enlarge.
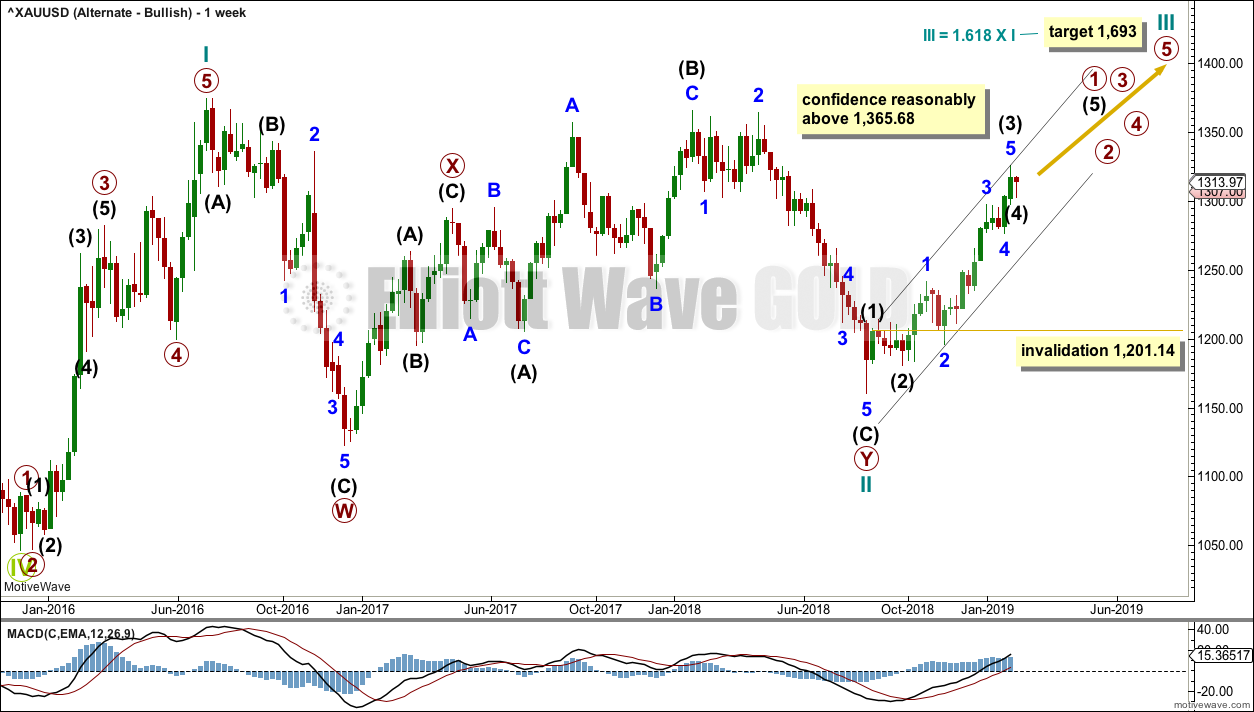
Because the preferred wave count is at a critical juncture in expecting a cycle degree trend change, it is time to consider an alternate which expects the continuation of the current upwards trend.
It is possible that the low in December 2015 was the end of a bear market and that Gold has been in a basing action for the past three years. Downwards movement to that low will subdivide as a double zigzag, a corrective structure.
If Gold is in a new bull market, then it should begin with a five wave structure upwards on the weekly chart. However, the biggest problem with this wave count is the structure labelled cycle wave I because this wave count must see it as a five wave structure, but it looks more like a three wave structure.
Commodities often exhibit swift strong fifth waves that force the fourth wave corrections coming just prior to be more brief and shallow than their counterpart second waves. It is unusual for a commodity to exhibit a quick second wave and a more time consuming fourth wave, so this is how cycle wave I is labelled. The probability of this wave count is low due to this problem.
Cycle wave II subdivides well as a double combination: zigzag – X – expanded flat.
Cycle wave III may have begun. Within cycle wave III, primary wave 1 may be an incomplete impulse. Within primary wave 1, intermediate wave (4) may not move into intermediate wave (1) price territory below 1,201.14.
A black Elliott channel is drawn about primary wave 1. Intermediate wave (4) may find support about the lower edge.
Cycle wave III so far for this wave count would have been underway now for 25 weeks. It should be beginning to exhibit some support from volume, increase in upwards momentum and increasing ATR. However, volume continues to decline, ATR continues to decline and is very low, and momentum is weak in comparison to cycle wave I. This wave count lacks support from classic technical analysis.
TECHNICAL ANALYSIS
WEEKLY CHART
Click chart to enlarge. Chart courtesy of StockCharts.com.
This weekly candlestick so far looks like a small correction within an ongoing upwards trend. Volume is not pushing price lower and the lower candlestick wick is bullish.
DAILY CHART
Click chart to enlarge. Chart courtesy of StockCharts.com.
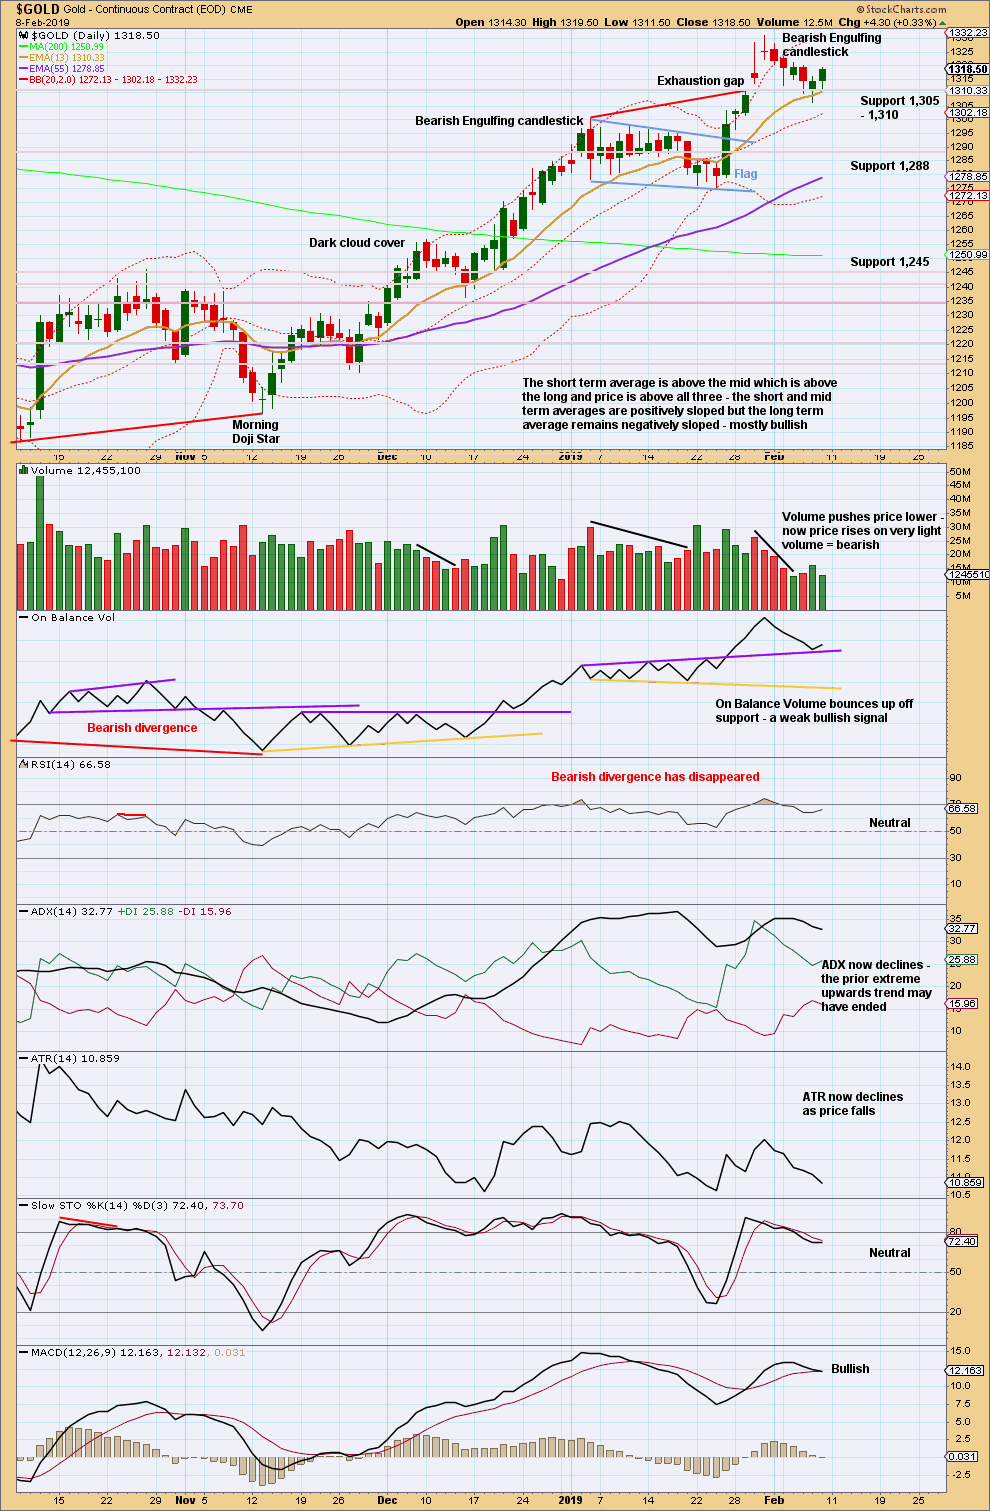
Using the flag pole length, a target at 1,359 is calculated. This target looks rather optimistic.
The last gap is now closed, correctly labelled an exhaustion gap. This indicates the target for the flag pole may not be met. This adds a little further confidence that a high may now be in place.
With the trend now extreme and a bearish candlestick reversal pattern, some caution regarding targets would be advisable. However, Friday’s candlestick has a small real body; this is not a strong Bearish Engulfing pattern.
A very weak upwards day that lacks support from volume on Friday is concerning for bulls.
The short-term picture is unclear.
GDX WEEKLY CHART
Click chart to enlarge. Chart courtesy of StockCharts.com.
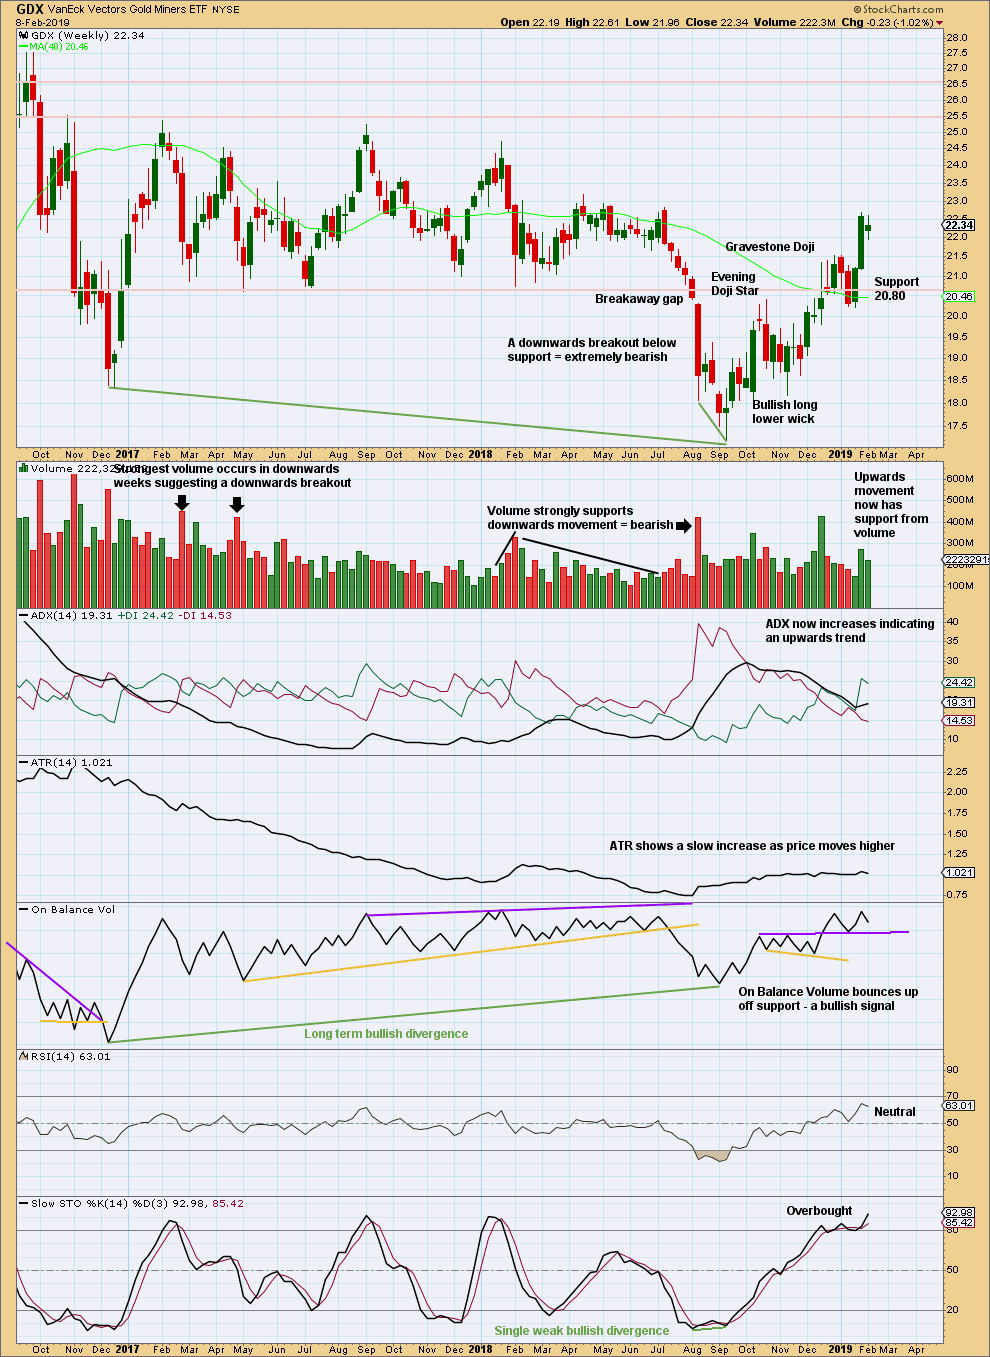
A small range inside week looks like a small pause within an ongoing upwards trend at this stage.
GDX DAILY CHART

Click chart to enlarge. Chart courtesy of StockCharts.com.
With ADX now indicating the trend as extreme and RSI overbought at the high, the risk of a trend change has increased.
US OIL
Some downwards movement was expected for this week. After a very slight new high on Monday, this is how the week unfolded.
Summary: A little downwards movement may continue next week to complete wave B about 50.91 to 50.82. Thereafter, the upwards bounce should continue to the final target about 63.71.
The larger picture still sees Oil in a new downwards trend to end reasonably below 26.06.
MAIN ELLIOTT WAVE COUNT
MONTHLY CHART
Click chart to enlarge.
Classic technical analysis favours a bearish wave count for Oil at this time.
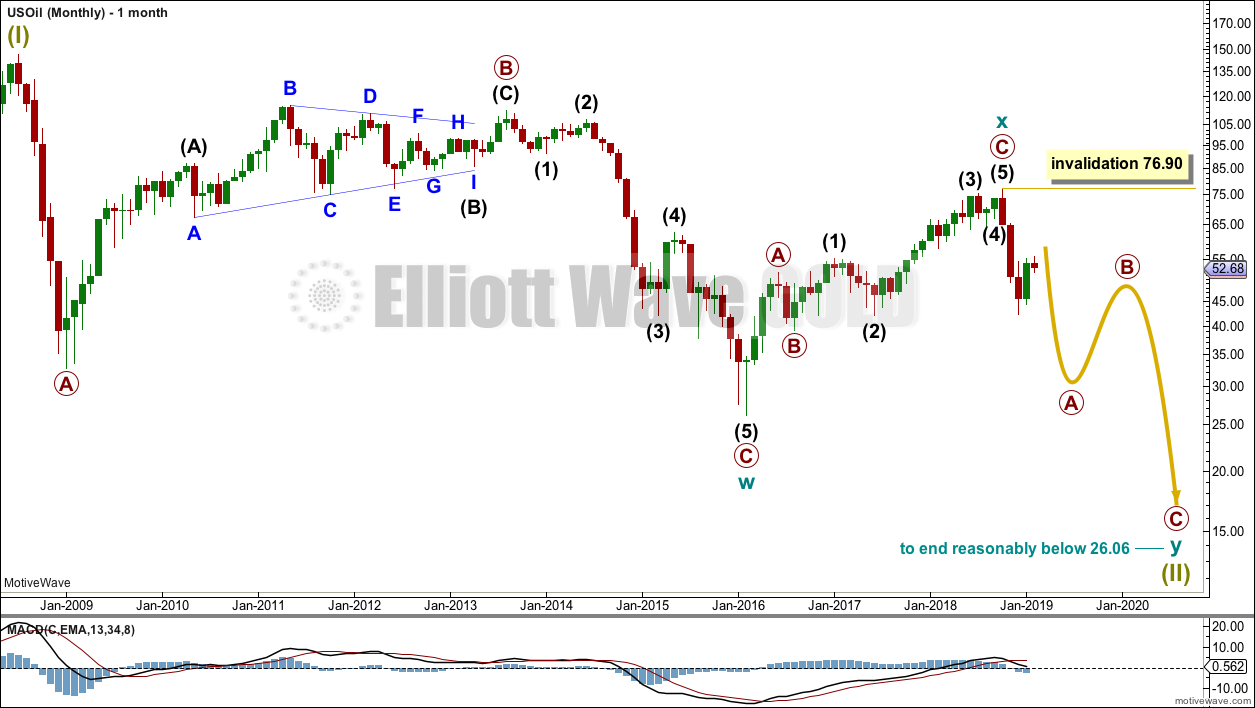
The large fall in price from the high in June 2008 to February 2016 is seen as a complete three wave structure. This large zigzag may have been only the first zigzag in a deeper double zigzag.
The first zigzag down is labelled cycle wave w. The double is joined by a now complete three in the opposite direction, a zigzag labelled cycle wave x.
The purpose of a second zigzag in a double is to deepen the correction when the first zigzag does not move price deep enough. Cycle wave y would be expected to move reasonably below the end of cycle wave w to deepen the correction. Were cycle wave y to reach equality with cycle wave w that takes Oil into negative price territory, which is not possible. Cycle wave y would reach 0.618 the length of cycle wave w at $2.33.
A better target calculation would be using the Fibonacci ratios between primary waves A and C within cycle wave y. This cannot be done until both primary waves A and B are complete.
Within cycle wave y, no second wave correction nor B wave may move beyond its start above 76.90.
WEEKLY CHART
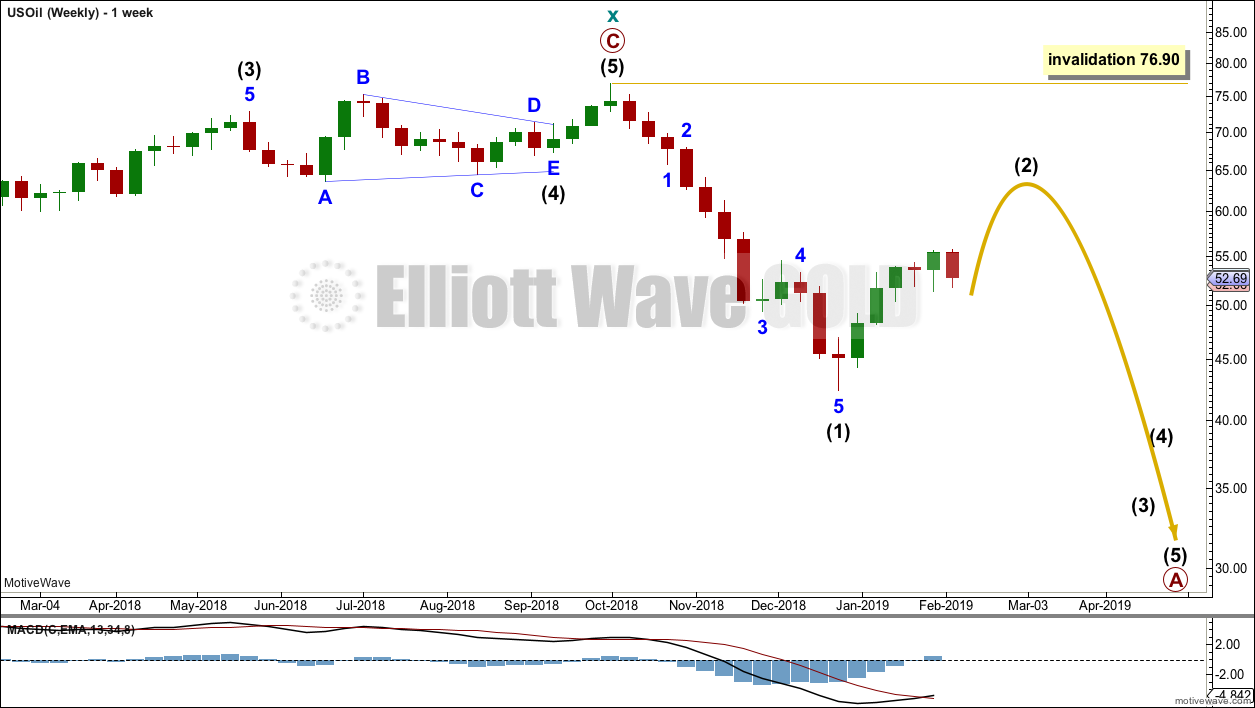
Click chart to enlarge.
This weekly chart is focussed on the start of cycle wave y.
Cycle wave y is expected to subdivide as a zigzag. A zigzag subdivides 5-3-5. Primary wave A must subdivide as a five wave structure if this wave count is correct.
Within primary wave A, intermediate wave (1) may now be complete. Intermediate wave (2) may unfold over a few weeks as a sideways choppy consolidation, or a deep sharp bounce. At this stage, it looks more likely to be a deep bounce.
Intermediate wave (2) should look like a three wave structure when it is complete on the weekly chart; for that to happen minor wave B within it should be clear.
Intermediate wave (2) may not move beyond the start of intermediate wave (1) above 76.90.
MAIN DAILY CHART
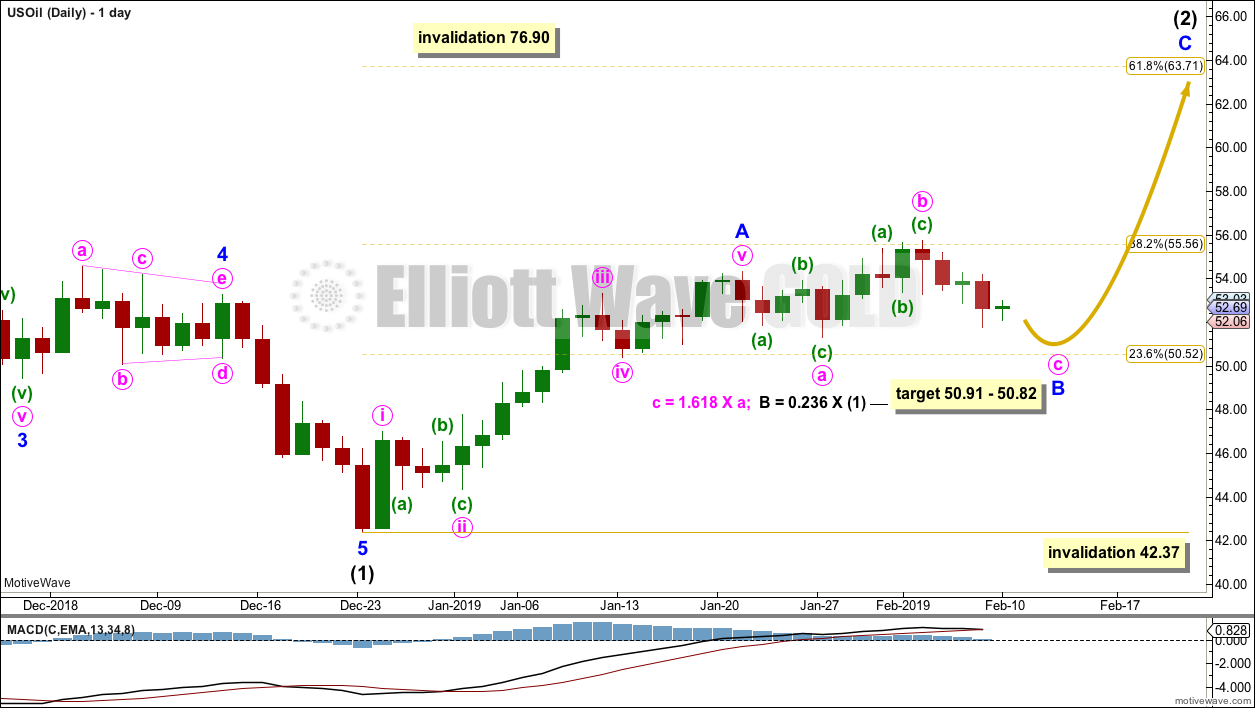
Click chart to enlarge.
Intermediate wave (2) would most likely subdivide as a zigzag and at this stage that is how it will be labelled. However, it may also subdivide as a flat or combination. It is impossible at this stage to know which structure it will unfold as. The labelling within it may change as it unfolds.
If intermediate wave (2) is unfolding as a zigzag, then within it minor wave A may now be a complete impulse.
Minor wave B may not move beyond the start of minor wave A below 42.37.
At this stage, minor wave B may be unfolding as an expanded flat correction, which is a fairly common structure. Within this expanded flat, minute wave b is now a 1.48 length of minute wave a. This is longer than the common range of 1 to 1.38 times the length of minute wave a, but within an allowable limit of up to 2 times minute wave a.
A target is calculated for minute wave c to to reach the most common Fibonacci ratio to minute wave a for an expanded flat.
When minor wave B is complete, then another five wave structure upwards for minor wave C may be expected to unfold.
Intermediate wave (2) may be very deep.
Intermediate wave (2) may not move beyond the start of intermediate wave (1) above 76.90.
TECHNICAL ANALYSIS
MONTHLY CHART
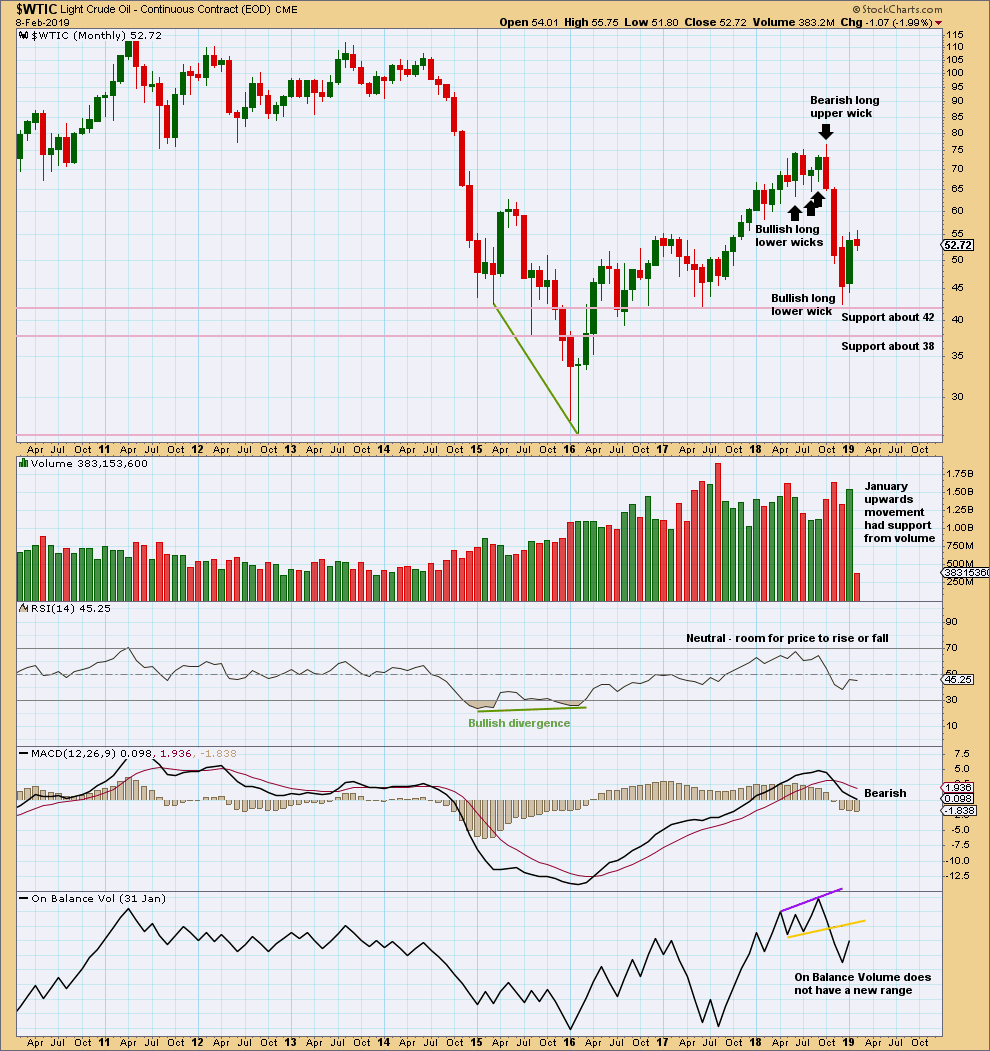
Click chart to enlarge. Chart courtesy of StockCharts.com.
Upwards movement within January has support from volume. This supports the Elliott wave count which expects overall more upwards movement in coming weeks.
WEEKLY CHART
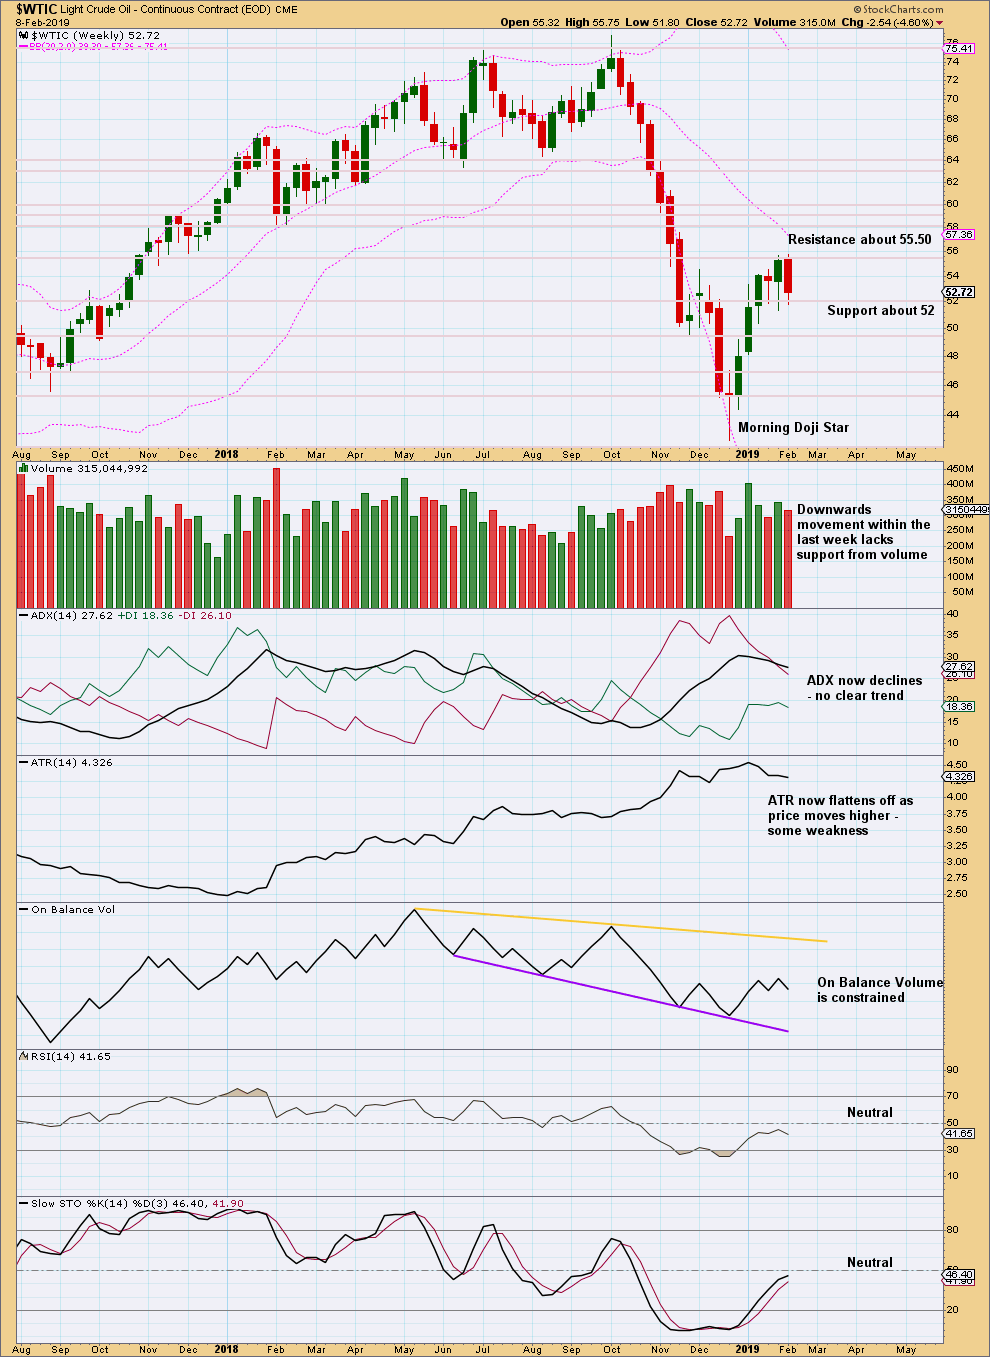
Click chart to enlarge. Chart courtesy of StockCharts.com.
This week completes an upwards week with a higher high and a higher low, but the balance of volume was downwards and the candlestick closed red. Downwards movement within the week saw price fall of its own weight.
DAILY CHART
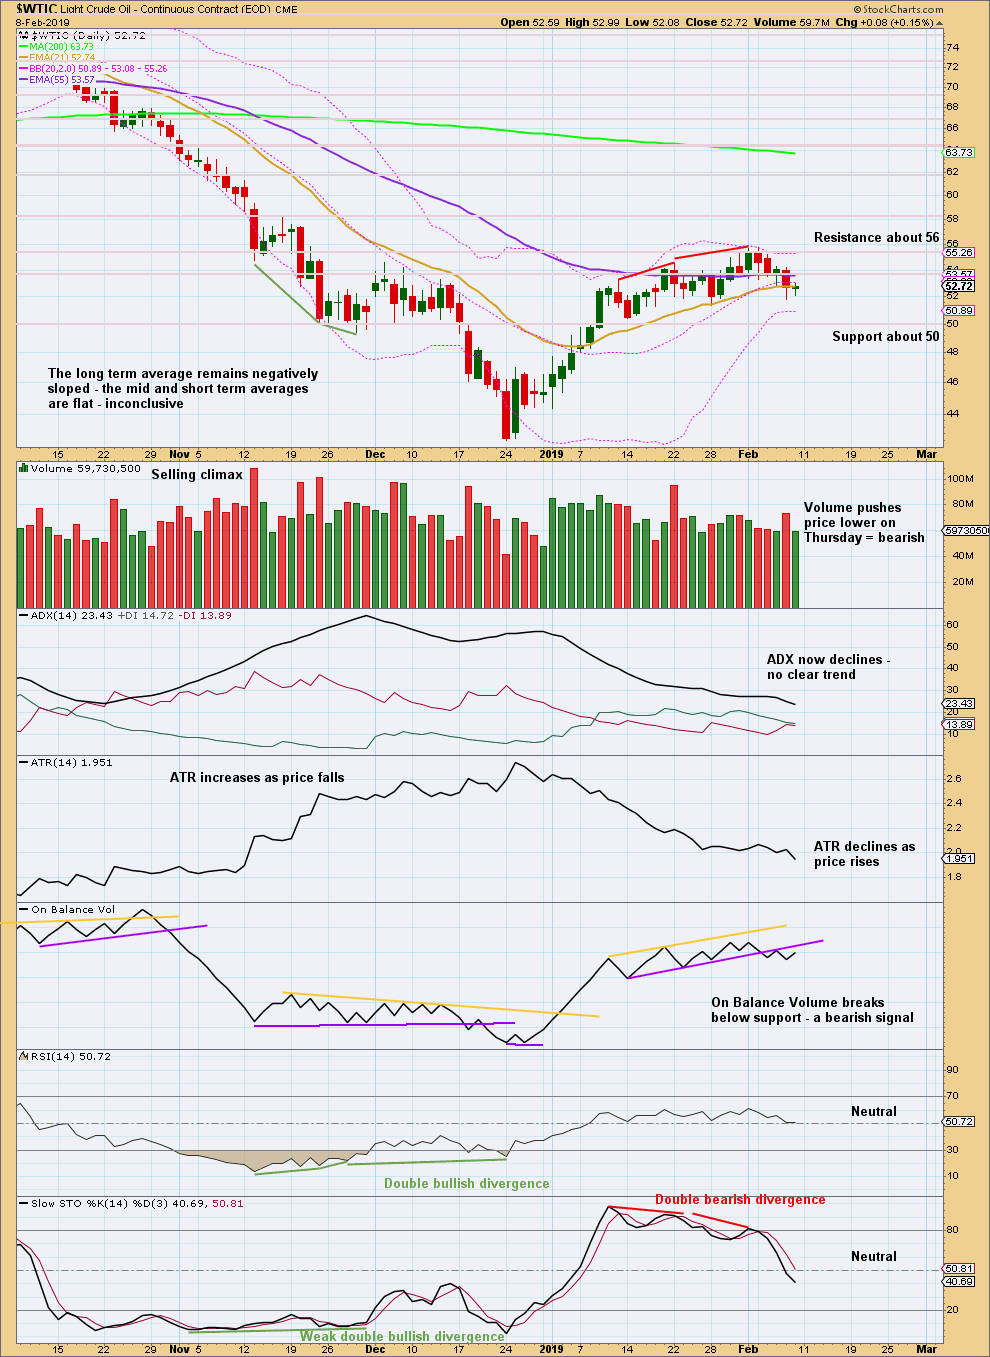
Click chart to enlarge. Chart courtesy of StockCharts.com.
The short-term volume profile is bearish. Look for next support about 50.00.
—
Always practice good risk management as the most important aspect of trading. Always trade with stops and invest only 1-5% of equity on any one trade. Failure to manage risk is the most common mistake new traders make.
Thanks everybody for your feedback. Looks like there would be demand for a US and Australian analysis.
As Olga rightly points out though, any investment now in the stock market is investing in an ageing bull market. The biggest warning I’ll be giving is investors need to be very willing to be flexible, and to sell all and hold cash only if this bull turns to bear.
Actually, it’s not “if”, it’s “when”. That’s a really important point!
Hi Lara
Yes I’d be keen for Australia and US.
For the S&P500:
Today a new short term target for primary wave 1 to end is at 2,767.
If price gets to this point and I can’t see a completed structure for the fifth wave, or if price keeps rising through this point, then the next target is at 2,856.
A little weakness is now evident in this rise. Stocks trading above their 10 day moving averages did not increase with price at the last high. This is a little bearish divergence, normal to see developing in a fifth wave.
A quick question to Lara’s Weekly members:
A friend has asked me about investing in our NZ stock market, and I’m doing that too, so I’m doing some macro economic analysis and using a top down approach to finding stocks to buy.
I’ve done hours and hours of research (I even bought a windows computer, shock horror!) and have found good data to use. I may consider doing this for the US and possibly Australian markets as well, once a month.
I’m using:
-sector rotation analysis
-RRG analysis of strongest sectors
-individual stock chart classic technical analysis
-Elliott wave analysis and TA of the index.
I’m providing picks for stocks to buy, and just as importantly guidelines as to when to sell. I’ll do this for my friend and myself once a month.
Is anyone here interested in getting this report? Which countries would you want it for? (I’m only one person so this must be limited to USA, Australia, NZ)
Hi Lara – how would this tie in with the expectation of a major EW top this year in S&P (so presumably not wanting to hold US stocks other than possibly shorting them / swing trading the larger counter trends)?
Do you expect NZ / Australia will fare better which makes them more appealing?
Many thanks – Olga
It would be a short term investment.
I’m also watching the AD line carefully. It’s very close now to a new ATH. If it makes it, then October this year may be too early.
If the AD line makes a new ATH then this bull market could go on into 2020.
I’m prepared to sell in October this year if my analysis sees a possible end then to the bull market (or before if that happens), and one of the biggest warnings I’ll be giving my friend is he needs to be prepared to do the same. If he’s not, I’ll not advise him.
I’m aware that any investment in this market right now is entering an ageing bull market that could turn bear at any time.
Hey Lara, yes Id be interested in this, particularly for the Aussie markets.
Hi Lara,
I’d definitely be in interested in the US and Aussie reports!
Thanks in advance,
Jiten
Lara I have learned so much from you, I was wondering if possible can you do a video of your how to (top down approach to finding stocks to buy using -sector rotation analysis)
-RRG analysis of strongest sectors
-individual stock chart classic technical analysis
-Elliott wave analysis and TA of the index.
If you can make a video so we can learn would be so wonderful love to see how you analyze different stocks would love to learn never had an opportunity to learn from a professional like yourself for me this would be a once in a lifetime opportunity. Love the service and thank you for everything.
And to answer your question for which country am I interested in for the new service you might be providing, for me I am interested in USA service 🙂
When my windows computer (!) arrives and I’ve got all my data ready, then yes, I’ll put it all into video format. As well as text and charts.
It would be once a month.
I should be ready to do this in about 3-4 more weeks.
Hi,
Do you have an updated daily wave count for oil? It seems to have bounced off of 51.30.
US Oil updated daily chart:
Minor wave B may now be complete. While price remains above the invalidation point assume minor wave C is under way to the target, now calculated at two degrees.
If this wave count is invalidated by a new low below 51.24 by any amount at any time frame, then expect minor wave B is continuing sideways as a double flat or double combination. This is possible, but today less likely than the idea that it is over.
The lower edge of the channel may provide support for pullbacks on the way up to the target. Minor wave C may end at resistance at the upper edge.
S&P500 daily chart update:
The last small pullback was just another small one within the ongoing upwards trend.
A new target is calculated for primary wave 1 to end. Primary wave 2 is still yet to arrive.
Hi Lara,
For the S&P 500, it was a strong day yesterday…. The AD line is a beast…. Did the count change? It looks like we are going straight to 2800 soon.
Thanks,
Mathieu
Yes, the count changed to see P1 incomplete again. Chart above.
Thanks
My multi-TF view of GLD, monthly, weekly, daily, hourly (clockwise from top left).
I think it’s important to note that any short in the very near future in GLD is a counter trend trade. The monthly trend is up (yellow bars), and the weekly is strong up (green bars). So a short intended as a multi-day or week swing trade is clearly counter trend.
That all said, the EW count is telling us a break below that trend line has far higher than normal potential to be the start of a very large move.
I’ll be taking a 1/4rd size position on a break of the TL, another 1/4 size add on violation of the swing slow on the daily in January, and for the second 1/2
I’ll wait for the weekly bars to go down to neutral trend, then time an entry at the daily/hourly via a pullback and turn back down. That one I may scale in as well at 1/4 and 1/4.
Good set up to the short side!
I agree, the trend for Gold is currently up. Any shorts here are counter trend trades, which is not advised.
That’s the problem from time to time with an Elliott wave count. When the structure is complete the EW count expects a trend change, and it can do so before any indication of that happening.
And that’s why I went through the process of looking for a bullish alternate for Gold. What if my wave count is wrong and the trend continues up from here? What would that look like?
Hi Lara,
Excellent work as always… My question is for Gold. Cycle Wave a lasted more than 4 years and it looks like Cycle Wave b is lasting a little bit more than 3 years…. Would Cycle wave c be proportional in time to Cycle wave a as a more likely scenario?
Thanks
Mathieu
That’s a good question.
Generally, cycle waves may be expected to last about 1-7 years.
Cycle wave c could be in proportion to cycle wave a. Or it could be quicker. My first expectation may be a Fibonacci 3 years.
I wouldn’t expect it to be longer, as there’s not enough room below for that.
Thanks Lara… Appreciate it.