
A bounce or sideways correction was expected to continue for the last week. An upwards week exactly fits this expectation. The target remains the same.
Summary: A bounce is expected to continue. The target is about 63.71.
The larger picture still sees Oil in a new downwards trend to end reasonably below 26.06.
New updates to this analysis are in bold.
MAIN ELLIOTT WAVE COUNT
MONTHLY CHART
Click chart to enlarge.
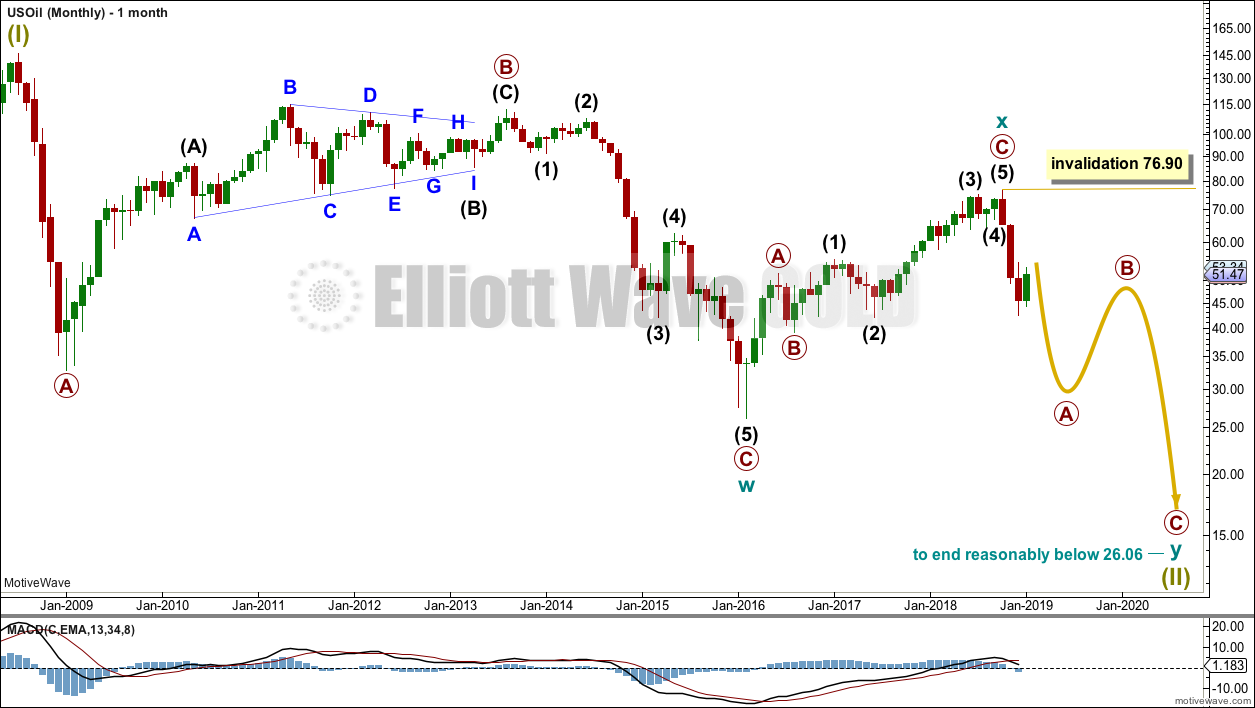
Classic technical analysis favours a bearish wave count for Oil at this time.
The large fall in price from the high in June 2008 to February 2016 is seen as a complete three wave structure. This large zigzag may have been only the first zigzag in a deeper double zigzag.
The first zigzag down is labelled cycle wave w. The double is joined by a now complete three in the opposite direction, a zigzag labelled cycle wave x.
The purpose of a second zigzag in a double is to deepen the correction when the first zigzag does not move price deep enough. Cycle wave y would be expected to move reasonably below the end of cycle wave w to deepen the correction. Were cycle wave y to reach equality with cycle wave w that takes Oil into negative price territory, which is not possible. Cycle wave y would reach 0.618 the length of cycle wave w at $2.33.
A better target calculation would be using the Fibonacci ratios between primary waves A and C within cycle wave y. This cannot be done until both primary waves A and B are complete.
Within cycle wave y, no second wave correction nor B wave may move beyond its start above 76.90.
WEEKLY CHART
Click chart to enlarge.
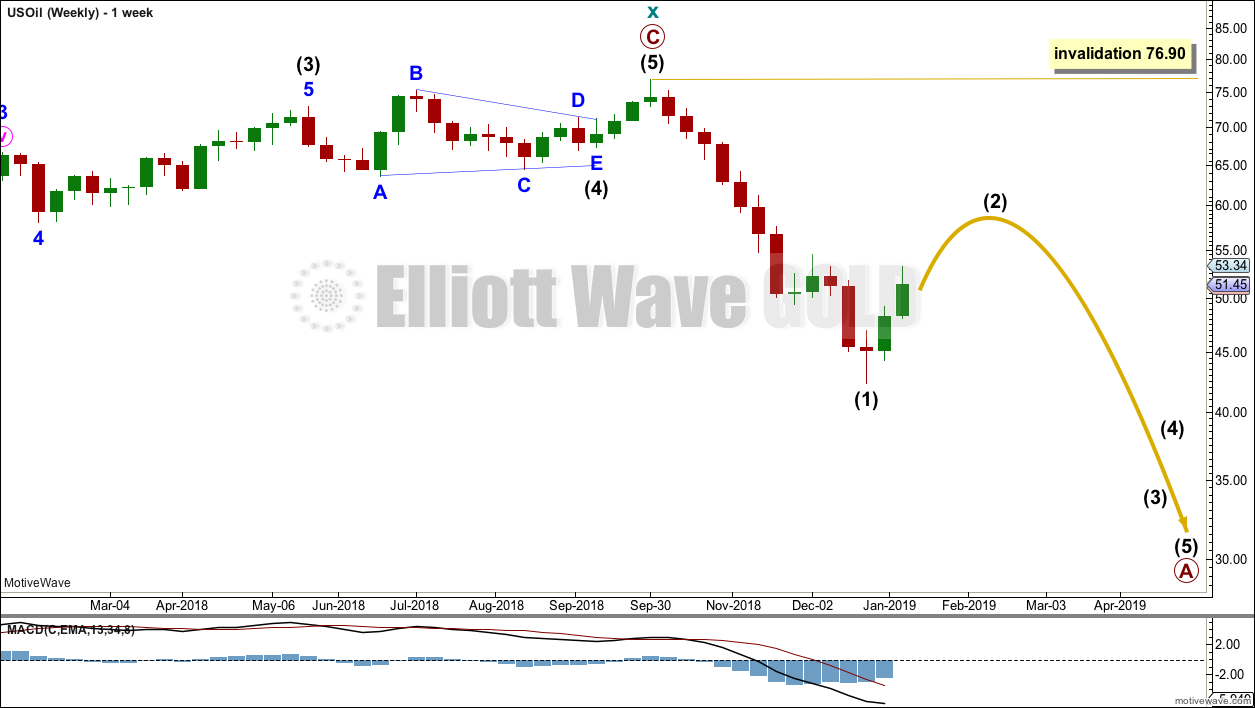
This weekly chart is focussed on the start of cycle wave y.
Cycle wave y is expected to subdivide as a zigzag. A zigzag subdivides 5-3-5. Primary wave A must subdivide as a five wave structure if this wave count is correct.
Within primary wave A, intermediate wave (1) may now be complete. Intermediate wave (2) may unfold over a few weeks as a sideways choppy consolidation, or a deep sharp bounce. At this stage, it looks more likely to be a deep bounce.
Intermediate wave (2) may not move beyond the start of intermediate wave (1) above 76.90.
DAILY CHART
Click chart to enlarge.
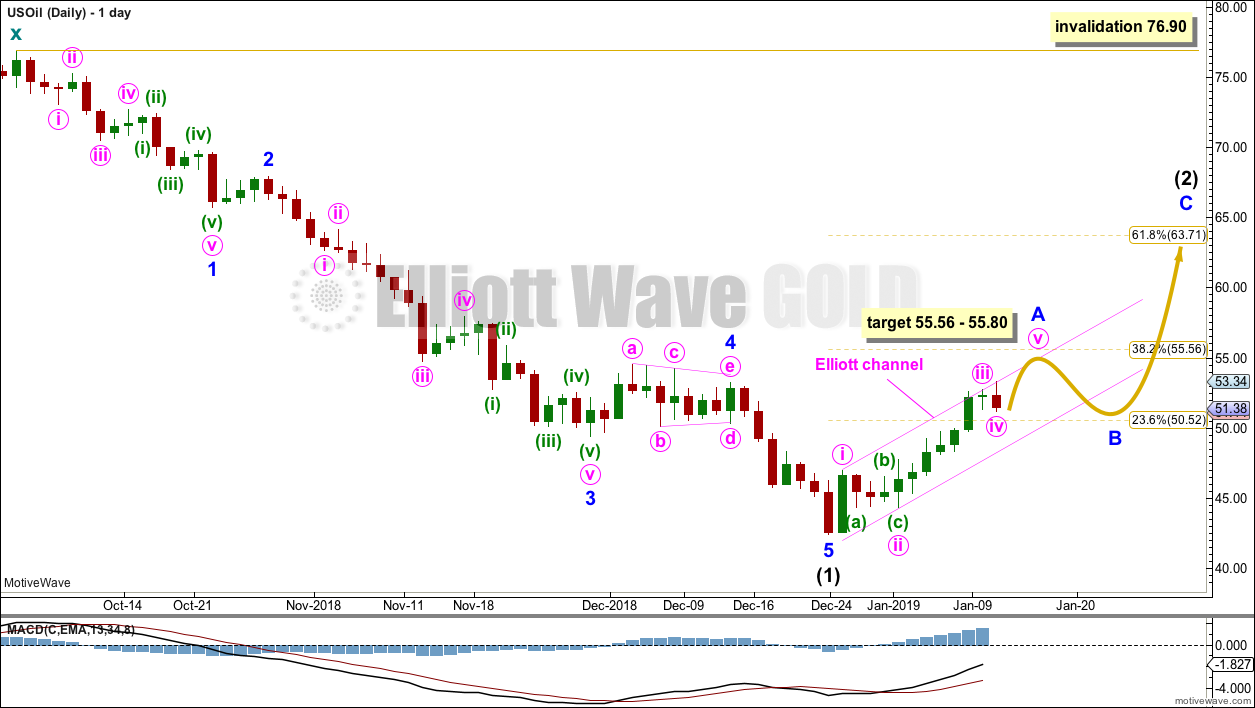
Intermediate wave (2) would most likely subdivide as a zigzag and at this stage that is how it will be labelled. However, it may also subdivide as a flat or combination. It is impossible at this stage to know which structure it will unfold as. The labelling within it will most likely change as it unfolds.
If intermediate wave (2) is unfolding as a zigzag, then within it minor wave A must subdivide as a five wave structure. Within minor wave A, minute waves i to iv may now be complete.
Minute wave v would be likely to make at least a slight new high above the end of minute wave iii at 52.78 to avoid a truncation. Minute wave v would reach equality in length with minute wave i at 55.80. This is close to the 0.382 Fibonacci ratio of intermediate wave (1) at 55.56, giving a small target zone for minor wave A to end.
A channel is drawn about minor wave A. If this channel is breached by downwards movement, that may be taken as an indication that minor wave A may be complete and minor wave B may have begun.
Intermediate wave (2) may be very deep. It should last at least four weeks, so that it shows up on the monthly chart.
Intermediate wave (2) may not move beyond the start of intermediate wave (1) above 76.90.
TECHNICAL ANALYSIS
MONTHLY CHART
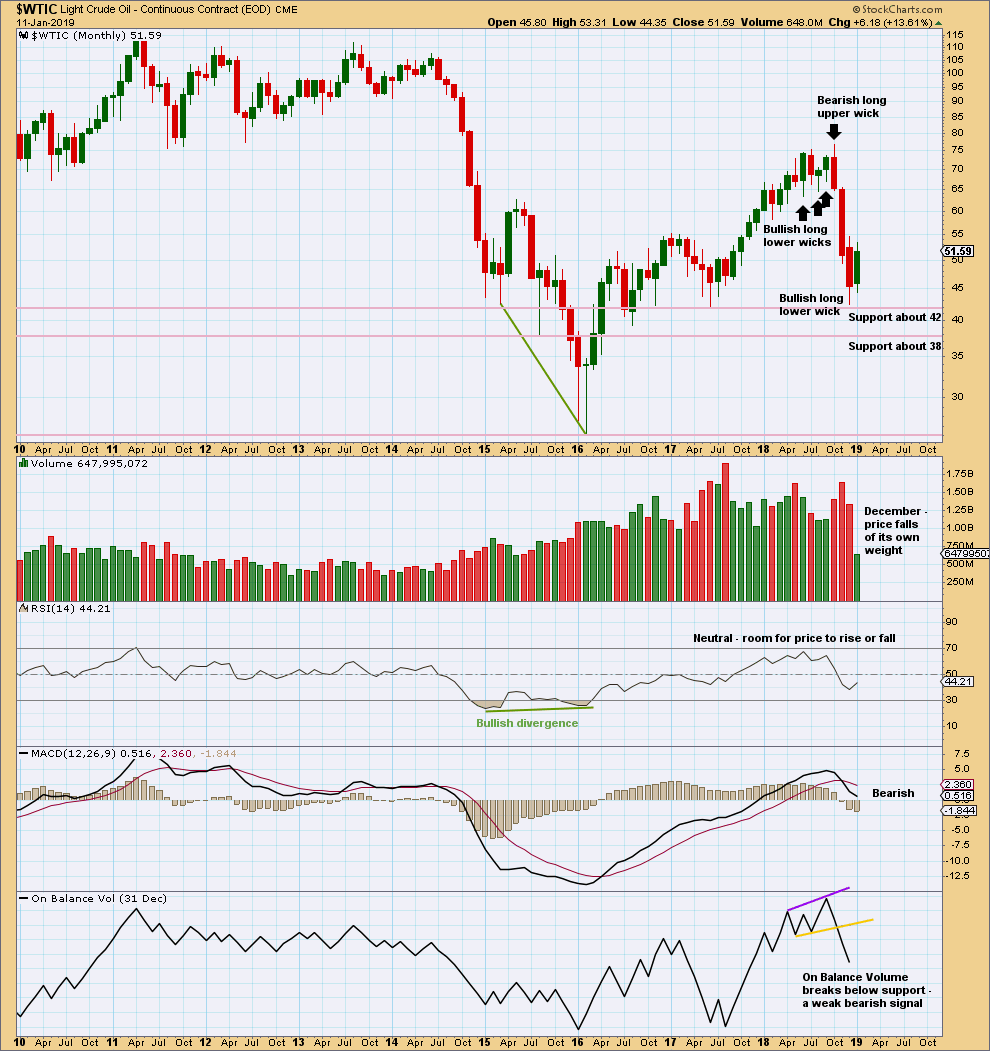
Click chart to enlarge. Chart courtesy of StockCharts.com.
Lower volume and a slightly bullish long lower wick for December add a little support to the Elliott wave count.
WEEKLY CHART
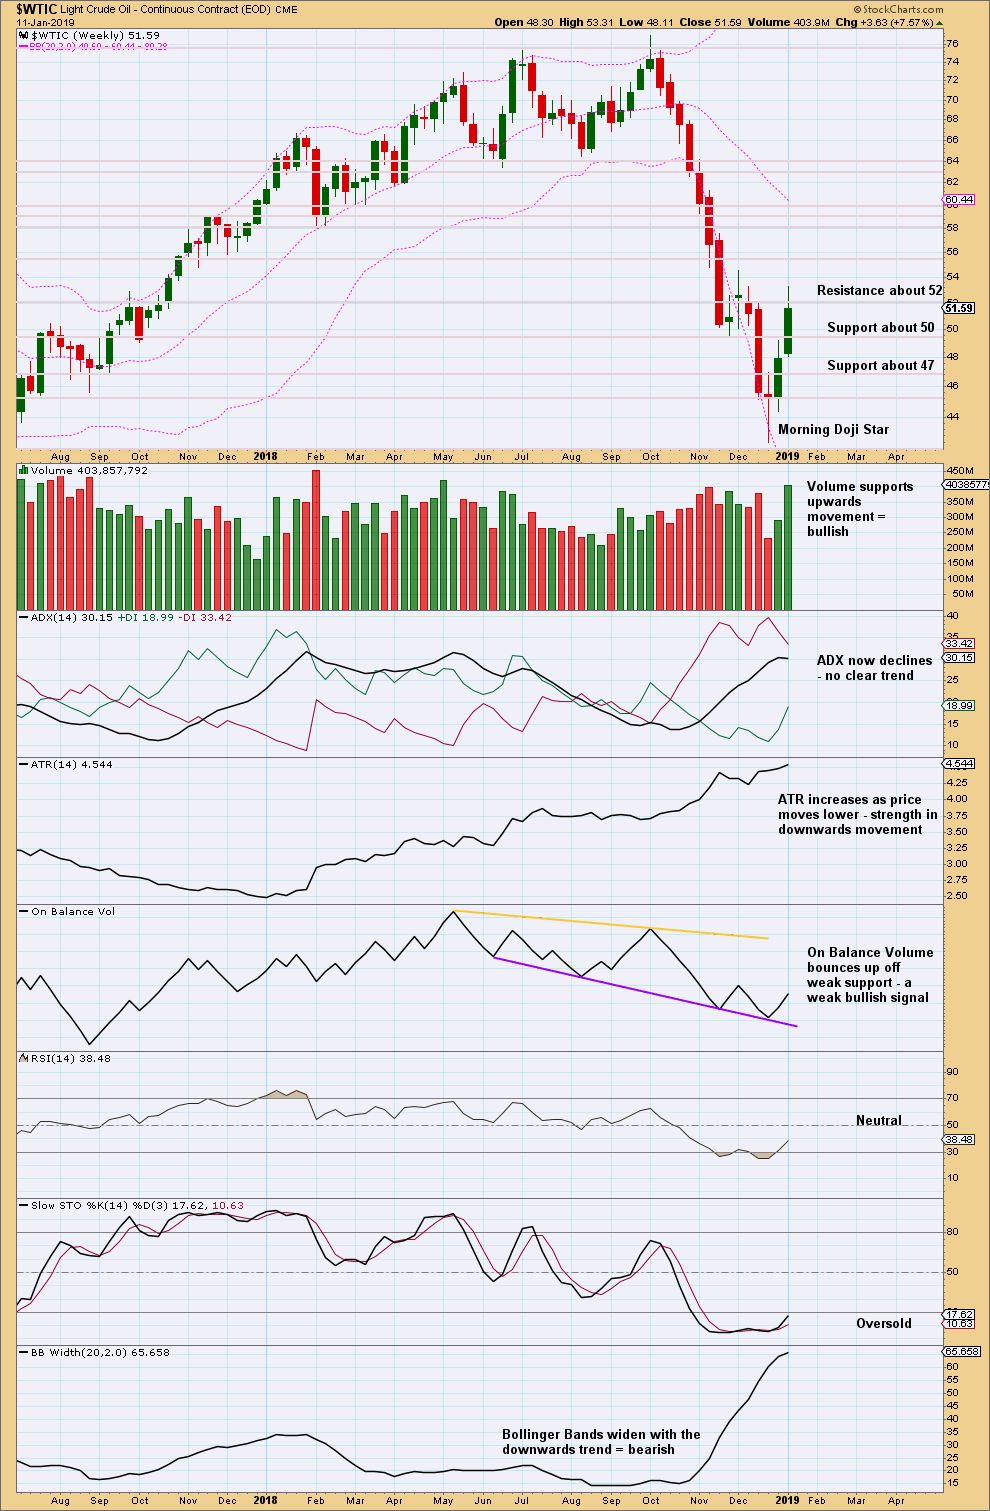
Click chart to enlarge. Chart courtesy of StockCharts.com.
Strong volume supporting upwards movement is bullish, but because of the longer upper wick on this weekly candlestick there may be some downwards movement for the short term.
DAILY CHART
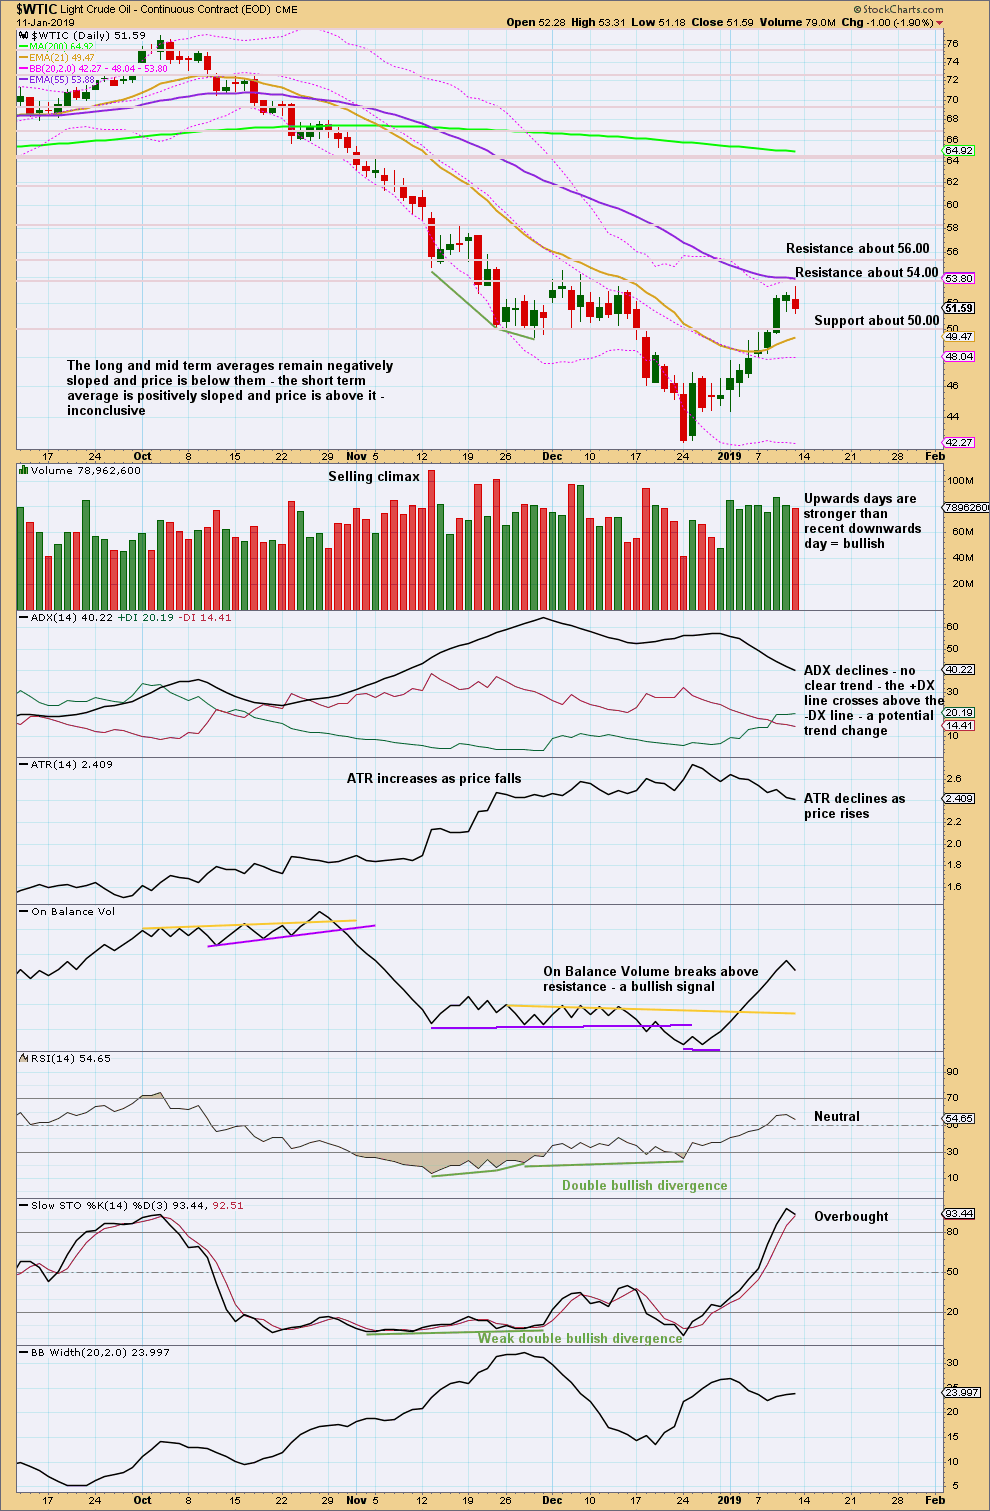
Click chart to enlarge. Chart courtesy of StockCharts.com.
Upwards movement may be expected to continue to resistance noted on the chart. Overall, this chart continues to support the Elliott wave count.
Published @ 08:48 p.m. EST.
—
Careful risk management protects your trading account(s).
Follow my two Golden Rules:
1. Always trade with stops.
2. Risk only 1-5% of equity on any one trade.