
The week was expected to begin with a little downwards movement to a target at 50.91 to 50.82. The week did begin with a little downwards movement, finding a low at 51.24, 0.33 short of the target zone.
An update for members intra-week, on the 13th of February, indicated a low was likely in place. Thereafter, price has moved higher to end the week.
Summary: The upwards bounce should continue to the final target zone about 63.19 to 63.71. This target may be met in another two to six weeks.
The larger picture still sees Oil in a new downwards trend to end reasonably below 26.06.
New updates to this analysis are in bold.
MAIN ELLIOTT WAVE COUNT
MONTHLY CHART
Click chart to enlarge.
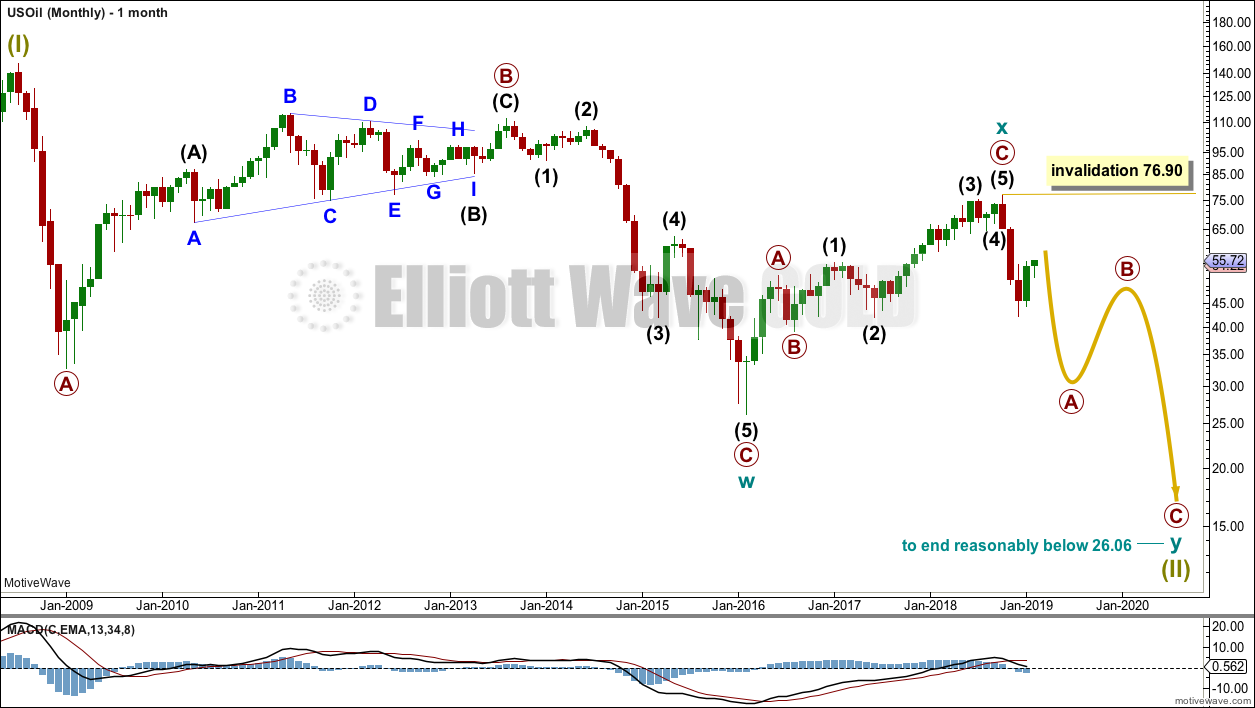
Classic technical analysis favours a bearish wave count for Oil at this time.
The large fall in price from the high in June 2008 to February 2016 is seen as a complete three wave structure. This large zigzag may have been only the first zigzag in a deeper double zigzag.
The first zigzag down is labelled cycle wave w. The double is joined by a now complete three in the opposite direction, a zigzag labelled cycle wave x.
The purpose of a second zigzag in a double is to deepen the correction when the first zigzag does not move price deep enough. Cycle wave y would be expected to move reasonably below the end of cycle wave w to deepen the correction. Were cycle wave y to reach equality with cycle wave w that takes Oil into negative price territory, which is not possible. Cycle wave y would reach 0.618 the length of cycle wave w at $2.33.
A better target calculation would be using the Fibonacci ratios between primary waves A and C within cycle wave y. This cannot be done until both primary waves A and B are complete.
Within cycle wave y, no second wave correction nor B wave may move beyond its start above 76.90.
WEEKLY CHART

Click chart to enlarge.
This weekly chart is focussed on the start of cycle wave y.
Cycle wave y is expected to subdivide as a zigzag. A zigzag subdivides 5-3-5. Primary wave A must subdivide as a five wave structure if this wave count is correct.
Within primary wave A, intermediate wave (1) may now be complete. Intermediate wave (2) so far looks like it is unfolding as a zigzag, which is the most common Elliott wave structure for a second wave, and so far it has lasted seven weeks. If it completes in a total Fibonacci thirteen weeks, then it may continue now for a further six weeks. It may however not be as long lasting as that; it may not exhibit a Fibonacci duration.
Intermediate wave (2) may not move beyond the start of intermediate wave (1) above 76.90.
MAIN DAILY CHART
Click chart to enlarge.
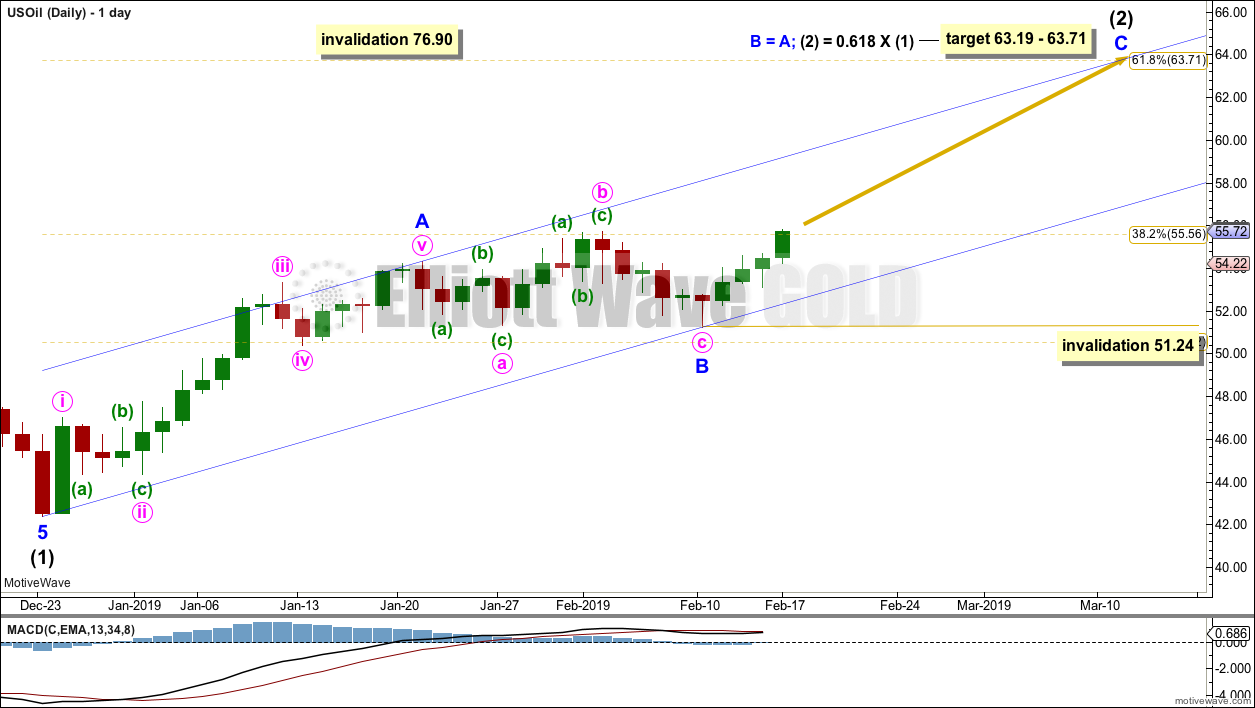
Intermediate wave (2) would most likely subdivide as a zigzag and at this stage that is how it will be labelled, and that is how it looks like it is subdividing. However, it may also subdivide as a flat or combination. It is impossible at this stage to be confident as to which structure it will unfold as. The labelling within it may yet change as it unfolds.
If intermediate wave (2) is unfolding as a zigzag, then within it minor waves A and B may now both be complete.
Another five wave structure upwards for minor wave C may be expected to unfold.
The target is now widened to a small zone calculated at two degrees.
The channel is drawn about intermediate wave (2) using Elliott’s technique for a correction. Any pullbacks along the way up within minor wave C may find support about the lower edge of this channel. Minor wave C may end either mid way within the channel or more likely about the upper edge.
Within minor wave C, no second wave correction may move beyond the start of its first wave below 51.24.
Intermediate wave (2) may be very deep.
Intermediate wave (2) may not move beyond the start of intermediate wave (1) above 76.90.
If price moves below the lower edge of the blue Elliott channel, then the alternate wave count below would be indicated.
ALTERNATE DAILY CHART
Click chart to enlarge.
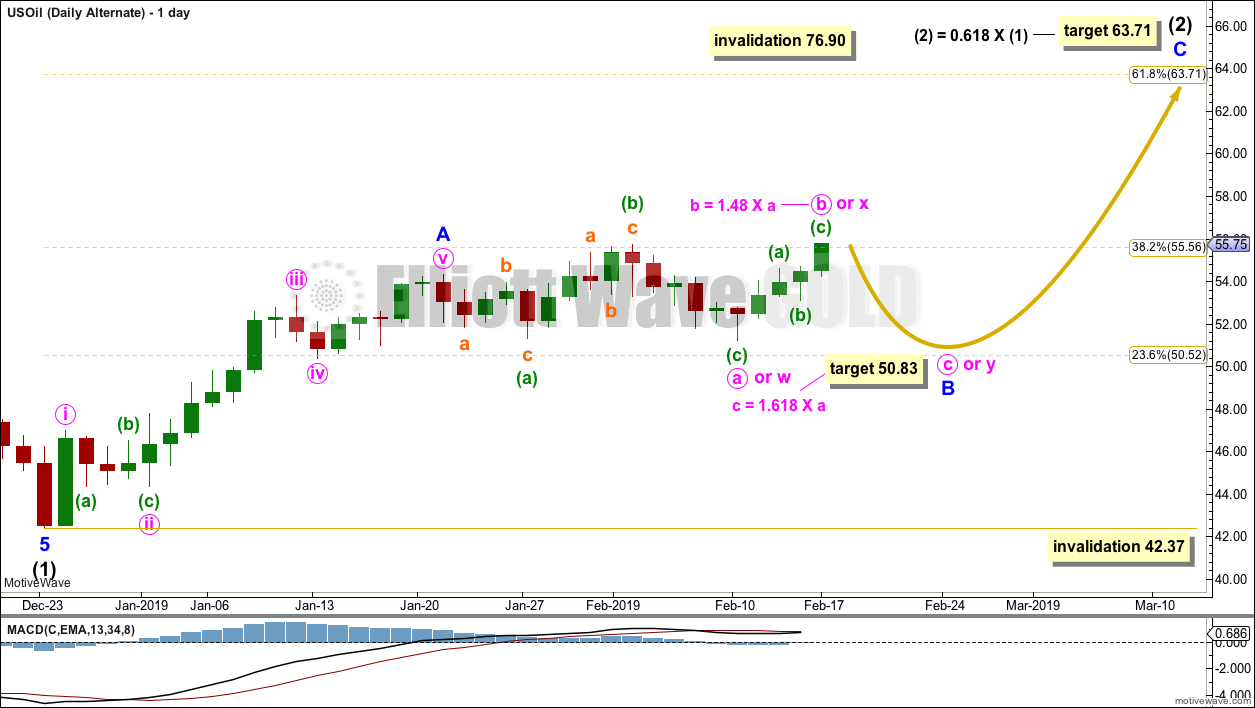
Upwards movement to a new high this week comes with reasonable weakness. This suggests that it may be a continuation of minor wave B; B waves should exhibit weakness.
The degree of labelling within minor wave B is moved one degree lower for this alternate wave count.
Minor wave B may be continuing sideways as a single flat, double flat or double combination.
If minor wave B is continuing as a single flat correction, then within it minute wave a may be a complete expanded flat correction. Minute wave b may be a complete zigzag and just beyond the most common length to minute wave a of 1 to 1.38, but within an allowable limit of up to 2 times the length of minute wave a. Minute wave c may end at the most common Fibonacci ratio to minute wave a of 1.618.
If minor wave B is continuing as a double flat correction, then within it the first flat may be complete, labelled minute wave w. The double may be joined by a complete three in the opposite direction, a zigzag labelled minute wave X. The second flat in the correction may now unfold, labelled minute wave y, that would likely end about the same level as minute wave w at 51.24.
If minor wave B is continuing as a double combination, then the second structure in the double may now unfold as a zigzag, labelled minute wave y, that would likely end about the same level as minute wave w at 51.24.
TECHNICAL ANALYSIS
MONTHLY CHART
Click chart to enlarge. Chart courtesy of StockCharts.com.
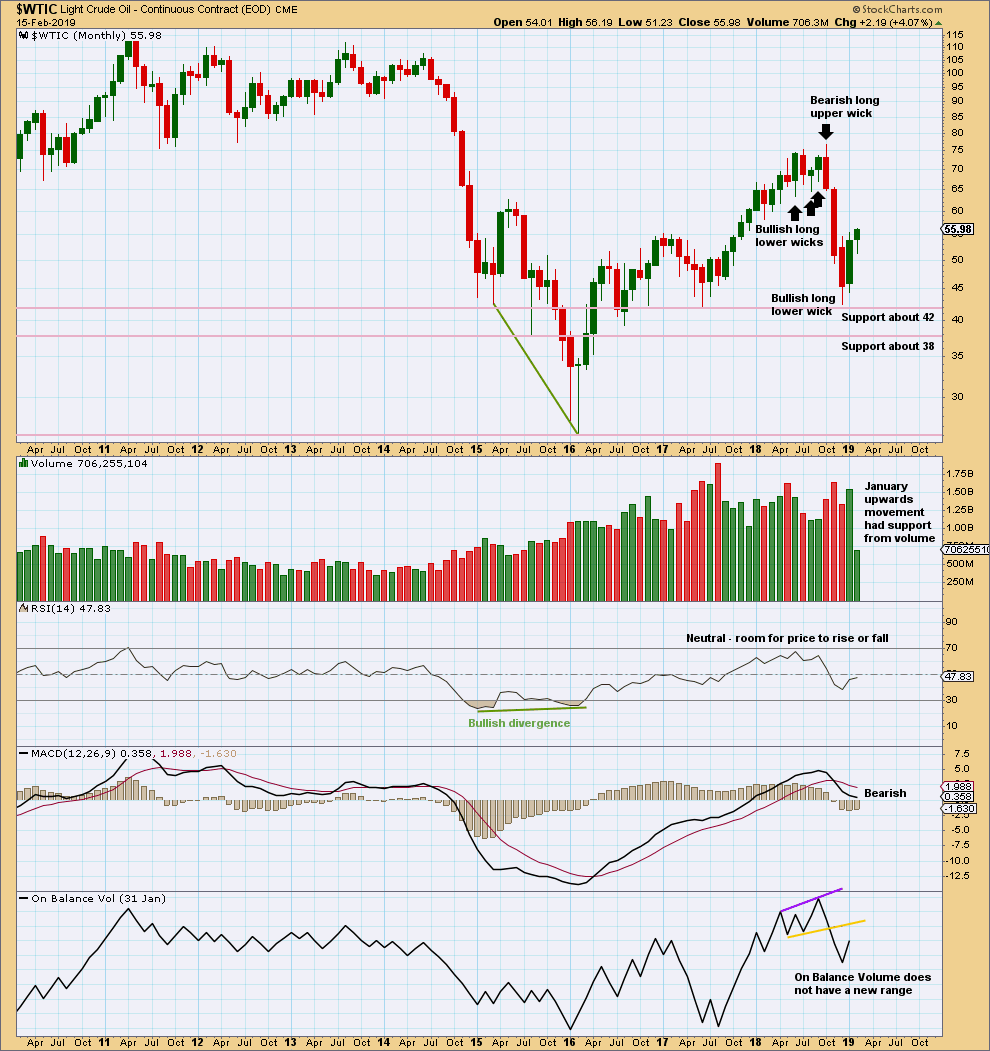
Upwards movement within January has support from volume. This supports the Elliott wave count which expects overall more upwards movement in coming weeks.
WEEKLY CHART
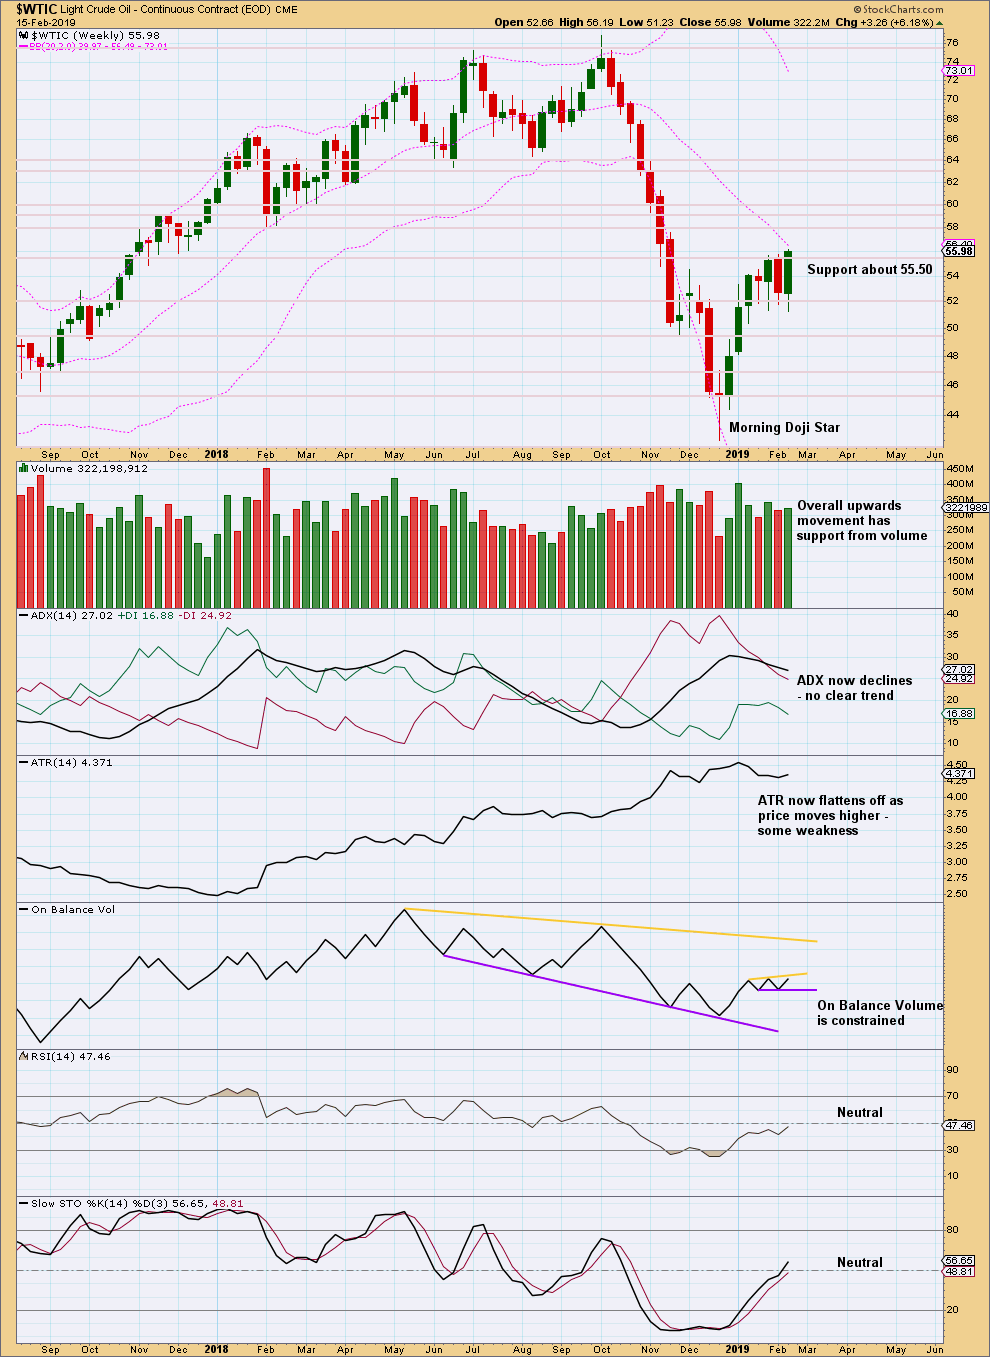
Click chart to enlarge. Chart courtesy of StockCharts.com.
An outside week closed green and the balance of volume was upwards. Upwards movement within the week looks to have support from volume, but for a clearer picture we should look inside the week at daily volume bars.
A new smaller range is drawn about On Balance Volume. A breakout would provide a weak signal.
DAILY CHART
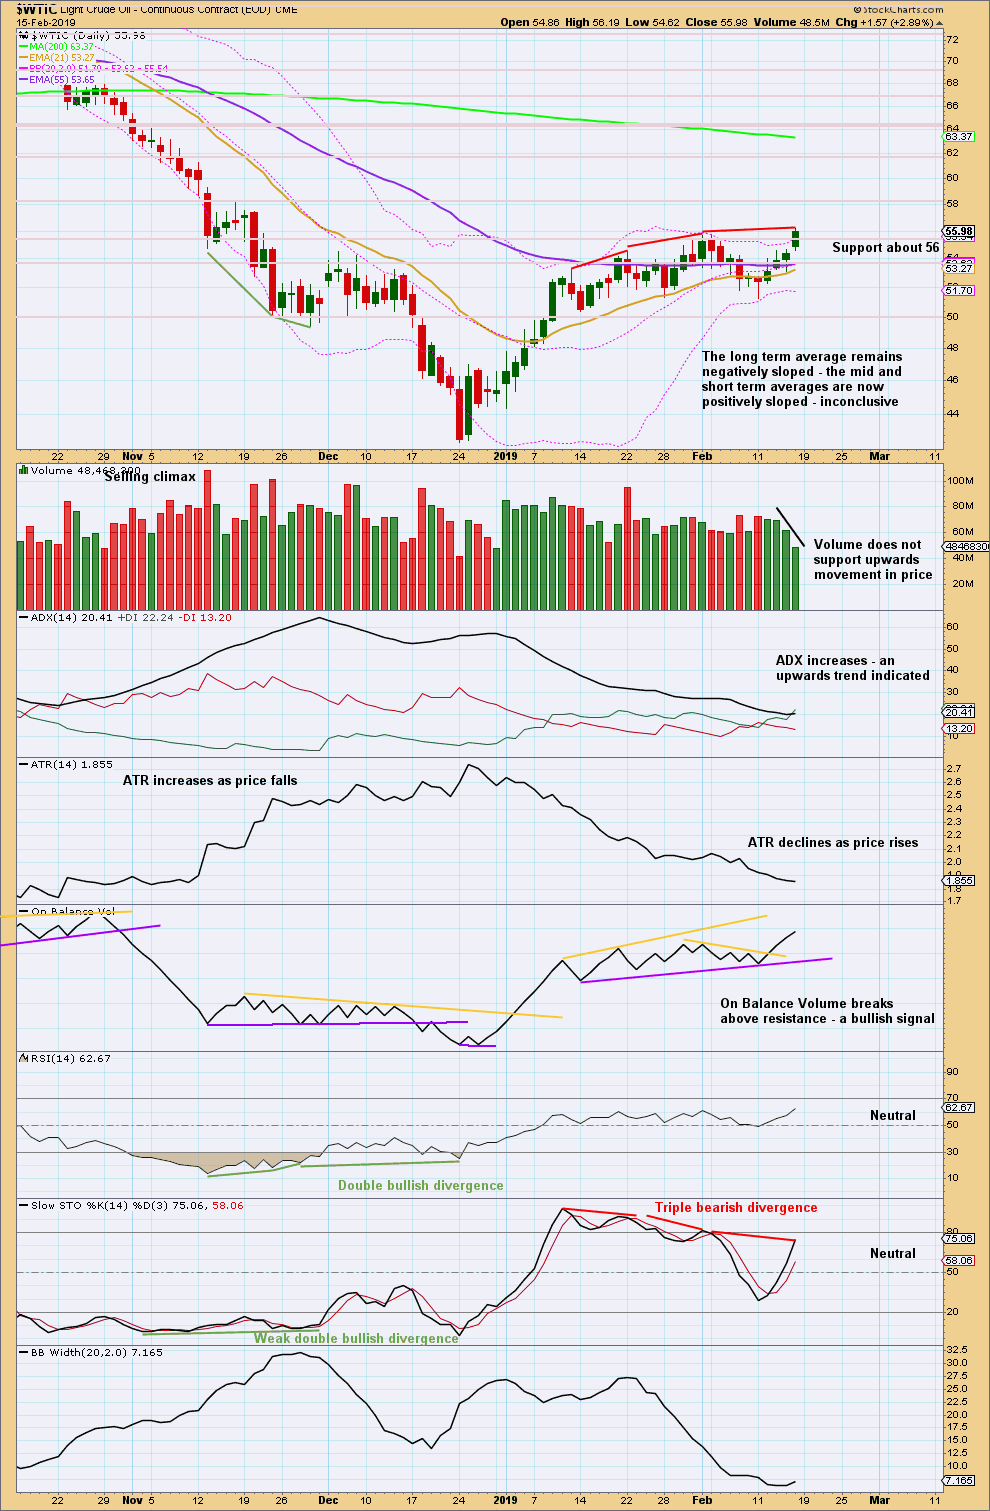
Click chart to enlarge. Chart courtesy of StockCharts.com.
Price has broken above resistance to a new high, but it comes with weakness. Volume does not support it and RSI now exhibits triple bearish divergence. This supports the alternate daily Elliott wave count.
This outlook could change though if another upwards day shows reasonable strength.
Published @ 08:45 p.m. EST.
—
Careful risk management protects your trading account(s).
Follow my two Golden Rules:
1. Always trade with stops.
2. Risk only 1-5% of equity on any one trade.