
Some downwards movement was expected for this week. After a very slight new high on Monday, this is how the week unfolded.
Summary: A little downwards movement may continue next week to complete wave B about 50.91 to 50.82. Thereafter, the upwards bounce should continue to the final target about 63.71.
The larger picture still sees Oil in a new downwards trend to end reasonably below 26.06.
New updates to this analysis are in bold.
MAIN ELLIOTT WAVE COUNT
MONTHLY CHART
Click chart to enlarge.
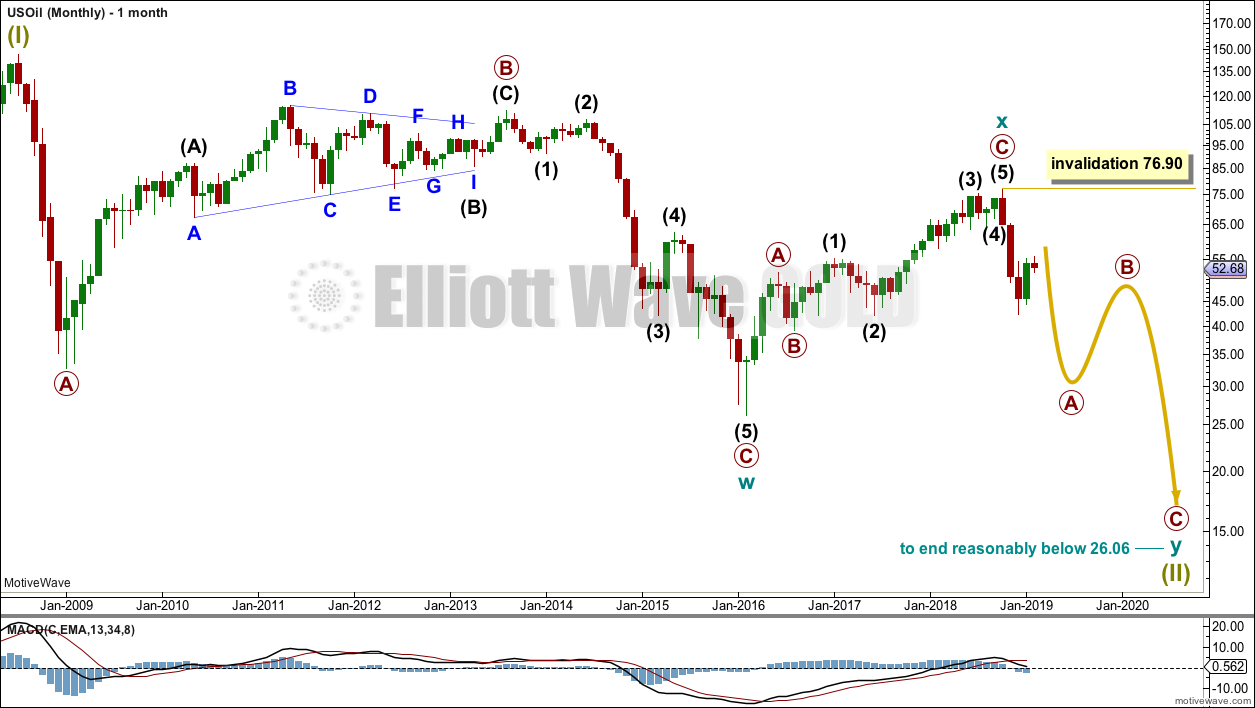
Classic technical analysis favours a bearish wave count for Oil at this time.
The large fall in price from the high in June 2008 to February 2016 is seen as a complete three wave structure. This large zigzag may have been only the first zigzag in a deeper double zigzag.
The first zigzag down is labelled cycle wave w. The double is joined by a now complete three in the opposite direction, a zigzag labelled cycle wave x.
The purpose of a second zigzag in a double is to deepen the correction when the first zigzag does not move price deep enough. Cycle wave y would be expected to move reasonably below the end of cycle wave w to deepen the correction. Were cycle wave y to reach equality with cycle wave w that takes Oil into negative price territory, which is not possible. Cycle wave y would reach 0.618 the length of cycle wave w at $2.33.
A better target calculation would be using the Fibonacci ratios between primary waves A and C within cycle wave y. This cannot be done until both primary waves A and B are complete.
Within cycle wave y, no second wave correction nor B wave may move beyond its start above 76.90.
WEEKLY CHART
Click chart to enlarge.
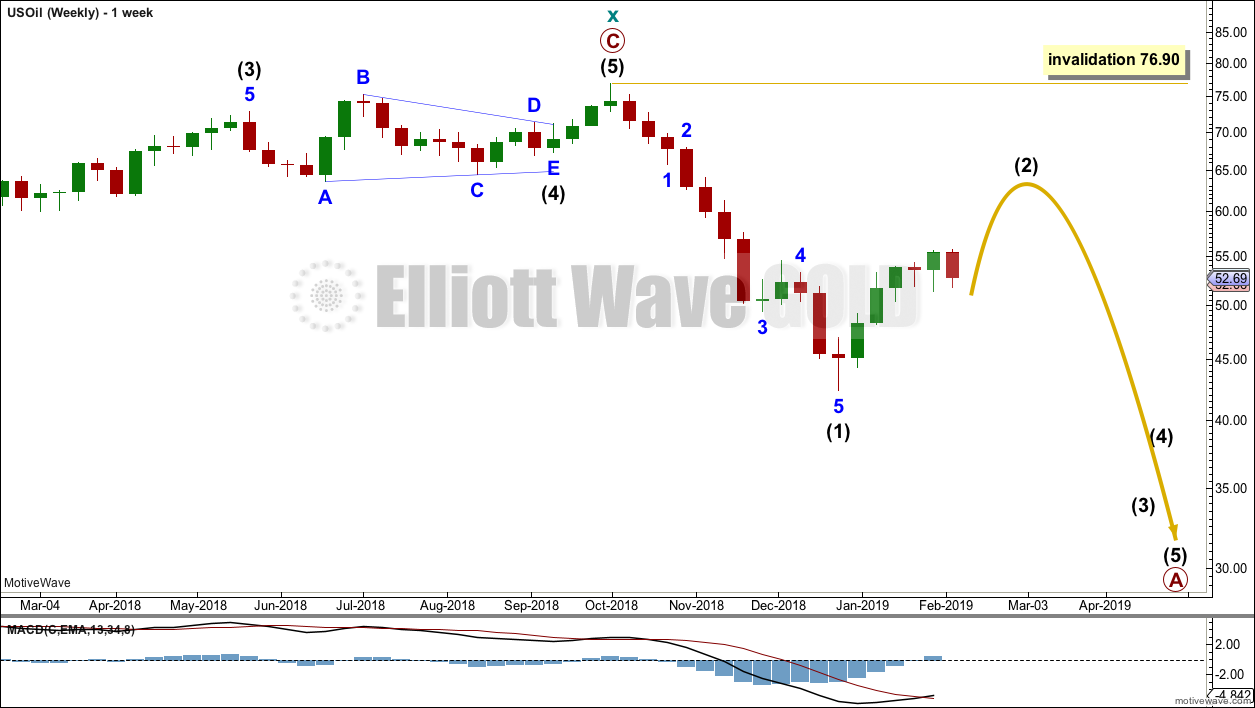
This weekly chart is focussed on the start of cycle wave y.
Cycle wave y is expected to subdivide as a zigzag. A zigzag subdivides 5-3-5. Primary wave A must subdivide as a five wave structure if this wave count is correct.
Within primary wave A, intermediate wave (1) may now be complete. Intermediate wave (2) may unfold over a few weeks as a sideways choppy consolidation, or a deep sharp bounce. At this stage, it looks more likely to be a deep bounce.
Intermediate wave (2) should look like a three wave structure when it is complete on the weekly chart; for that to happen minor wave B within it should be clear.
Intermediate wave (2) may not move beyond the start of intermediate wave (1) above 76.90.
MAIN DAILY CHART
Click chart to enlarge.
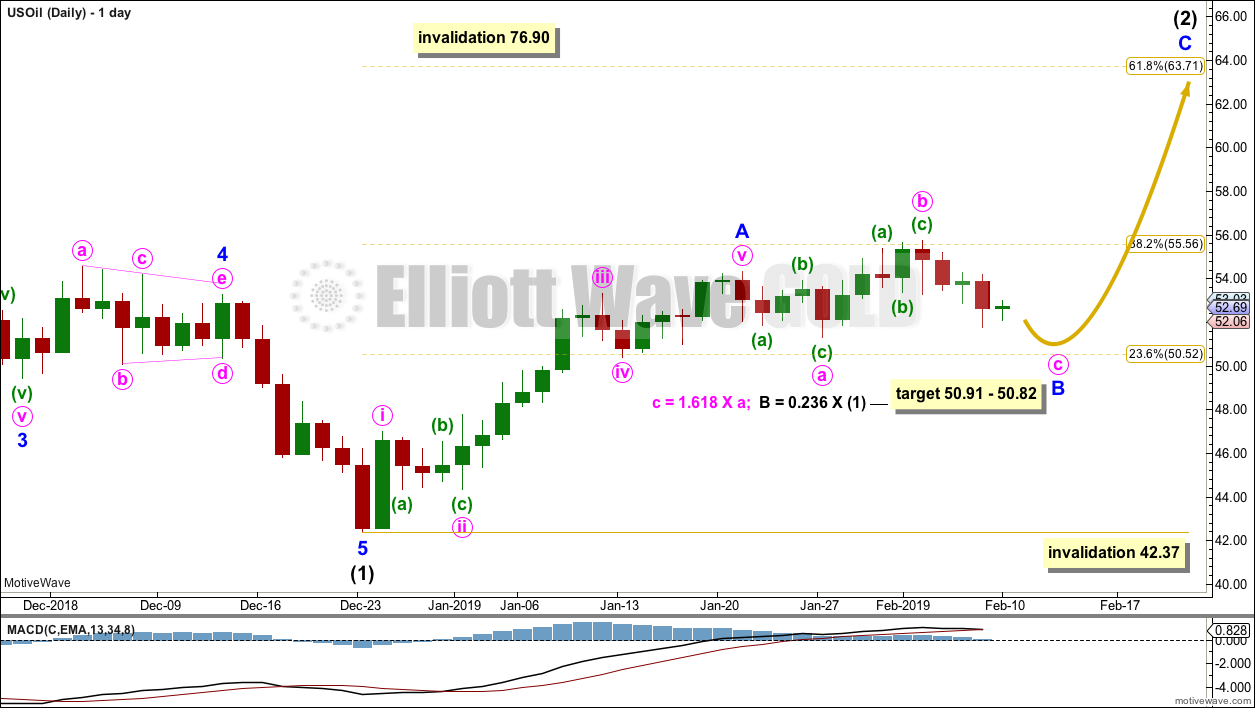
Intermediate wave (2) would most likely subdivide as a zigzag and at this stage that is how it will be labelled. However, it may also subdivide as a flat or combination. It is impossible at this stage to know which structure it will unfold as. The labelling within it may change as it unfolds.
If intermediate wave (2) is unfolding as a zigzag, then within it minor wave A may now be a complete impulse.
Minor wave B may not move beyond the start of minor wave A below 42.37.
At this stage, minor wave B may be unfolding as an expanded flat correction, which is a fairly common structure. Within this expanded flat, minute wave b is now a 1.48 length of minute wave a. This is longer than the common range of 1 to 1.38 times the length of minute wave a, but within an allowable limit of up to 2 times minute wave a.
A target is calculated for minute wave c to to reach the most common Fibonacci ratio to minute wave a for an expanded flat.
When minor wave B is complete, then another five wave structure upwards for minor wave C may be expected to unfold.
Intermediate wave (2) may be very deep.
Intermediate wave (2) may not move beyond the start of intermediate wave (1) above 76.90.
TECHNICAL ANALYSIS
MONTHLY CHART
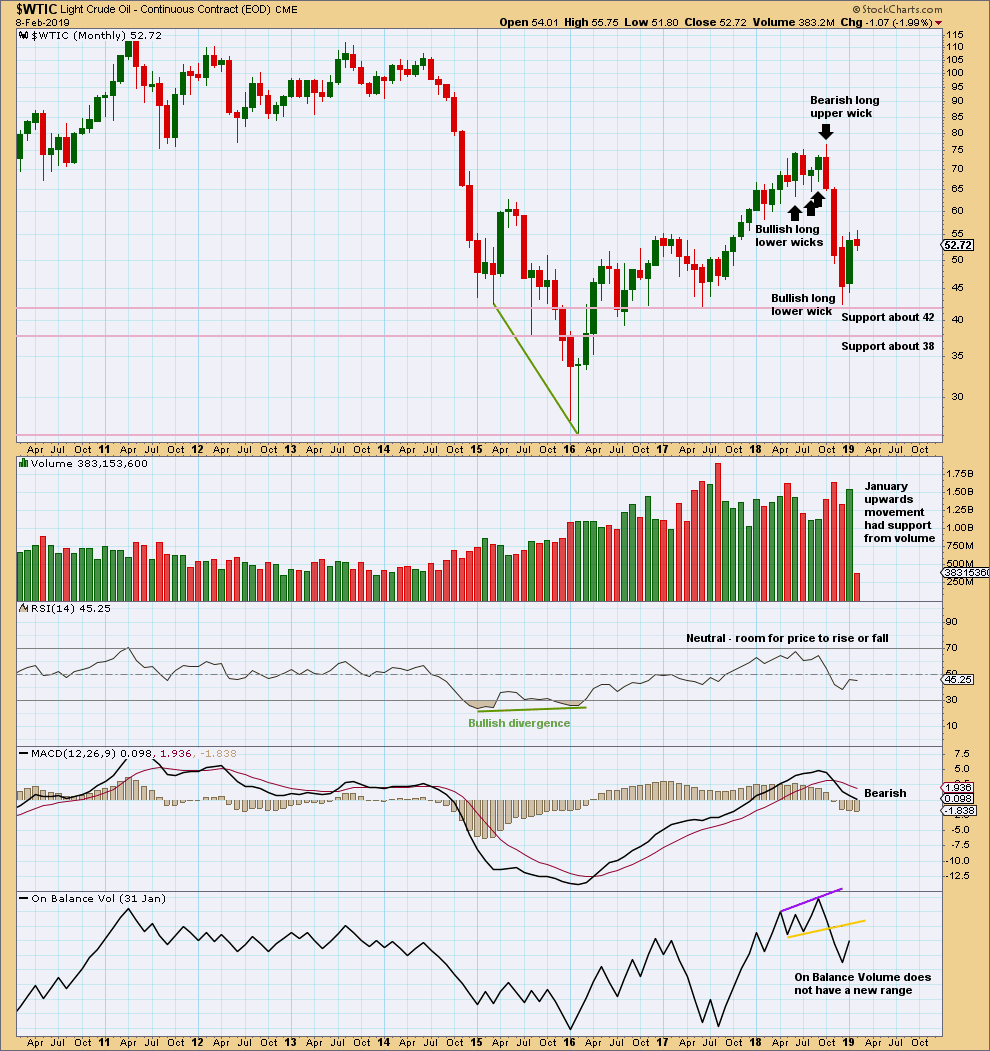
Click chart to enlarge. Chart courtesy of StockCharts.com.
Upwards movement within January has support from volume. This supports the Elliott wave count which expects overall more upwards movement in coming weeks.
WEEKLY CHART
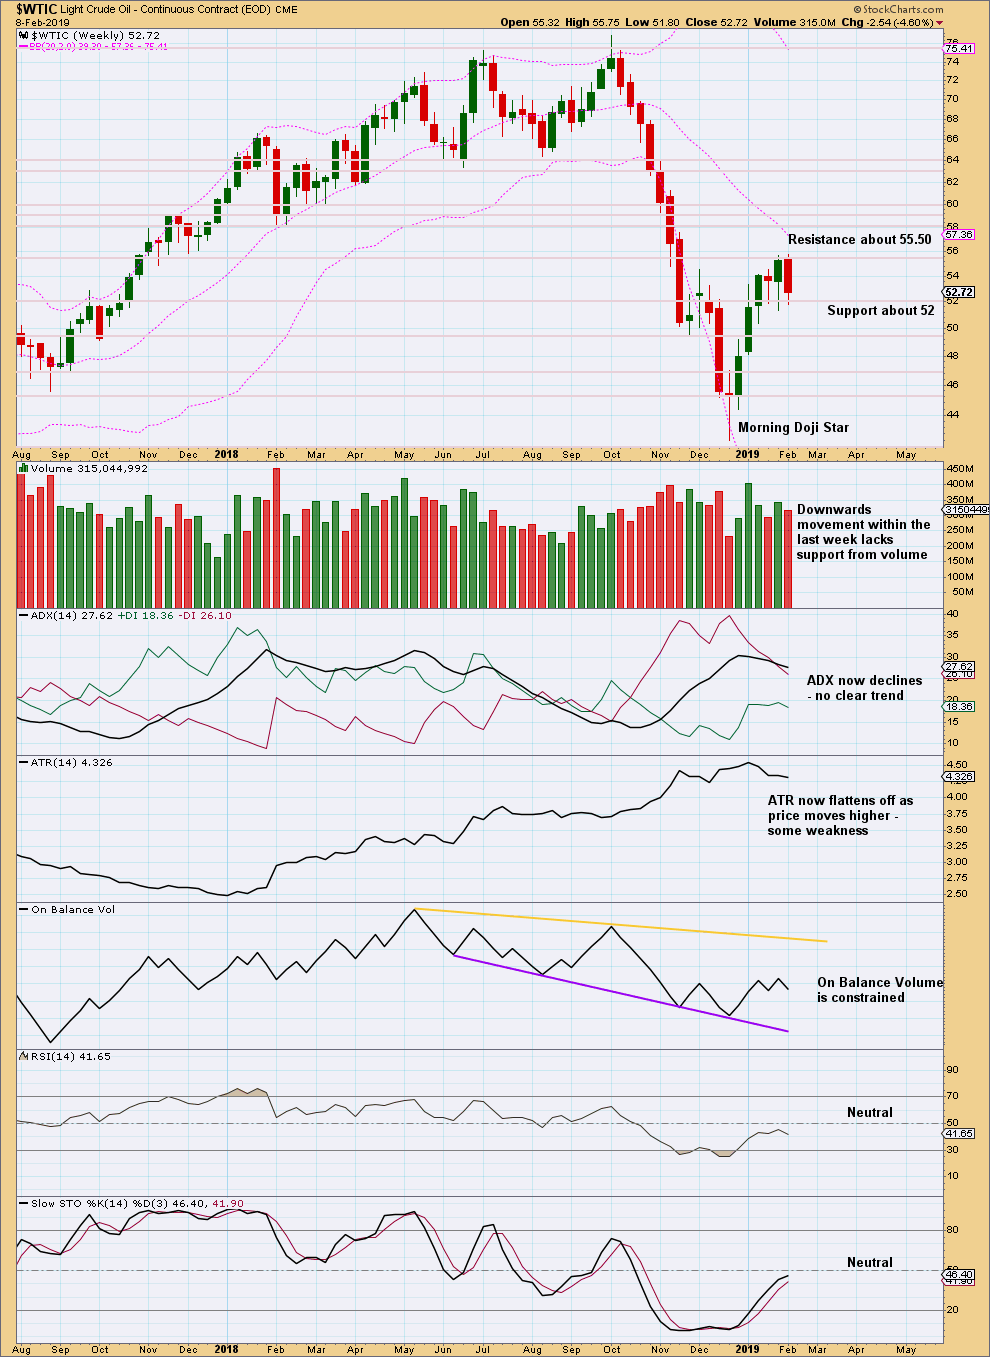
Click chart to enlarge. Chart courtesy of StockCharts.com.
This week completes an upwards week with a higher high and a higher low, but the balance of volume was downwards and the candlestick closed red. Downwards movement within the week saw price fall of its own weight.
DAILY CHART
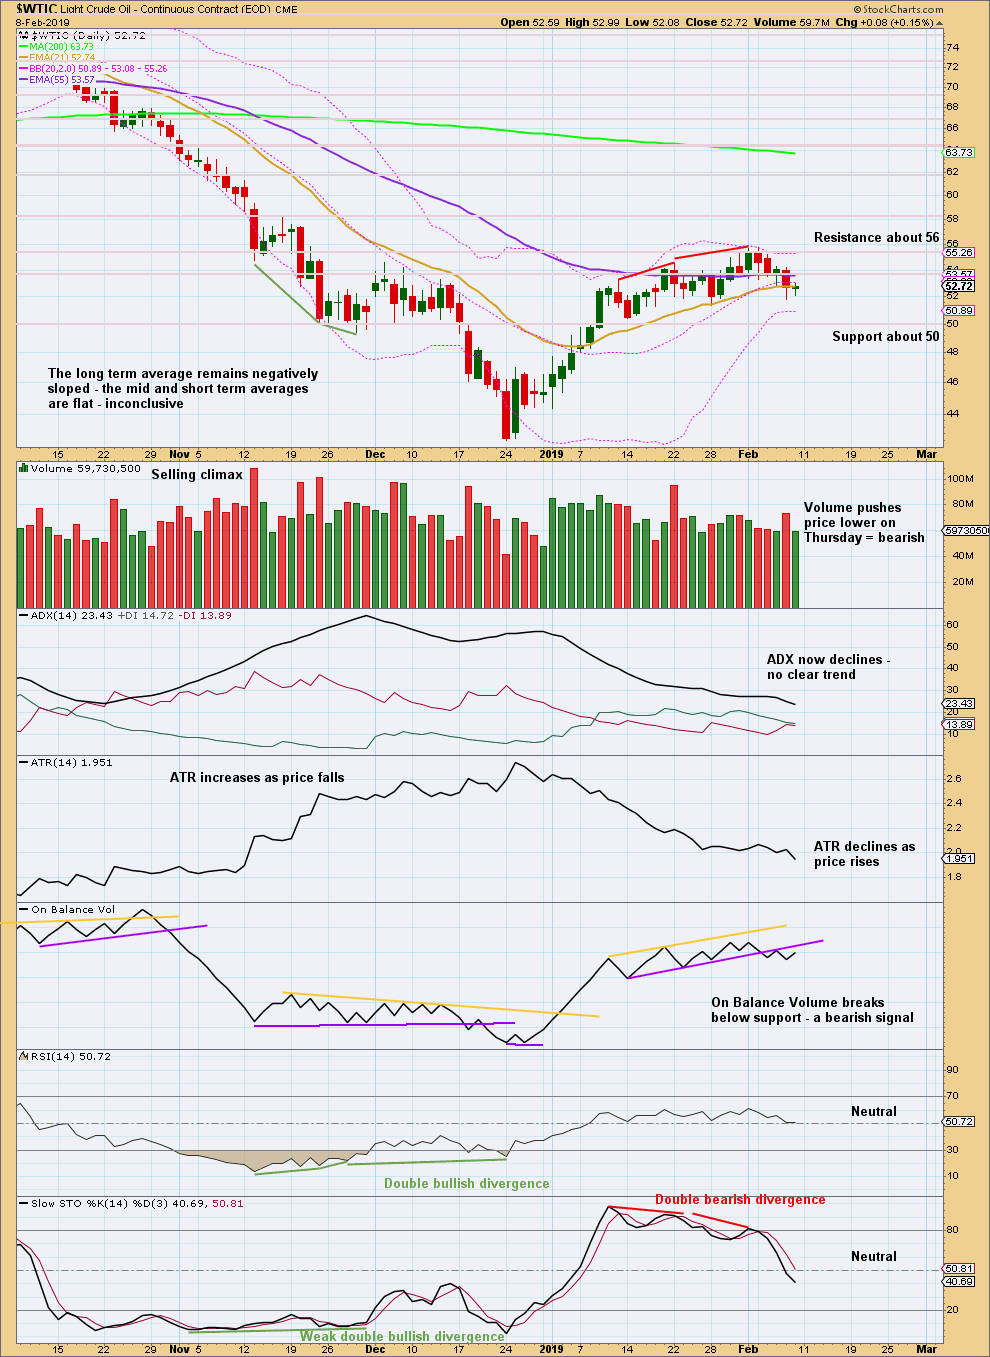
Click chart to enlarge. Chart courtesy of StockCharts.com.
The short-term volume profile is bearish. Look for next support about 50.00.
Published @ 08:34 p.m. EST.
—
Careful risk management protects your trading account(s).
Follow my two Golden Rules:
1. Always trade with stops.
2. Risk only 1-5% of equity on any one trade.