
Price this week remains range bound. Two Elliott wave counts are again used to identify targets after a breakout.
Summary: The larger picture still sees Oil in a new downwards trend to end reasonably below 26.06.
For the short term, a new high above 57.88 would indicate the bounce is not over. The target would be about 63.71.
For the short term, a close below support about 55 would indicate the bounce is over. Downwards movement may then be expected to end reasonably below 42.37.
New updates to this analysis are in bold.
MAIN ELLIOTT WAVE COUNT
MONTHLY CHART
Click chart to enlarge.
Classic technical analysis favours a bearish wave count for Oil at this time.
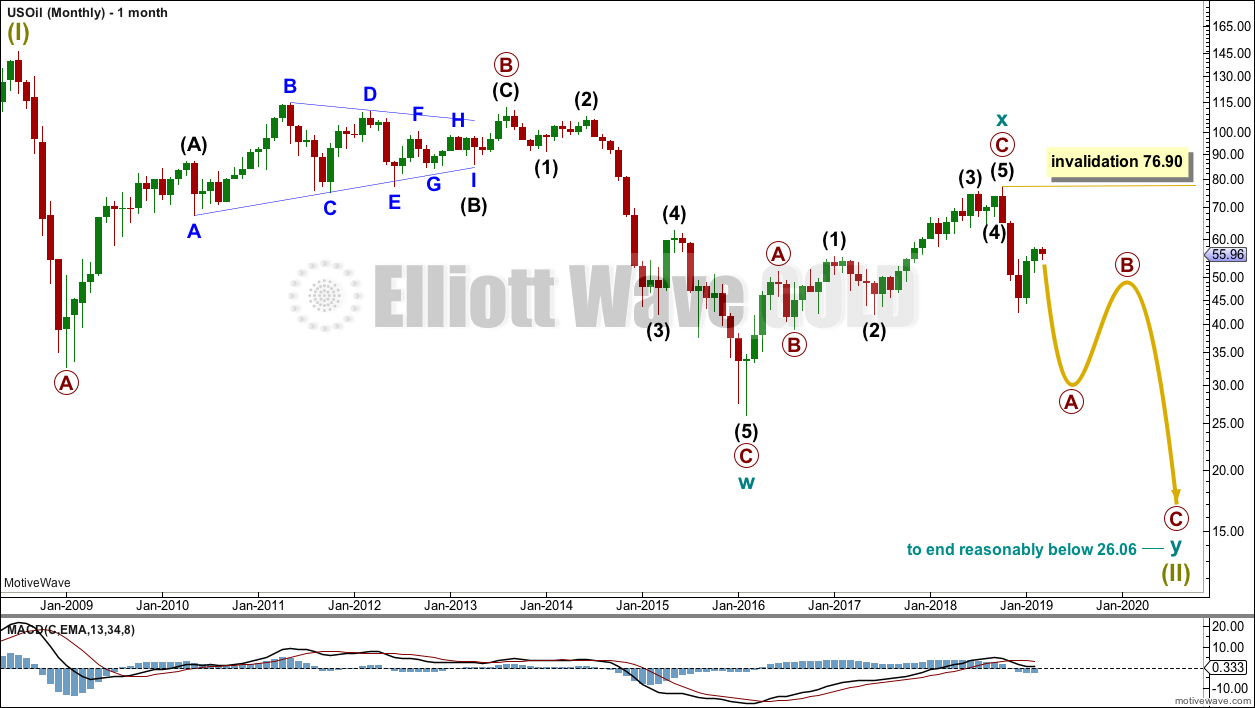
The large fall in price from the high in June 2008 to February 2016 is seen as a complete three wave structure. This large zigzag may have been only the first zigzag in a deeper double zigzag.
Upwards movement from February 2016 to October 2018 will not fit readily as a five wave structure but will fit very well as a three. With a three wave structure upwards, this indicates the bear market may not be over.
The first zigzag down is labelled cycle wave w. The double is joined by a now complete three in the opposite direction, a zigzag labelled cycle wave x.
The purpose of a second zigzag in a double is to deepen the correction when the first zigzag does not move price deep enough. Cycle wave y would be expected to move reasonably below the end of cycle wave w to deepen the correction. Were cycle wave y to reach equality with cycle wave w that takes Oil into negative price territory, which is not possible. Cycle wave y would reach 0.618 the length of cycle wave w at $2.33.
A better target calculation would be using the Fibonacci ratios between primary waves A and C within cycle wave y. This cannot be done until both primary waves A and B are complete.
Within cycle wave y, no second wave correction nor B wave may move beyond its start above 76.90.
WEEKLY CHART
Click chart to enlarge.
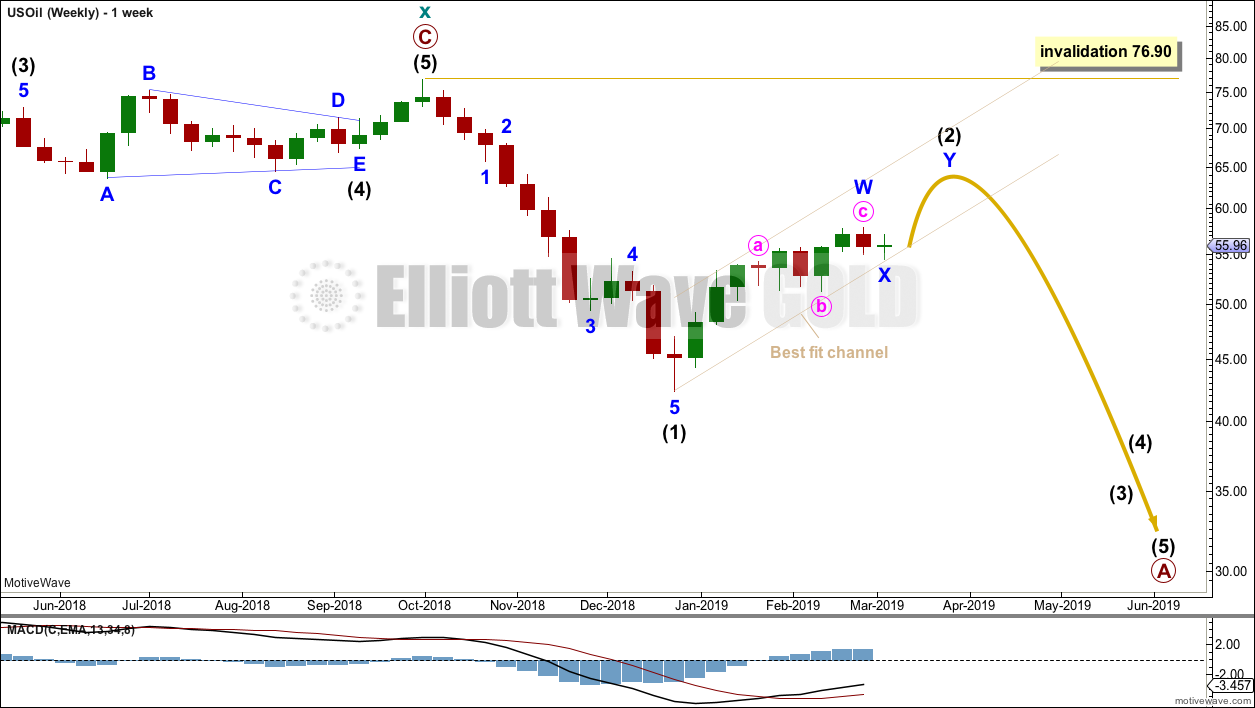
This weekly chart is focussed on the start of cycle wave y.
Cycle wave y is expected to subdivide as a zigzag. A zigzag subdivides 5-3-5. Primary wave A must subdivide as a five wave structure if this wave count is correct.
Within primary wave A, intermediate wave (1) may now be complete.
Intermediate wave (2) is this week relabelled as a possibly incomplete double zigzag. It is again also possible that it may have been over at last week’s high. Two daily charts are published below for both ideas.
Intermediate wave (2) may not move beyond the start of intermediate wave (1) above 76.90.
DAILY CHART
Click chart to enlarge.
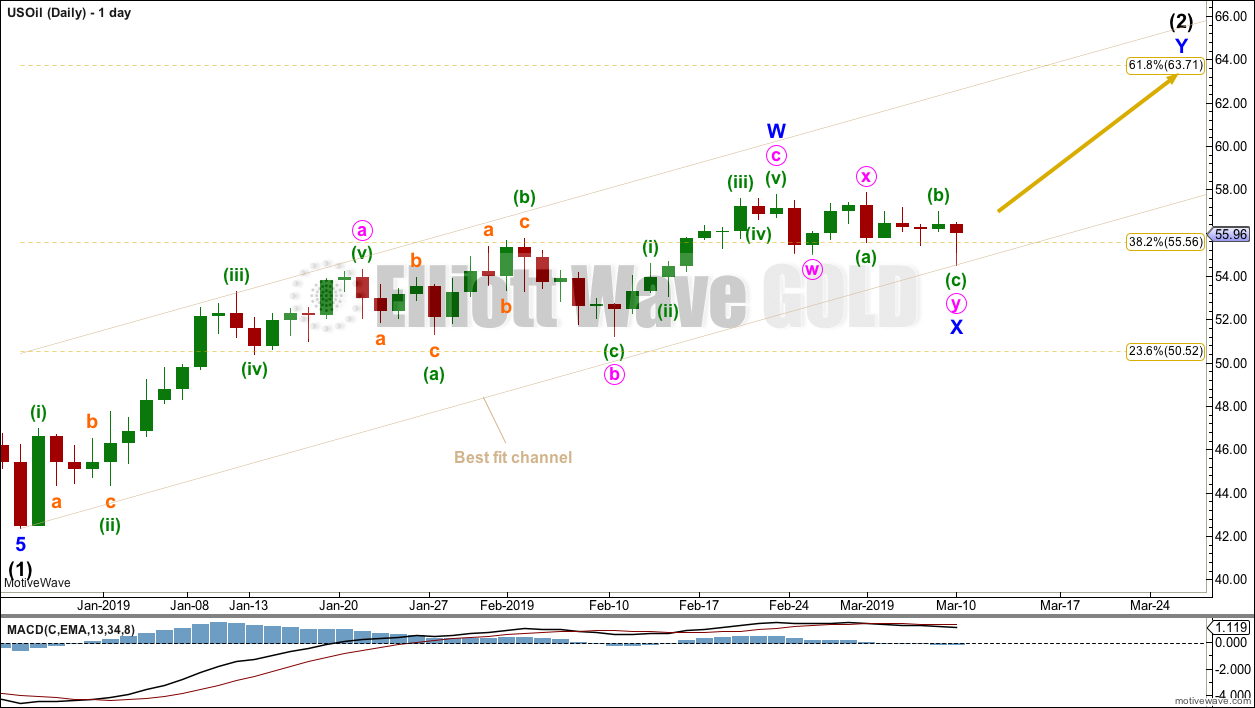
This is the main wave count, only because we should always assume the trend remains the same until proven otherwise.
Intermediate wave (2) may be an incomplete double zigzag. The first zigzag may be complete, labelled minor wave W. The double may be joined by a three in the opposite direction, a double zigzag labelled minor wave X.
The maximum number of corrective structures in a multiple is three. Waves W, Y and Z may only subdivide as single corrective structures (they may not be multiples). But X waves may subdivide as any corrective structure including a multiple. However, X waves almost always subdivide as single zigzags, rarely do they subdivide as multiples. The structure of minor wave X for this wave count must be judged to reduce its probability.
The channel is redrawn this week as a best fit. If this channel is breached by a full candlestick below and not touching it, that may indicate a trend change.
Minor wave Y may end about the 0.618 Fibonacci ratio at 63.71.
Intermediate wave (2) may not move beyond the start of intermediate wave (1) above 76.90.
ALTERNATE DAILY CHART
Click chart to enlarge.
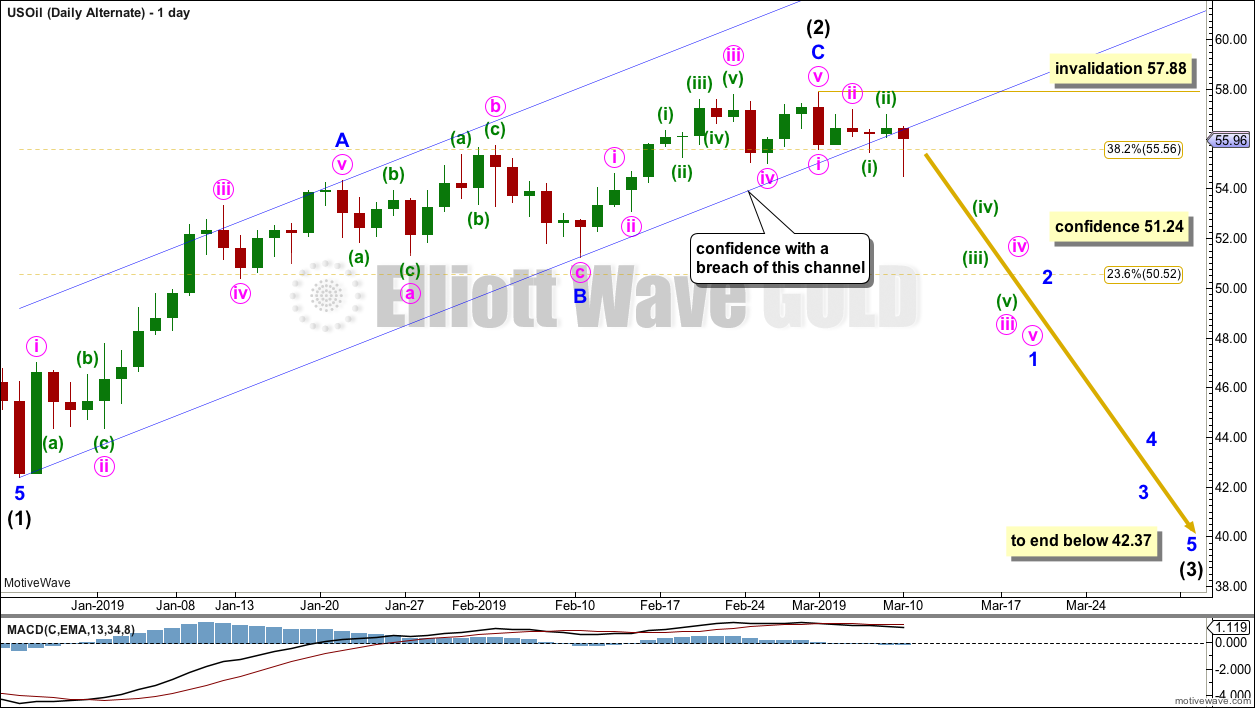
It is possible that intermediate wave (2) may be a complete zigzag, ending close to the 0.382 Fibonacci ratio of intermediate wave (1). Confidence in this wave count may be had with a breach of the blue Elliott channel. At the end of this week, Friday’s candlestick is not fully below the channel; the channel is overshot but not properly breached.
Intermediate wave (3) must move beyond the end of intermediate wave (1). Intermediate wave (3) must move far enough below the end of intermediate wave (1) to allow room for intermediate wave (4) to unfold and remain below intermediate wave (1) price territory.
Within intermediate wave (3), no second wave correction may move beyond the start of its first wave above 57.88.
TECHNICAL ANALYSIS
MONTHLY CHART
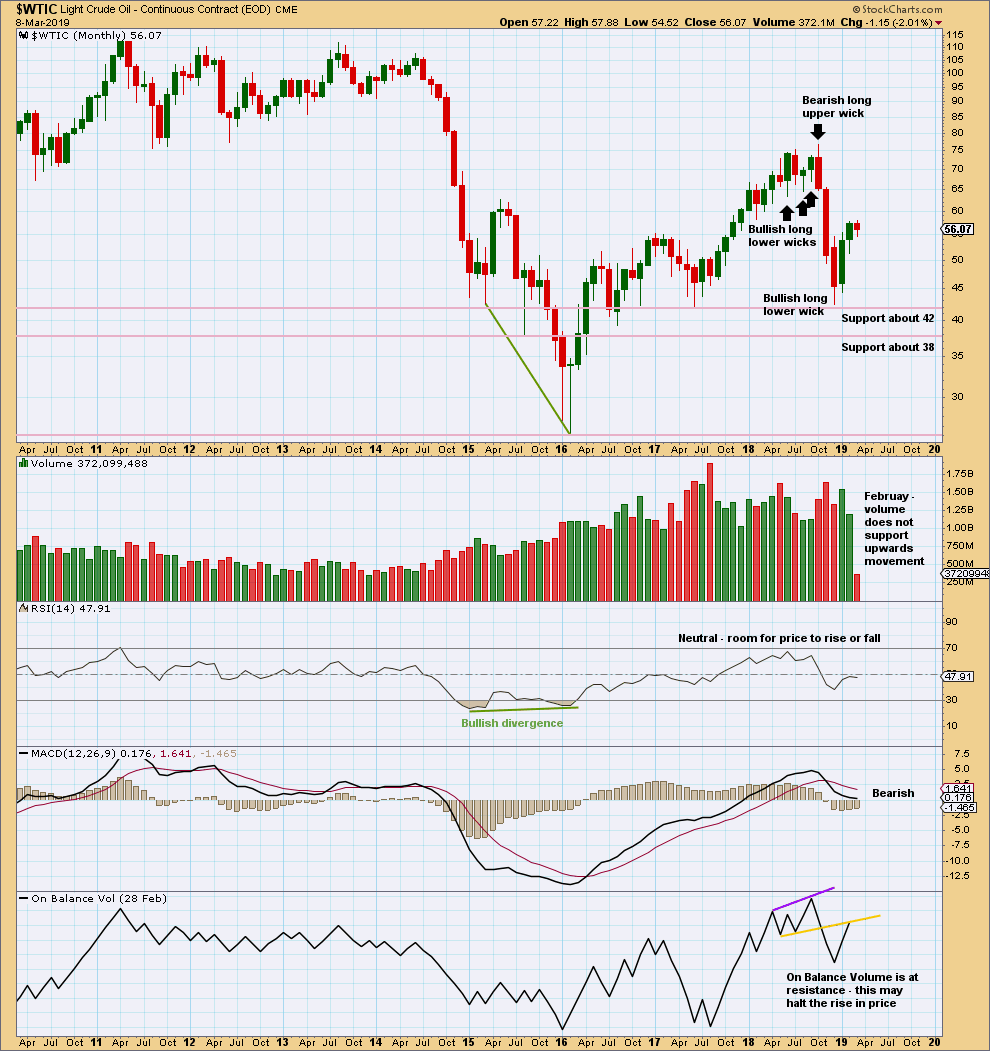
Click chart to enlarge. Chart courtesy of StockCharts.com.
Upwards movement for February lacks support from volume. This bounce may be ending here or very soon.
WEEKLY CHART
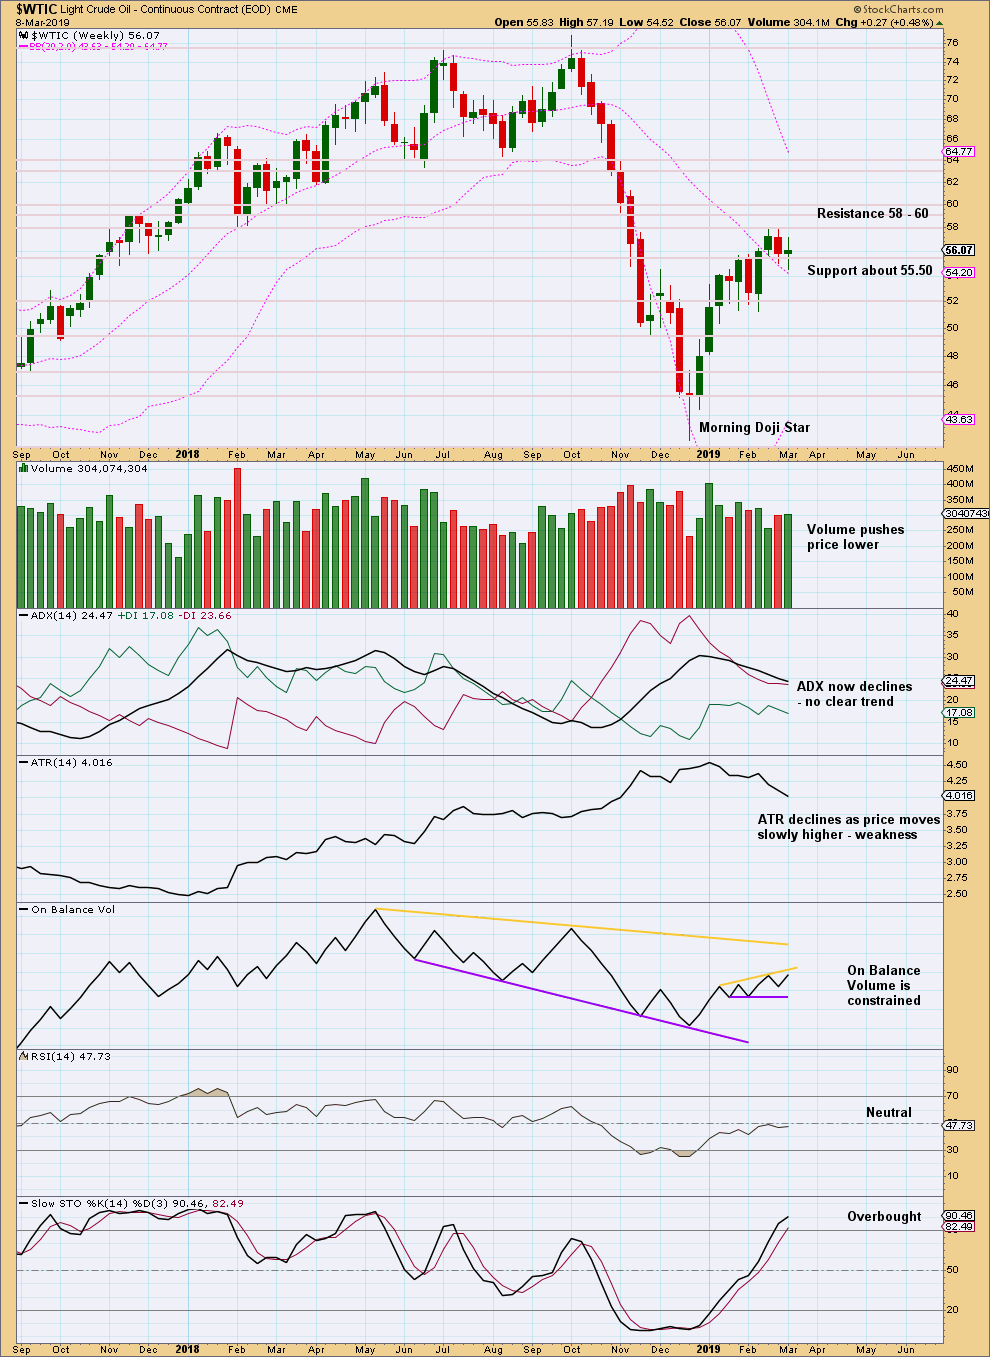
Click chart to enlarge. Chart courtesy of StockCharts.com.
This week price moved lower with a lower low and a lower high. The balance of volume however was upwards and the candlestick closed green. It would be best to look inside the week at daily volume bars for a clearer indication of the short-term volume profile.
The spinning top candlestick this week puts the trend into neutral.
Price has reached resistance and Stochastics is overbought. Look for an end to the bounce here or very soon.
DAILY CHART
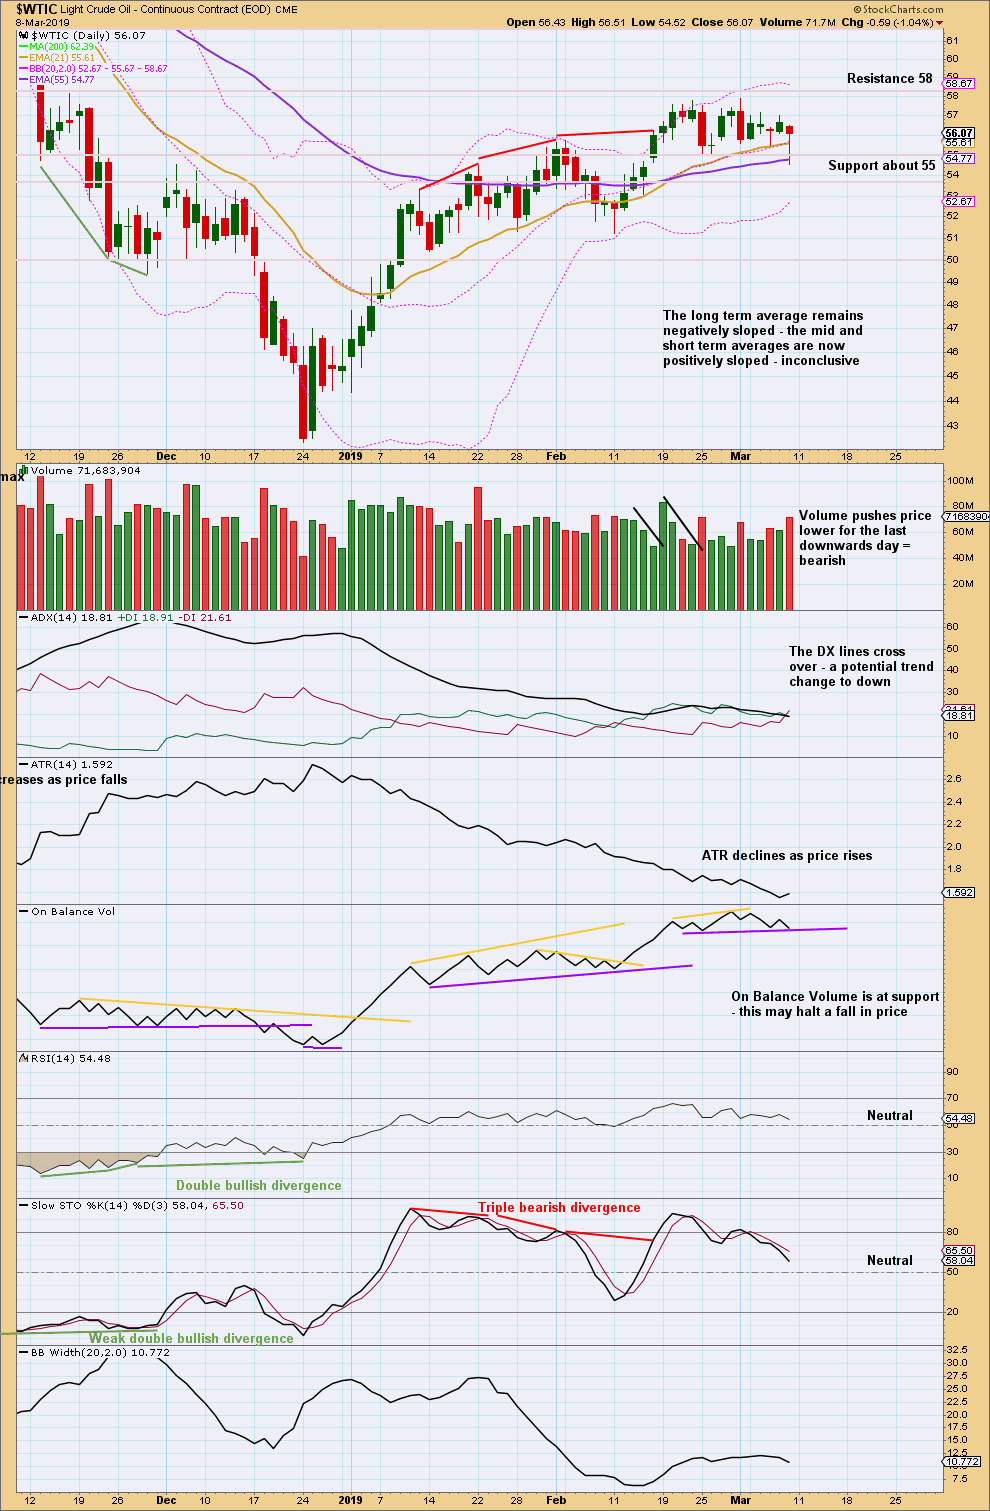
Click chart to enlarge. Chart courtesy of StockCharts.com.
The short-term volume profile remains bearish, but price remains above support. The long lower wick for Friday is bullish.
Price is range bound with resistance about 58 and support about 55. A close above resistance would require support from volume for confidence. If that happens, then look for next resistance about 63.5 – 64.
A close below support about 55 does not require support from volume for confidence. If that happens, then look for next support about 52 in the first instance.
If On Balance Volume breaks out prior to price, then it may indicate the breakout direction for price.
Published @ 09:19 p.m. EST.
—
Careful risk management protects your trading account(s).
Follow my two Golden Rules:
1. Always trade with stops.
2. Risk only 1-5% of equity on any one trade.