
A very small range week moves price mostly sideways. The Elliott wave count remains the same.
Summary: While price remains within the channel on the daily chart, assume the bounce will continue.
If the channel is breached by a full daily candlestick below and not touching the lower edge, assume the bounce is over and a third wave down has begun.
The larger picture still sees Oil in a new downwards trend to end reasonably below 26.06.
New updates to this analysis are in bold.
MAIN ELLIOTT WAVE COUNT
MONTHLY CHART
Click chart to enlarge.
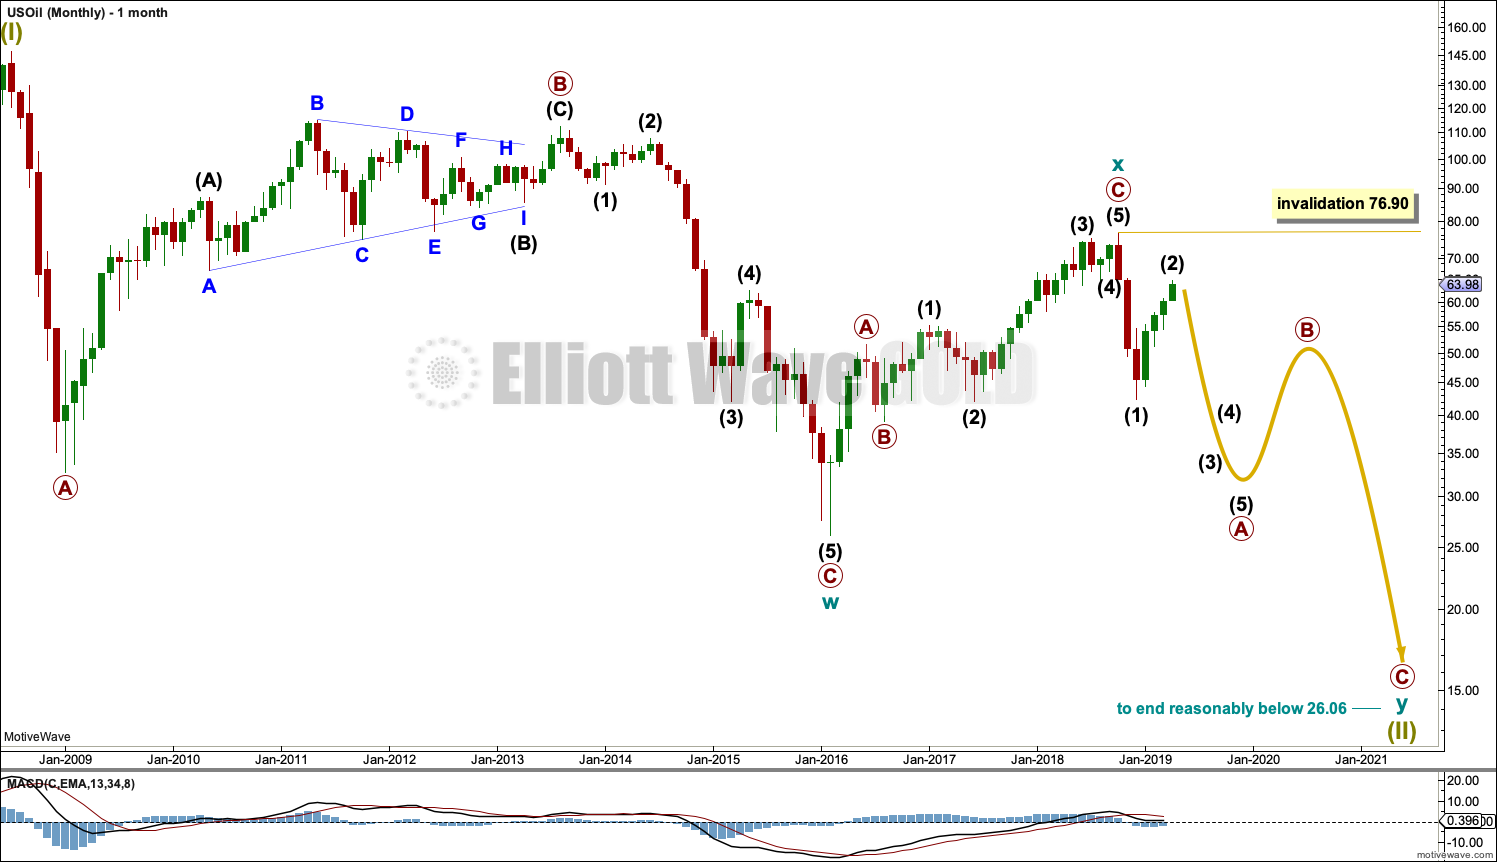
Classic technical analysis favours a bearish wave count for Oil at this time.
The large fall in price from the high in June 2008 to February 2016 is seen as a complete three wave structure. This large zigzag may have been only the first zigzag in a deeper double zigzag.
Upwards movement from February 2016 to October 2018 will not fit readily as a five wave structure but will fit very well as a three. With a three wave structure upwards, this indicates the bear market may not be over.
The first zigzag down is labelled cycle wave w. The double is joined by a now complete three in the opposite direction, a zigzag labelled cycle wave x.
The purpose of a second zigzag in a double is to deepen the correction when the first zigzag does not move price deep enough. Cycle wave y would be expected to move reasonably below the end of cycle wave w to deepen the correction. Were cycle wave y to reach equality with cycle wave w that takes Oil into negative price territory, which is not possible. Cycle wave y would reach 0.618 the length of cycle wave w at $2.33.
A better target calculation would be using the Fibonacci ratios between primary waves A and C within cycle wave y. This cannot be done until both primary waves A and B are complete.
Within cycle wave y, no second wave correction nor B wave may move beyond its start above 76.90.
WEEKLY CHART
Click chart to enlarge.
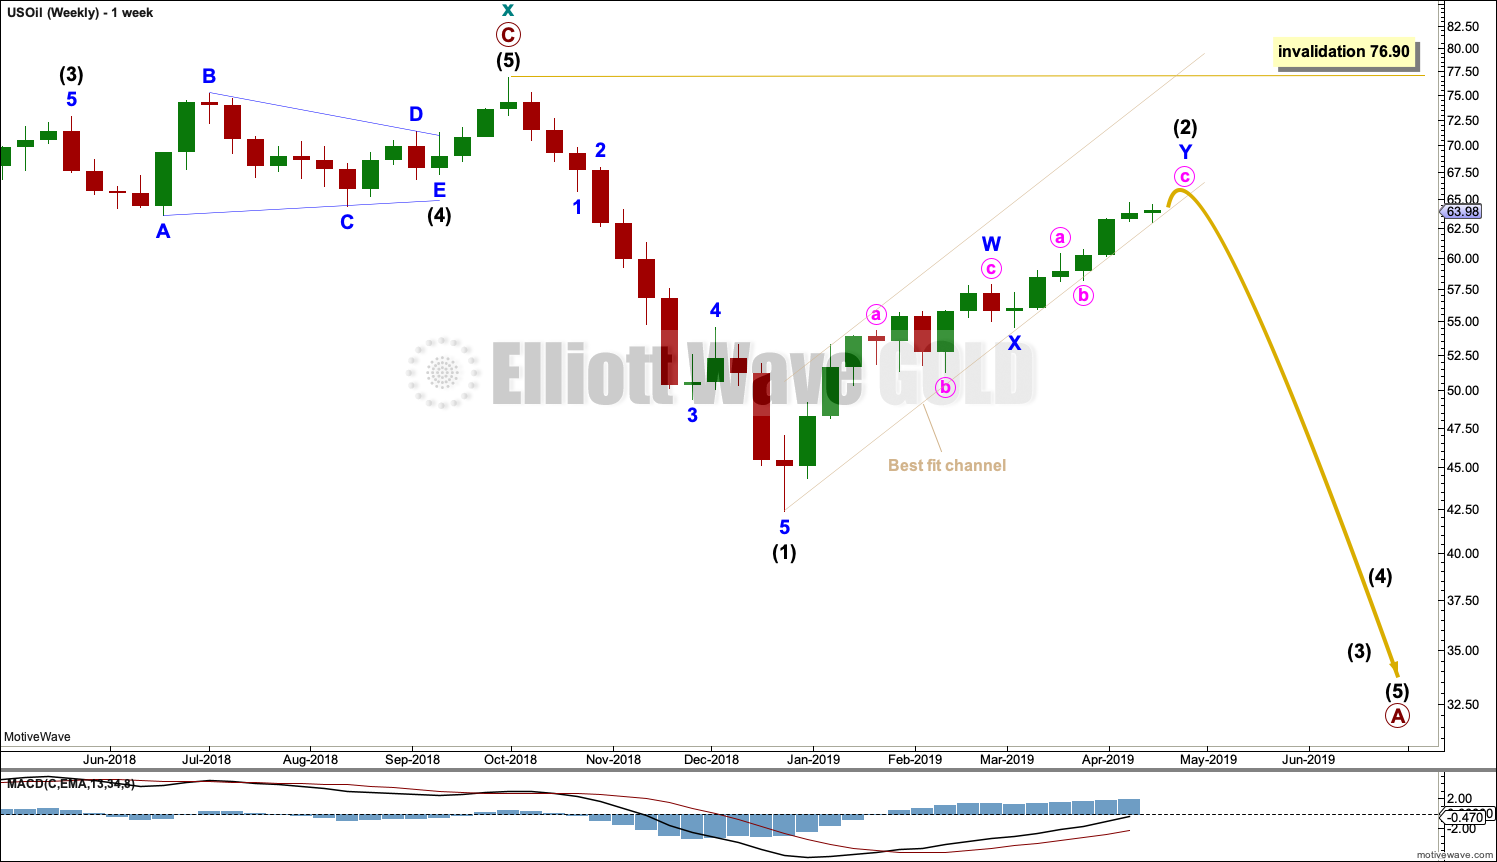
This weekly chart is focussed on the start of cycle wave y.
Cycle wave y is expected to subdivide as a zigzag. A zigzag subdivides 5-3-5. Primary wave A must subdivide as a five wave structure if this wave count is correct.
Within primary wave A, intermediate wave (1) may now be complete.
Intermediate wave (2) is a possibly almost complete double zigzag.
Intermediate wave (2) may not move beyond the start of intermediate wave (1) above 76.90.
DAILY CHART
Click chart to enlarge.
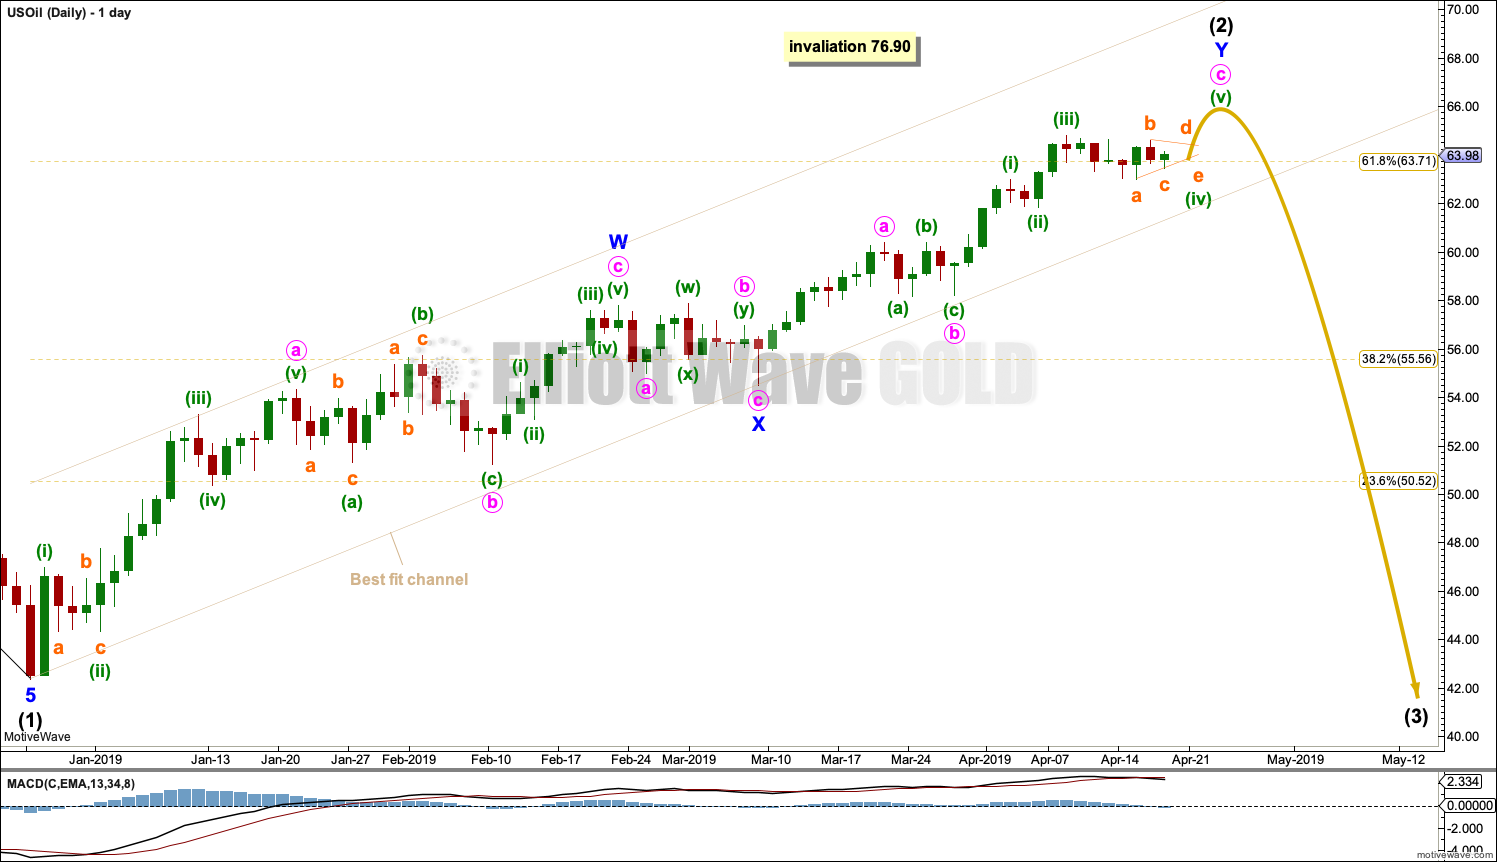
Always assume the trend remains the same until proven otherwise.
Intermediate wave (2) may be an incomplete double zigzag. The first zigzag may be complete, labelled minor wave W. The double may be joined by a three in the opposite direction, a zigzag labelled minor wave X.
Minor wave Y still may be incomplete. Within minor wave Y, minute wave c may be an incomplete impulse with minuette wave (iv) an almost complete triangle. A short fifth wave up for minuette wave (v) may be required to complete the structure.
The channel is drawn as a best fit. If this channel is breached by a full candlestick below and not touching it, then that at this stage would indicate a trend change.
Intermediate wave (2) may not move beyond the start of intermediate wave (1) above 76.90.
TECHNICAL ANALYSIS
MONTHLY CHART
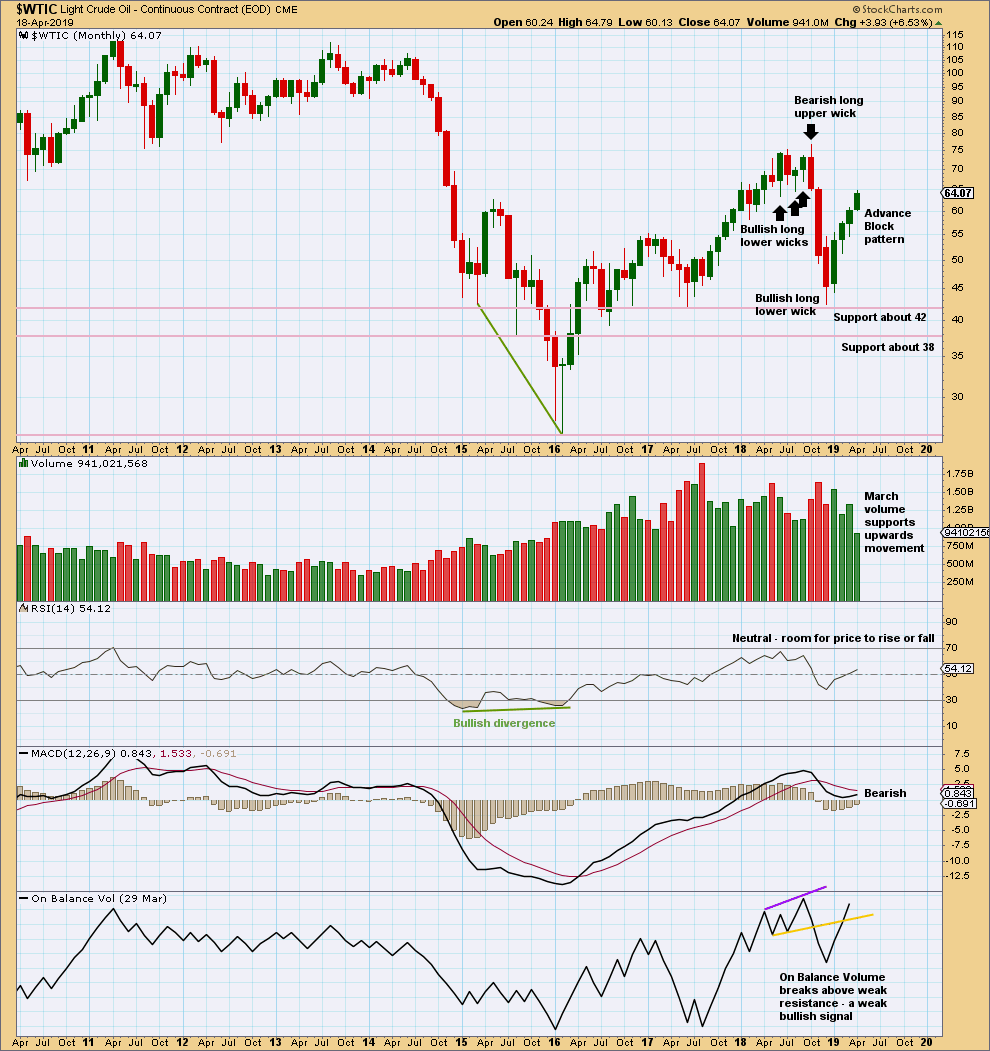
Click chart to enlarge. Chart courtesy of StockCharts.com.
The Advance Block pattern signals developing weakness. But the long lower wicks of the last two complete monthly candlesticks and some support from volume for March suggest more upwards movement for April.
This upwards bounce may be tiring.
WEEKLY CHART
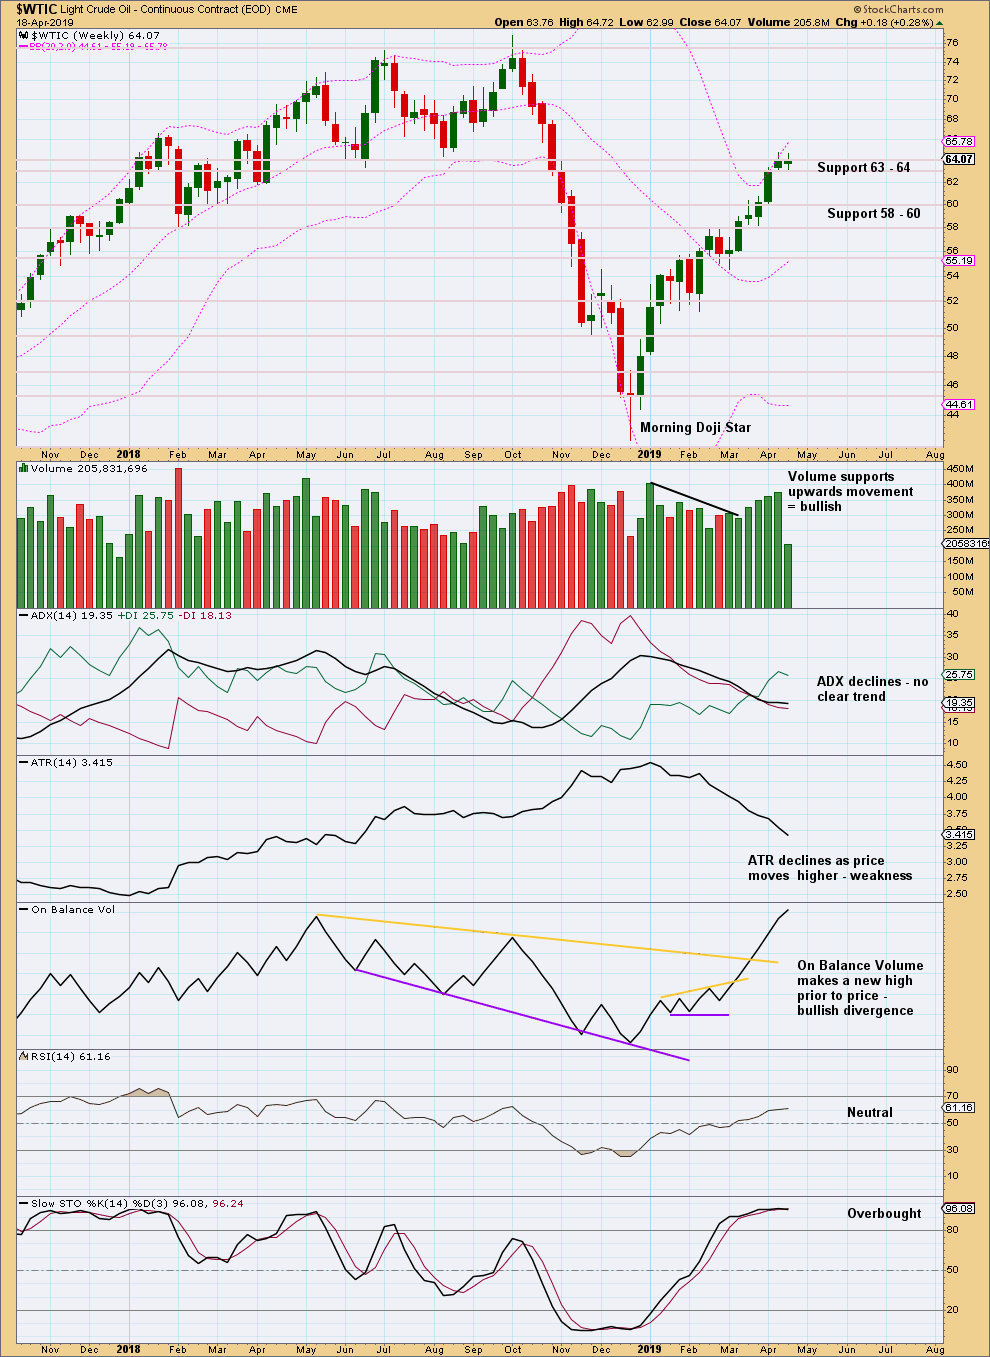
Click chart to enlarge. Chart courtesy of StockCharts.com.
This week was a short week, so no conclusion may be drawn from lighter volume.
This week my view of an Advance Block pattern on the weekly chart is changed. The first two candlesticks in an Advance Block pattern should be have about equal length real bodies and in this example the second candlestick is longer.
DAILY CHART
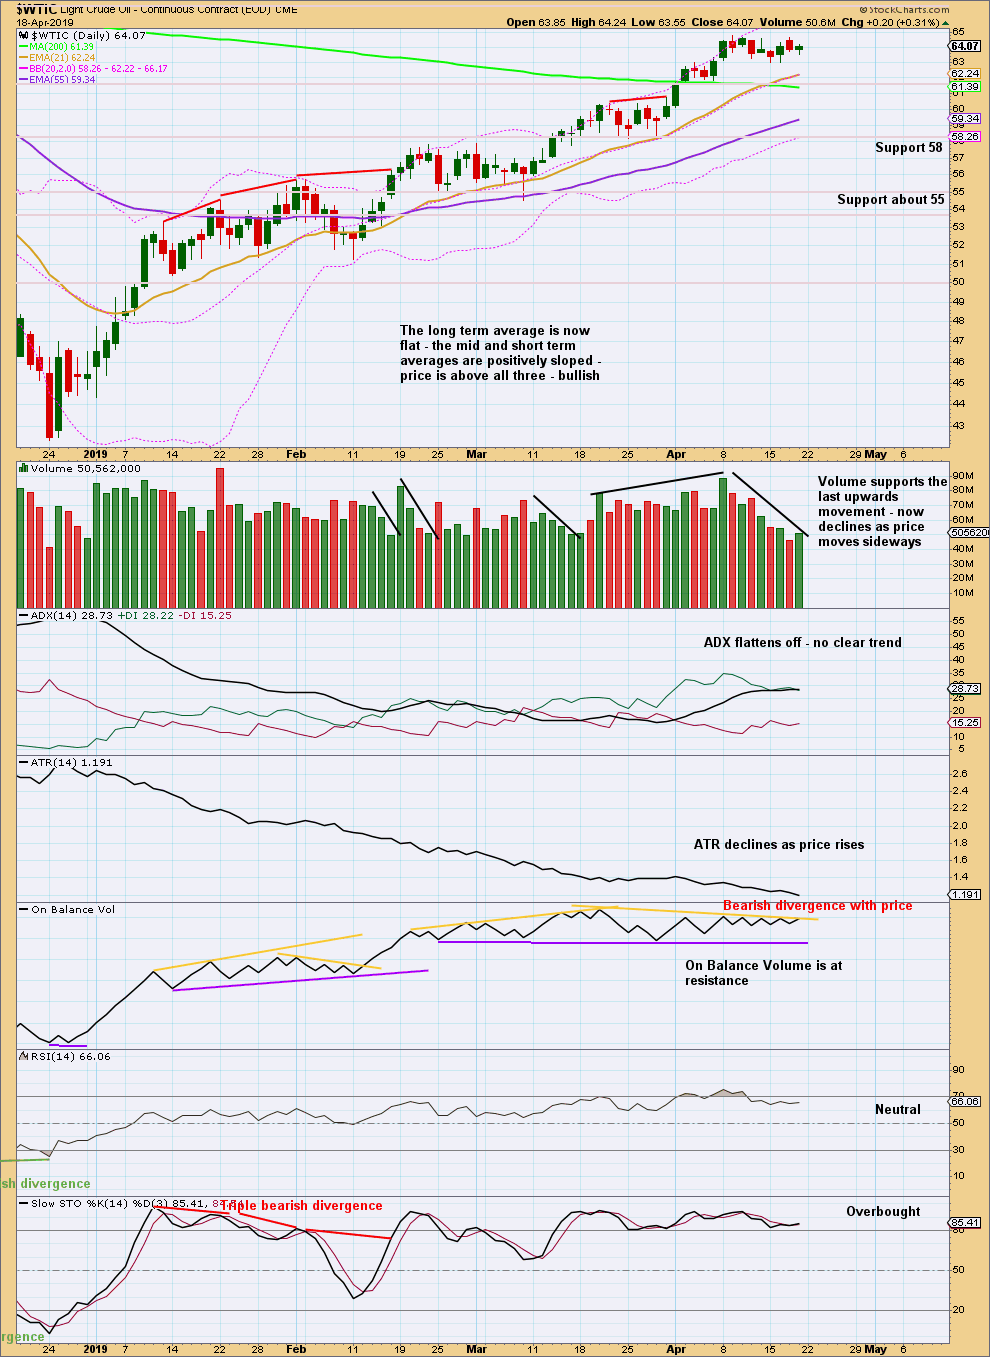
Click chart to enlarge. Chart courtesy of StockCharts.com.
Since the 24th of December 2018 there has been a series of higher highs and higher lows, the basic definition of an upwards trend. Assume this will continue until proven it has ended. A lower low below the low of the 28th of March 2019 would provide evidence the bounce is over.
Stochastics may continue to remain overbought and may exhibit further divergence before the bounce ends.
While On Balance Volume has made a new high at the weekly chart level, for the shorter term at the daily chart level there is now some evidence of weakness as it does not confirm last highs.
Overall, this chart remains mostly bullish, but the upwards bounce does look somewhat weak.
Published @ 08:49 p.m. EST.
—
Careful risk management protects your trading account(s).
Follow my two Golden Rules:
1. Always trade with stops.
2. Risk only 1-5% of equity on any one trade.