
Downwards movement has unfolded for the week as expected.
Summary: The next wave down may have begun. The final target is now calculated at 10.72.
Further confidence that a high is in place may be had if price makes a new low below 58.20.
MAIN ELLIOTT WAVE COUNT
MONTHLY CHART
Click chart to enlarge.
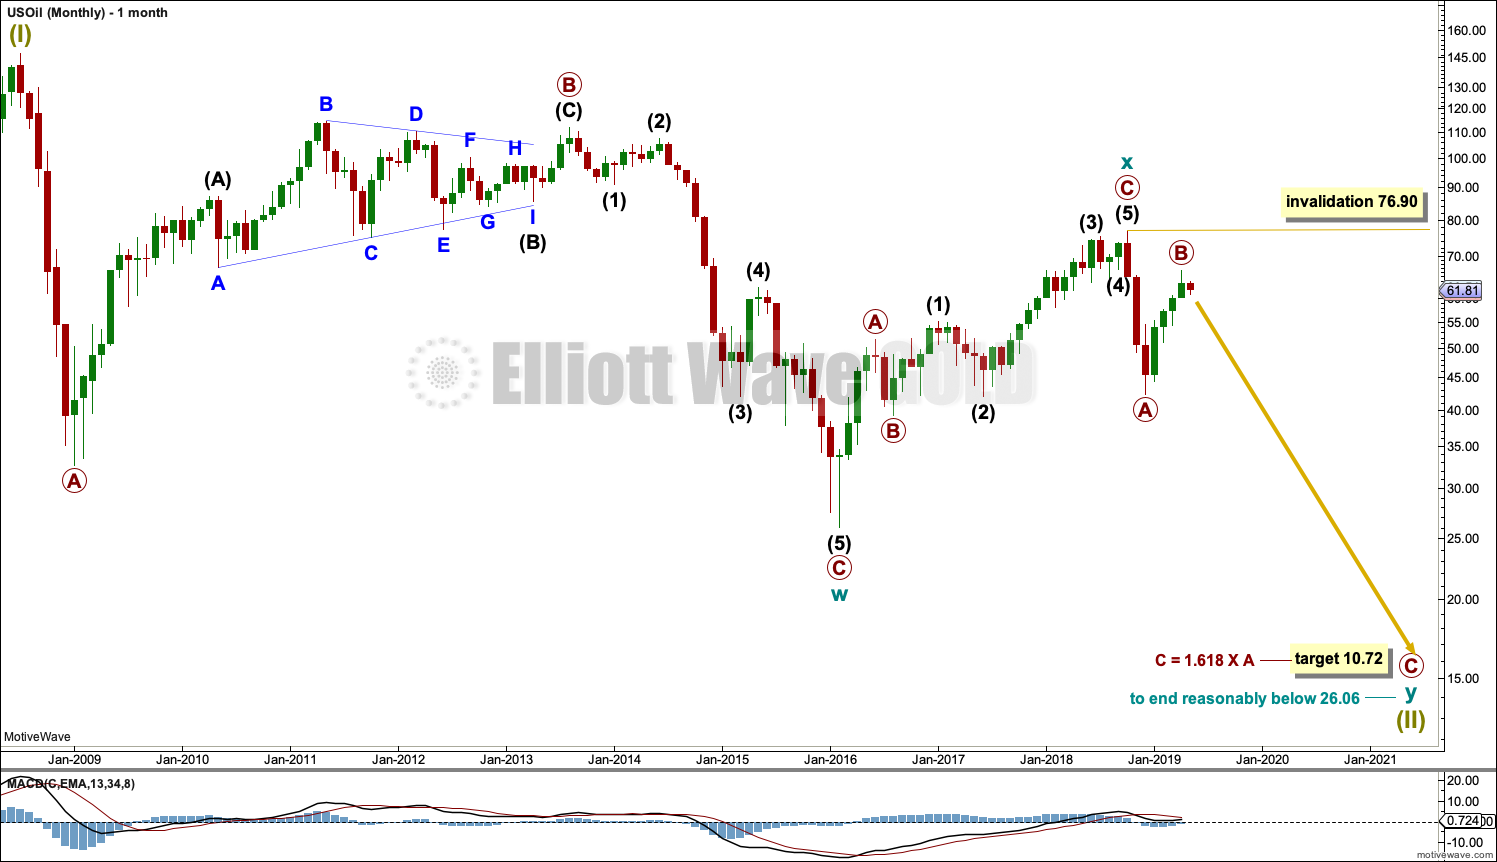
Classic technical analysis favours a bearish wave count for Oil at this time.
The large fall in price from the high in June 2008 to February 2016 is seen as a complete three wave structure. This large zigzag may have been only the first zigzag in a deeper double zigzag.
Upwards movement from February 2016 to October 2018 will not fit readily as a five wave structure but will fit very well as a three. With a three wave structure upwards, this indicates the bear market may not be over.
The first zigzag down is labelled cycle wave w. The double is joined by a now complete three in the opposite direction, a zigzag labelled cycle wave x.
The purpose of a second zigzag in a double is to deepen the correction when the first zigzag does not move price deep enough. Cycle wave y would be expected to move reasonably below the end of cycle wave w to deepen the correction. Were cycle wave y to reach equality with cycle wave w that takes Oil into negative price territory, which is not possible. Cycle wave y would reach 0.618 the length of cycle wave w at $2.33.
A better target calculation would be using the Fibonacci ratios between primary waves A and C within cycle wave y.
Within the zigzag of cycle wave y, primary wave A may have been over at the last low and now primary wave B may be complete. Were primary wave C to reach only equality in length with primary wave A, then cycle wave y would not move beyond the end of cycle wave w. The next Fibonacci ratio in the sequence is used to calculate a target for primary wave C.
If it continues higher, then primary wave B may not move beyond the start of primary wave A above 76.90.
WEEKLY CHART
Click chart to enlarge.
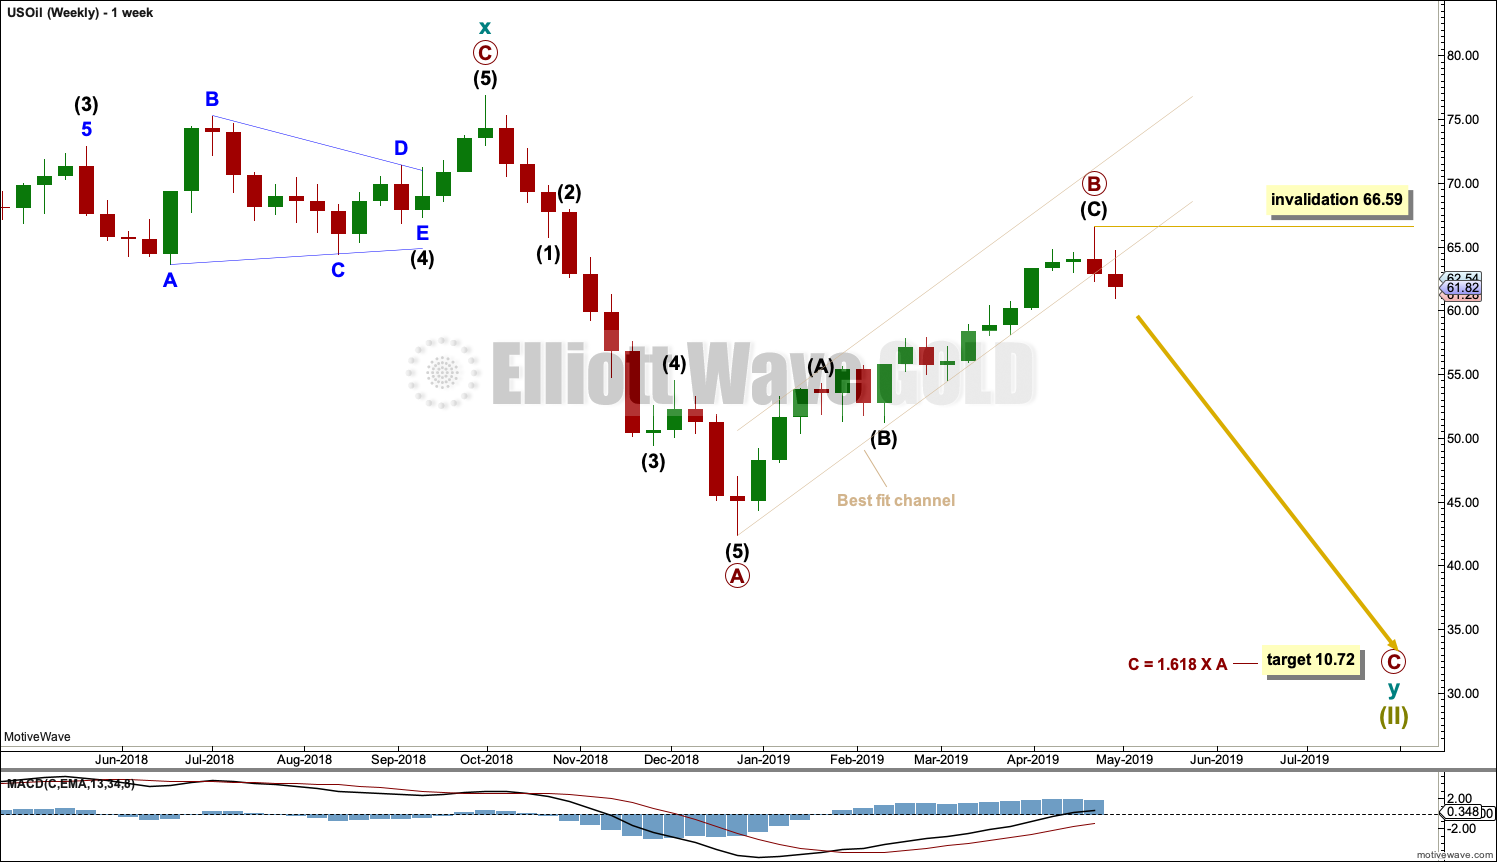
This weekly chart is focussed on the start of cycle wave y.
Cycle wave y is expected to subdivide as a zigzag. A zigzag subdivides 5-3-5. Primary wave A must subdivide as a five wave structure if this wave count is correct.
Primary wave A may be a complete five wave impulse at the last low.
Primary wave B may now be a complete single zigzag at the last high.
Primary wave C may have just begun. Primary wave C must subdivide as a five wave structure.
Within primary wave C, no second wave correction may move beyond its start above 66.59.
DAILY CHART
Click chart to enlarge.
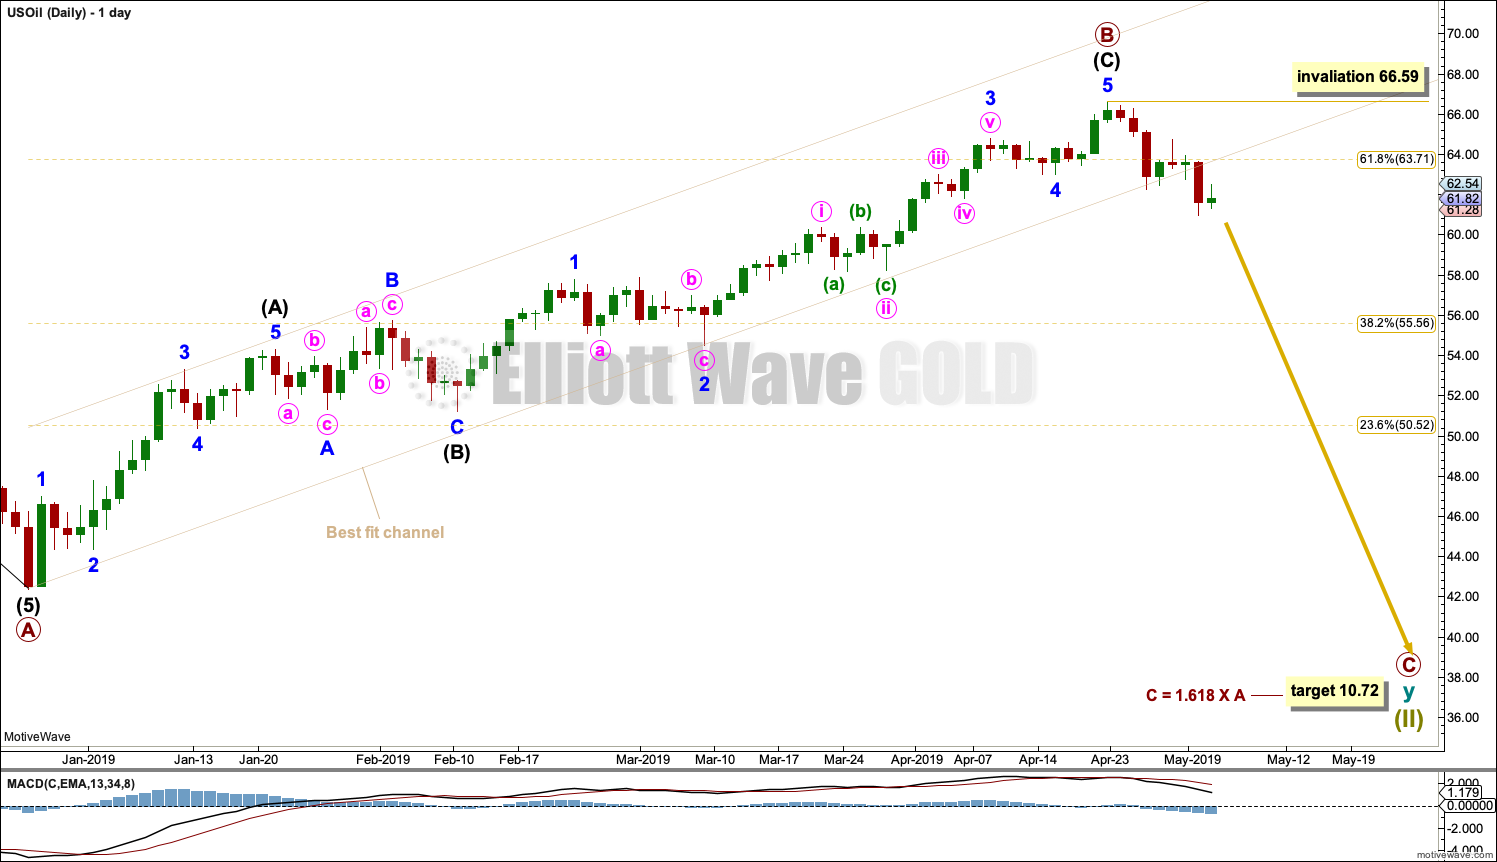
Primary wave B is now labelled as a complete single zigzag.
Note that monthly and weekly charts are on a semi-log scale, but this daily chart is on an arithmetic scale. This makes a slight difference to trend channels. Use this channel on a daily chart on an arithmetic scale.
The channel is drawn conservatively to contain all of the bounce of primary wave B. There is now one full daily candlestick below and not touching the lower edge of this channel, although it is a green daily candlestick. However, the strong red candlestick for Thursday’s session looks like a strong breach of the channel. This adds confidence now to the labelling of primary wave B as complete.
Within primary wave C, no second wave correction may move beyond its start above 66.59.
Primary wave C may last at least a year, and possibly longer. It may be extended in time; the subdivisions of intermediate waves (2) and (4) may show up at the weekly time frame.
TECHNICAL ANALYSIS
MONTHLY CHART
Click chart to enlarge. Chart courtesy of StockCharts.com.
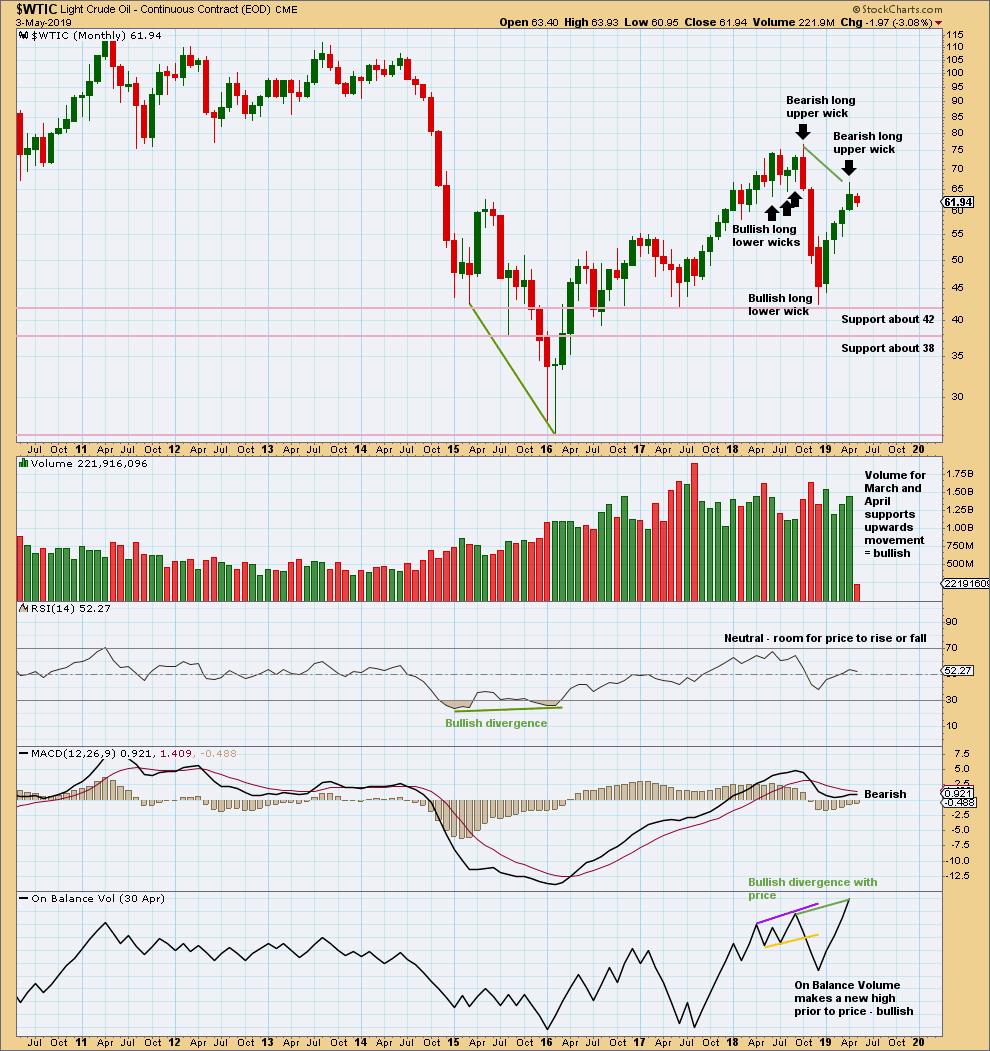
Volume and On Balance Volume are bullish. This suggests the bounce may not be over, and this does not support the Elliott wave count.
The long upper wick on April’s monthly candlestick is bearish. This bearish signal is weaker than the bullish volume profile.
WEEKLY CHART
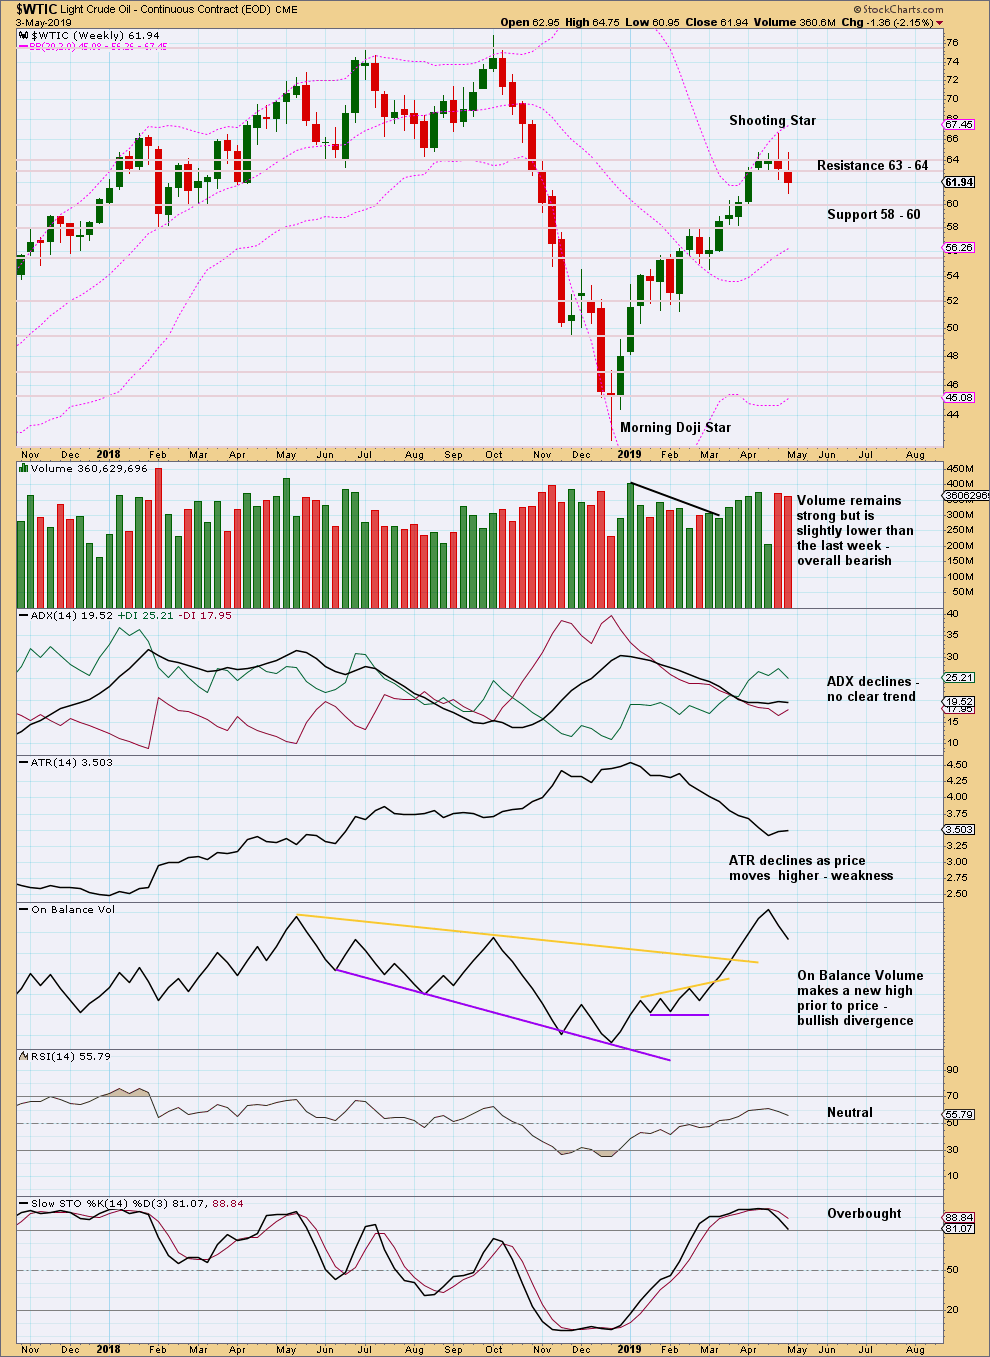
Click chart to enlarge. Chart courtesy of StockCharts.com.
A Shooting Star candlestick pattern is a bearish reversal pattern when it comes at the end of an upwards movement.
DAILY CHART
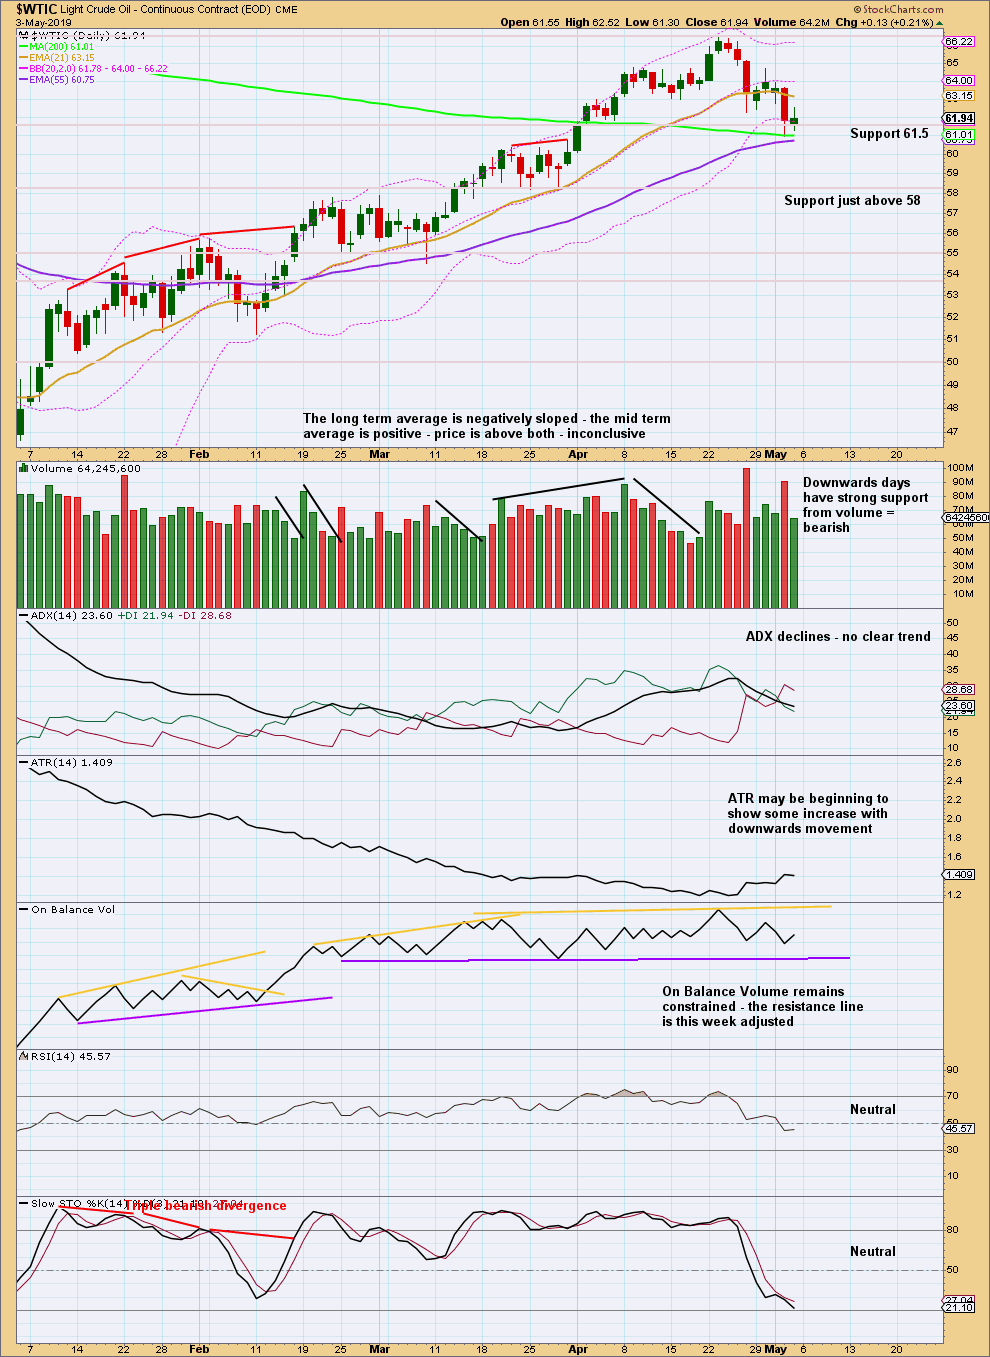
Click chart to enlarge. Chart courtesy of StockCharts.com.
Since the 24th of December 2018 there has been a series of higher highs and higher lows, the basic definition of an upwards trend. Assume this will continue until proven it has ended. A lower low below the low of the 28th of March 2019 at 58.20 would provide evidence the bounce is over.
The short-term volume profile remains fairly strongly bearish and supports the Elliott wave count.
Published @ 09:59 p.m. EST.
—
Careful risk management protects your trading account(s).
Follow my two Golden Rules:
1. Always trade with stops.
2. Risk only 1-5% of equity on any one trade.
—
New updates to this analysis are in bold.