
Downwards movement was expected this week for US Oil, which is exactly what has happened.
Summary: A bounce may begin next week to about 61.33. The next wave down may begin thereafter, which may show a further increase in momentum.
The final target is now calculated at 10.72.
Further confidence that a high is in place may be had if price makes a new low below 58.20.
MAIN ELLIOTT WAVE COUNT
MONTHLY CHART
Click chart to enlarge.
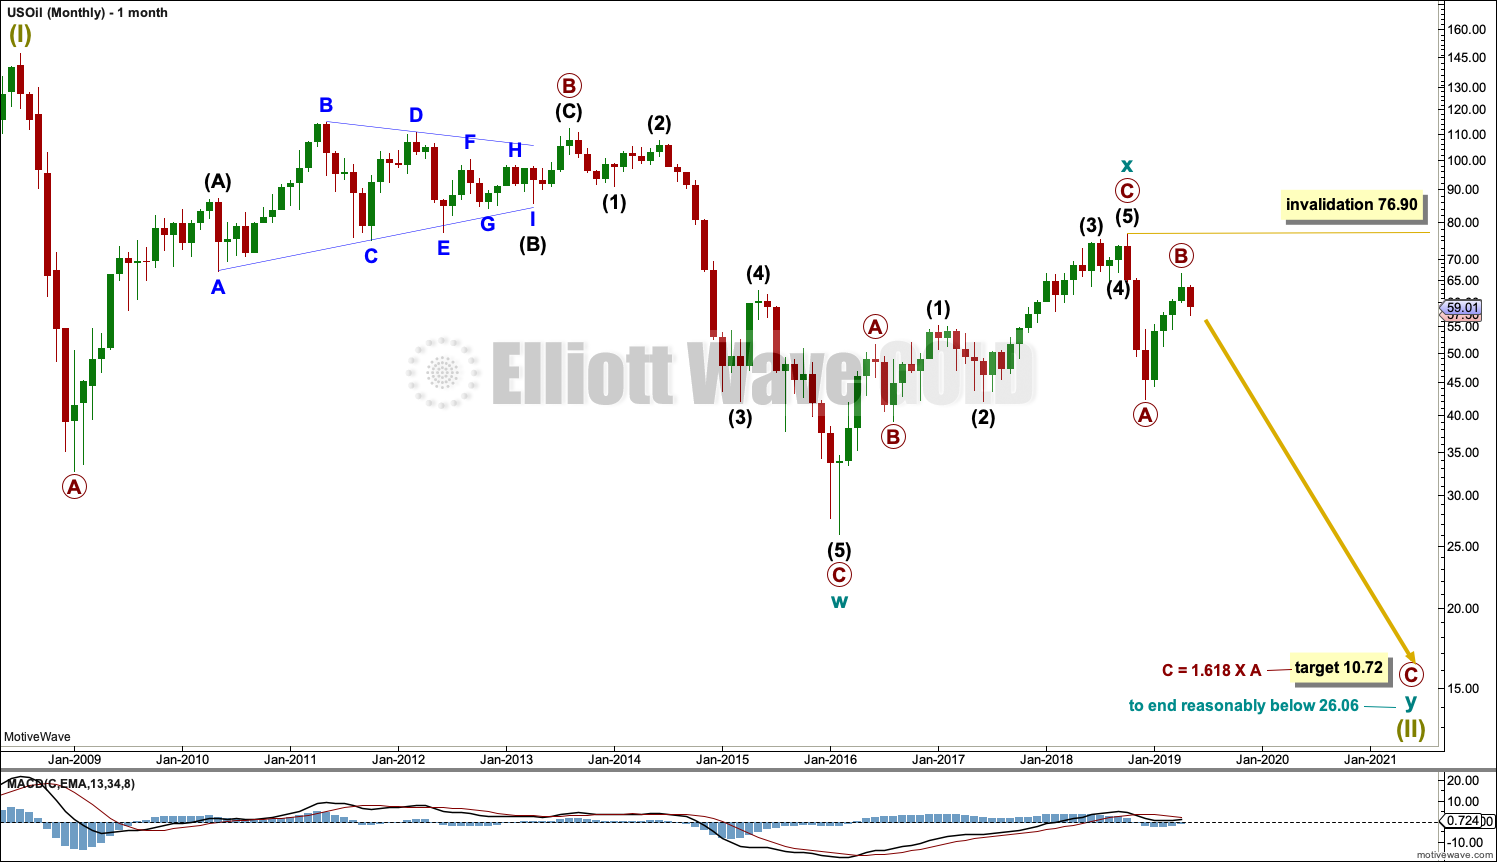
The basic Elliott wave structure is five steps forward and three steps back. This Elliott wave count expects that US Oil is still within a three steps back pattern, which began in July 2008. The Elliott wave count expects that the bear market for US Oil continues.
This Elliott wave corrective structure is a double zigzag, which is a fairly common structure. The correction is labelled Super Cycle wave (II).
The first zigzag in the double is complete and labelled cycle wave y. The double is joined by a three in the opposite direction labelled cycle wave x, which subdivides as a zigzag. The second zigzag in the double may now have begun, labelled cycle wave w.
The purpose of a second zigzag in a double zigzag is to deepen the correction when the first zigzag does not move price deep enough. To achieve this purpose cycle wave y may be expected to move reasonably below the end of cycle wave w at 26.06. The target calculated would see this expectation met.
Cycle wave y is expected to subdivide as a zigzag, which subdivides 5-3-5.
Cycle wave w lasted 7.6 years and cycle wave x lasted 2.7 years. Cycle wave y may be expected to last possibly about a Fibonacci 5 or 8 years.
If it continues higher, then primary wave B may not move beyond the start of primary wave A above 76.90.
WEEKLY CHART
Click chart to enlarge.
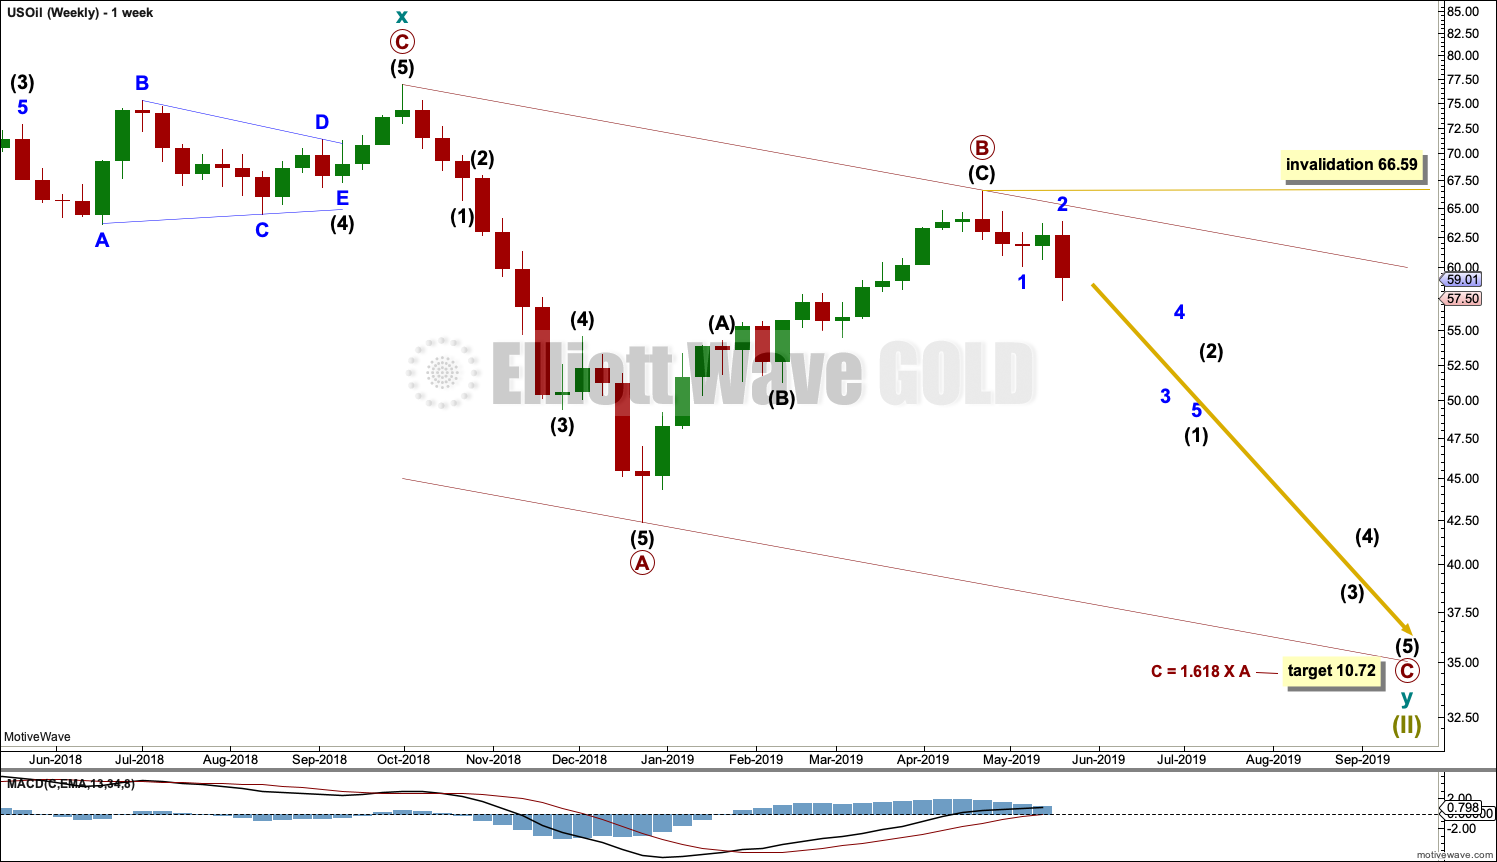
This weekly chart is focussed on the start of cycle wave y.
Cycle wave y is expected to subdivide as a zigzag. A zigzag subdivides 5-3-5. Primary wave A must subdivide as a five wave structure if this wave count is correct.
Primary wave A may be a complete five wave impulse at the last low.
Primary wave B may now be a complete single zigzag at the last high.
Primary wave C may have just begun. Primary wave C must subdivide as a five wave structure.
Primary wave A lasted 12 weeks, just one short of a Fibonacci 13.
Primary wave C may be longer in time as well as price. If cycle wave y lasts a Fibonacci 5 years, then primary wave C within it may take as long as 233 weeks.
Within primary wave C, no second wave correction may move beyond its start above 66.59.
Draw a channel about the zigzag of primary wave y using Elliott’s technique for a correction. Draw the first trend line from the start of primary wave A to the end of primary wave B, then place a parallel copy on the end of primary wave A. The upper edge of this channel may show where bounces along the way down find resistance. The lower edge of the channel may provide support.
DAILY CHART
Click chart to enlarge.
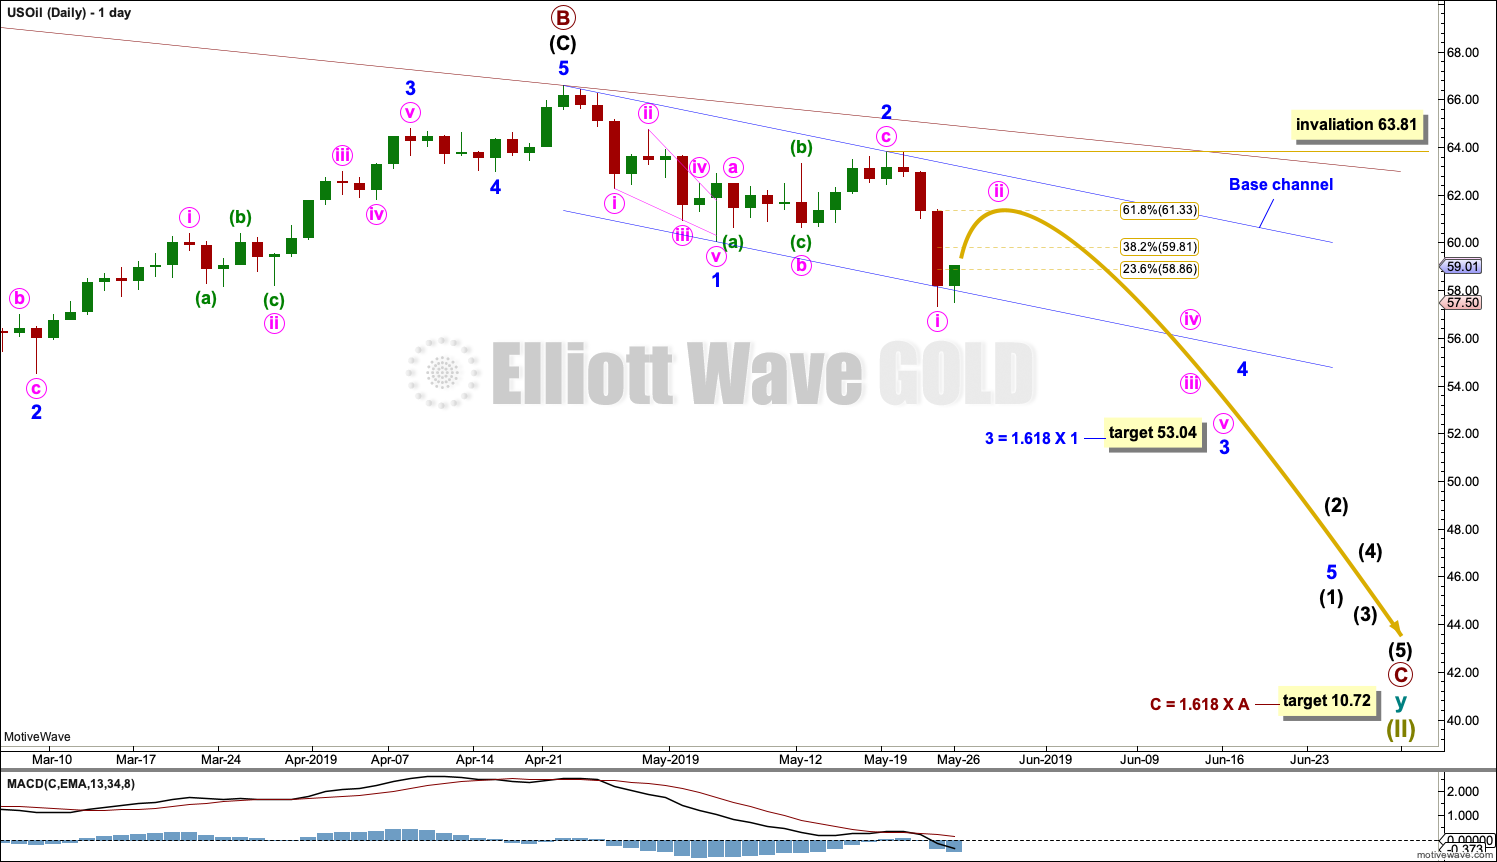
Note that monthly and weekly charts are on a semi-log scale, but this daily chart is on an arithmetic scale. This makes a slight difference to trend channels.
Primary wave C must subdivide as a five wave structure, most likely an impulse. Within the impulse, minor waves 1 and now 2 may be complete. A target is calculated for minor wave 3 that expects a common Fibonacci ratio to minor wave 1. If the target is wrong, it may not be low enough.
Within minor wave 3, minute wave i may be complete and minute wave ii may move higher early next week. The 0.382 and 0.618 Fibonacci ratios are reasonable targets for minute wave ii, with the 0.618 Fibonacci ratio favoured.
A base channel is drawn about minor waves 1 and 3. A base channel in a bear market usually shows where bounces for lower degree second wave corrections find resistance.
When minute wave ii is complete, then a third wave down at two degrees may exhibit an increase in downwards momentum. This may happen as early as the end of next week, or possibly the week after.
TECHNICAL ANALYSIS
MONTHLY CHART
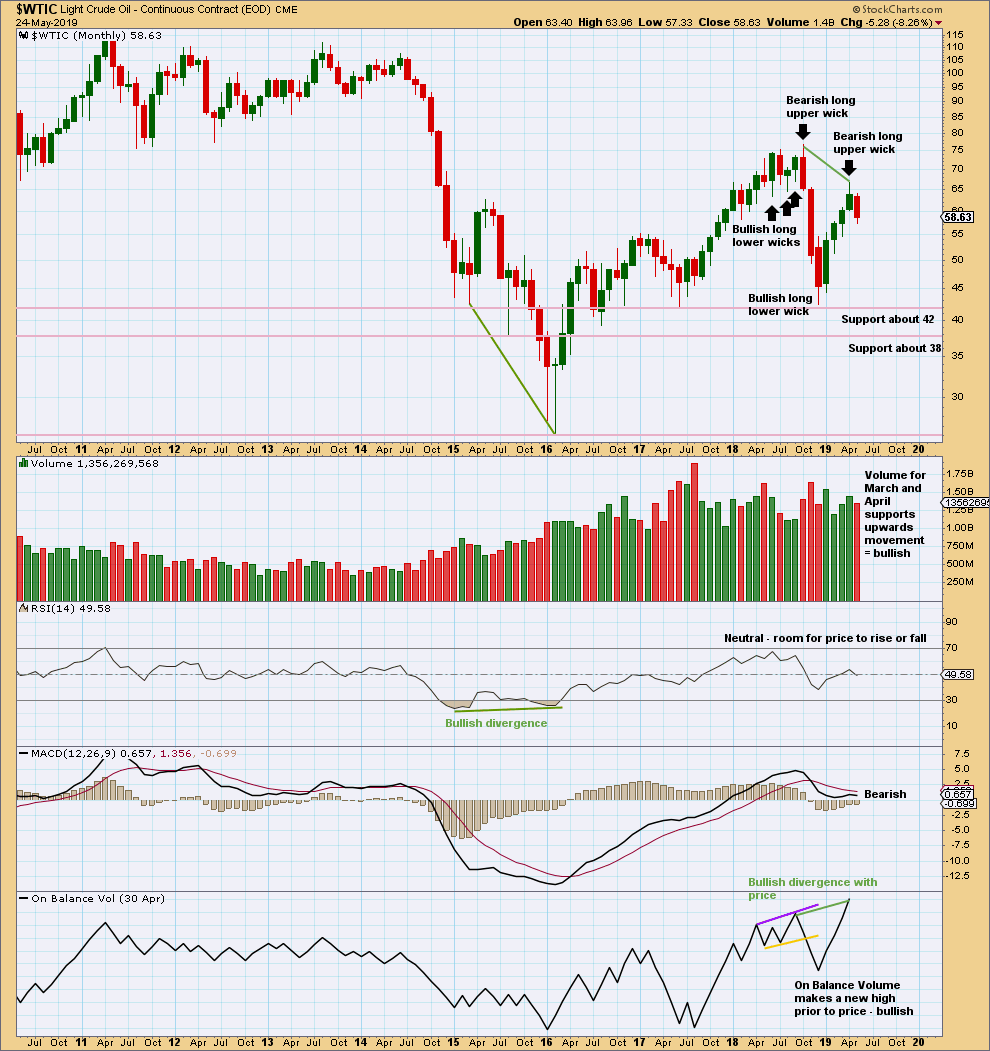
Click chart to enlarge. Chart courtesy of StockCharts.com.
Volume and On Balance Volume are bullish. This suggests the bounce may not be over, and this does not support the Elliott wave count.
The long upper wick on April’s monthly candlestick is bearish. This bearish signal is weaker than the bullish volume profile.
WEEKLY CHART
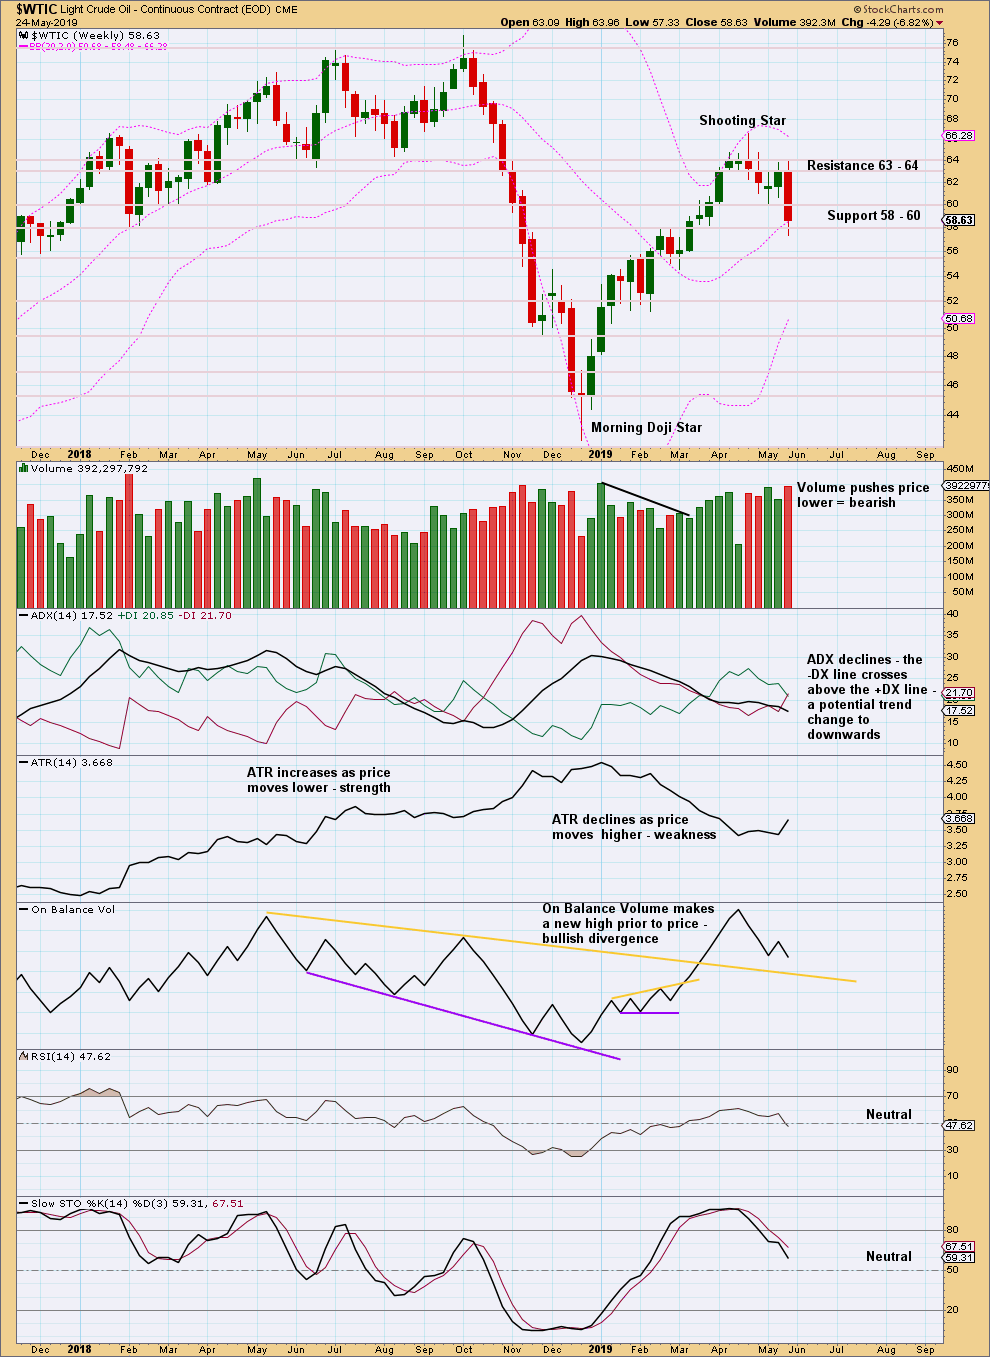
Click chart to enlarge. Chart courtesy of StockCharts.com.
A Shooting Star candlestick pattern is a bearish reversal pattern when it comes at the end of an upwards movement.
Strong support for downwards movement this week from volume is very bearish.
DAILY CHART
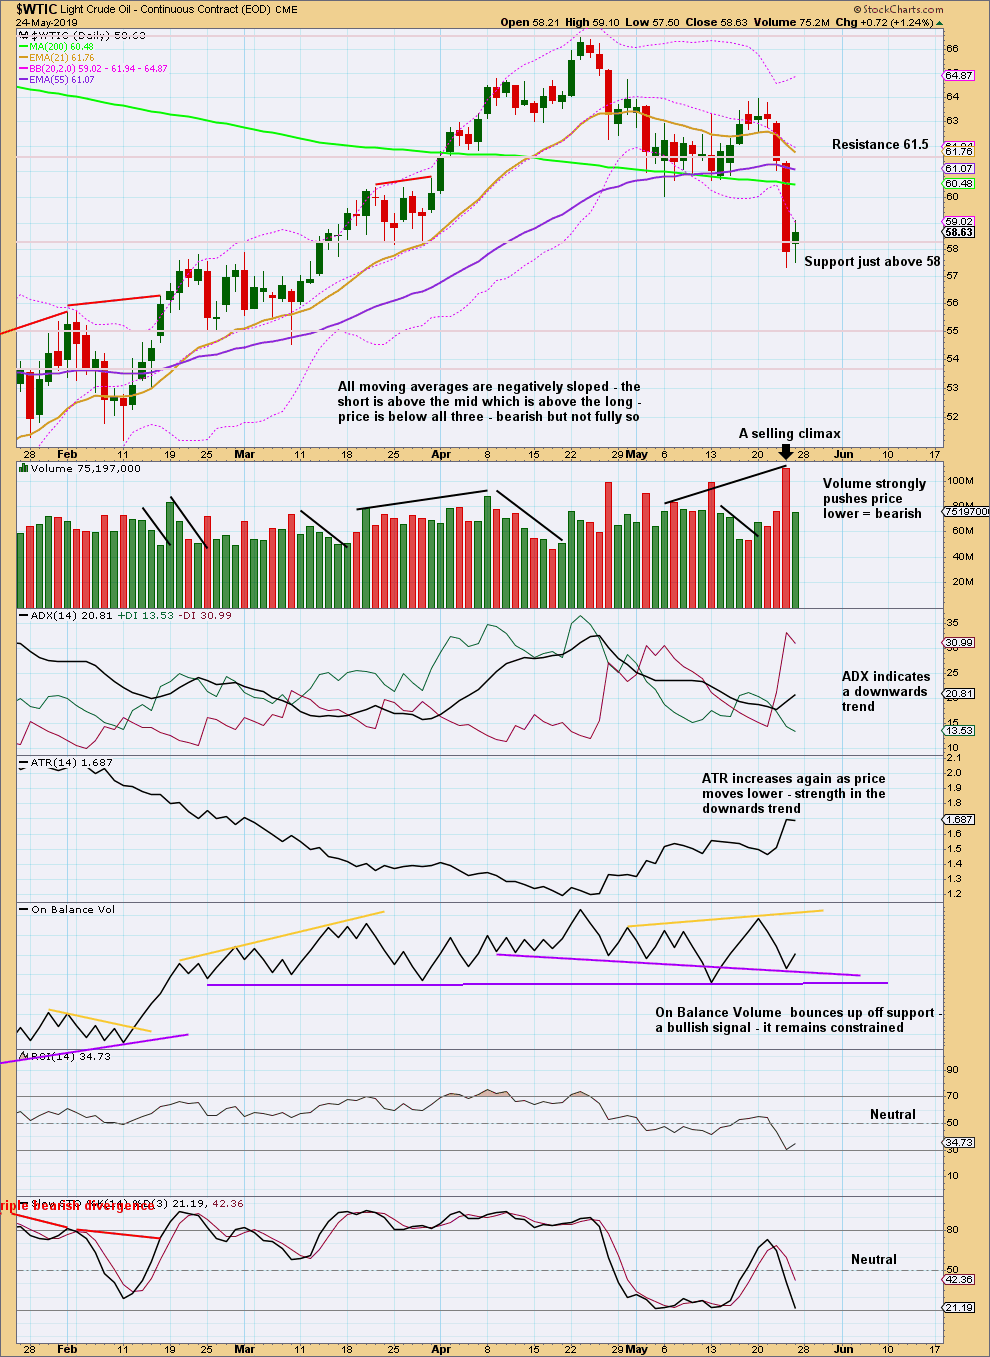
Click chart to enlarge. Chart courtesy of StockCharts.com.
Since the 24th of December 2018 there has been a series of higher highs and higher lows, the basic definition of an upwards trend. A lower low below the low of the 28th of March 2019 at 58.20 was made this week on the 23rd of May at 57.33, indicating the bounce may be over.
After the selling climax on the 23rd of May, now look for a bounce or consolidation to relive extreme conditions. A selling climax does not mean that a major low should be in place though; it may be followed by some consolidation before a downwards trend resumes.
Published @ 09:31 a.m. EST on May 25, 2019.
—
Careful risk management protects your trading account(s).
Follow my two Golden Rules:
1. Always trade with stops.
2. Risk only 1-5% of equity on any one trade.
—
New updates to this analysis are in bold.