
A sideways consolidation was expected for the week. Price has moved higher than expected, but it remains below the Elliott wave invalidation point.
Summary: This bounce may either be over here or may continue higher towards 60.53. Final resistance may be found at the upper edge of the maroon Elliott channel.
The larger trend most likely still remains down. The final target is calculated at 10.72.
MAIN ELLIOTT WAVE COUNT
MONTHLY CHART
Click chart to enlarge.
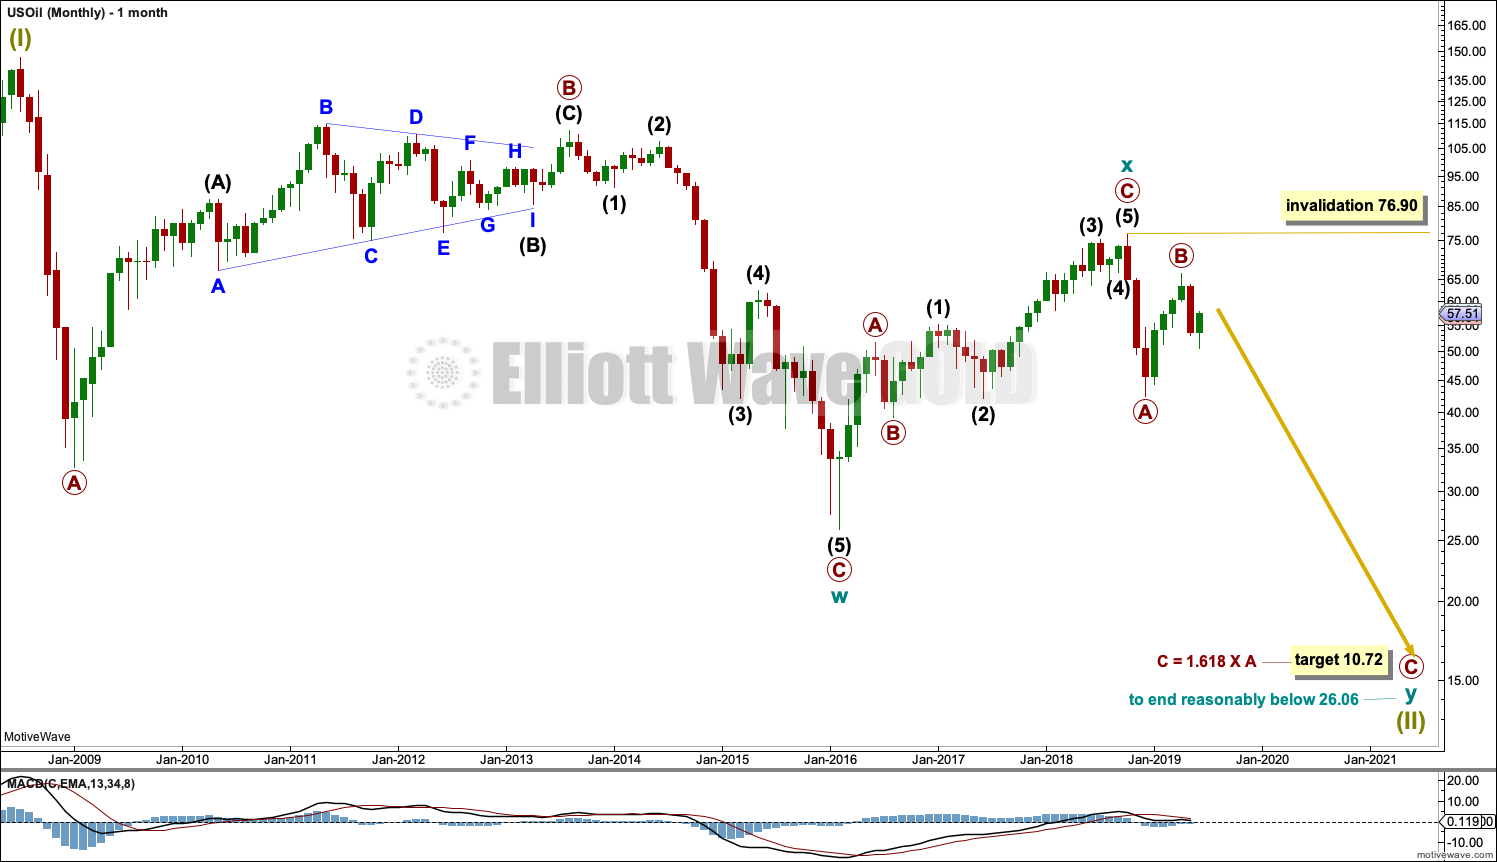
The basic Elliott wave structure is five steps forward and three steps back. This Elliott wave count expects that US Oil is still within a three steps back pattern, which began in July 2008. The Elliott wave count expects that the bear market for US Oil continues.
This Elliott wave corrective structure is a double zigzag, which is a fairly common structure. The correction is labelled Super Cycle wave (II).
The first zigzag in the double is complete and labelled cycle wave y. The double is joined by a three in the opposite direction labelled cycle wave x, which subdivides as a zigzag. The second zigzag in the double may now have begun, labelled cycle wave w.
The purpose of a second zigzag in a double zigzag is to deepen the correction when the first zigzag does not move price deep enough. To achieve this purpose cycle wave y may be expected to move reasonably below the end of cycle wave w at 26.06. The target calculated would see this expectation met.
Cycle wave y is expected to subdivide as a zigzag, which subdivides 5-3-5.
Cycle wave w lasted 7.6 years and cycle wave x lasted 2.7 years. Cycle wave y may be expected to last possibly about a Fibonacci 5 or 8 years.
If it continues higher, then primary wave B may not move beyond the start of primary wave A above 76.90.
The upwards wave labelled cycle wave x would have to be counted as a five wave impulse to see US Oil as within a new bull market. Such a wave count could be made but would look forced. This wave subdivides best as a three.
WEEKLY CHART
Click chart to enlarge.
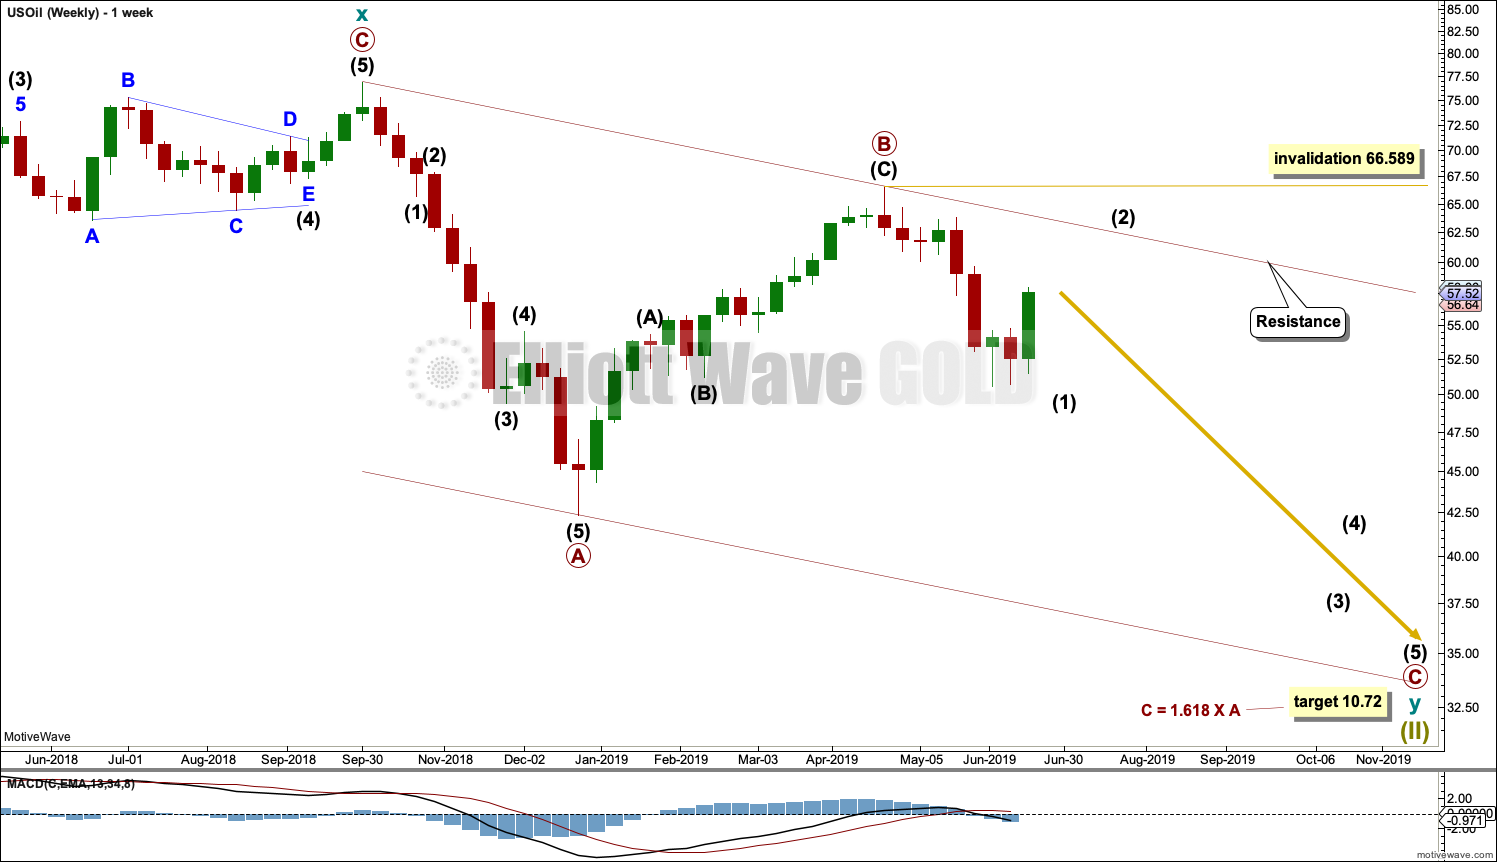
This weekly chart is focussed on the start of cycle wave y.
Cycle wave y is expected to subdivide as a zigzag. A zigzag subdivides 5-3-5. Primary wave A must subdivide as a five wave structure if this wave count is correct.
Primary wave A may be a complete five wave impulse at the last low.
Primary wave B may now be a complete single zigzag at the last high.
Primary wave C may have just begun. Primary wave C must subdivide as a five wave structure.
Primary wave A lasted 12 weeks, just one short of a Fibonacci 13.
Primary wave C may be longer in time as well as price. If cycle wave y lasts a Fibonacci 5 years, then primary wave C within it may take as long as a Fibonacci 233 weeks.
Intermediate wave (1) within primary wave C may be subdividing as an impulse, and the alternate daily chart below considers the possibility that it may be over. Intermediate wave (2) may not move beyond the start of intermediate wave (1) above 66.59.
Draw a channel about the zigzag of primary wave y using Elliott’s technique for a correction. Draw the first trend line from the start of primary wave A to the end of primary wave B, then place a parallel copy on the end of primary wave A. The upper edge of this channel may show where bounces along the way down find resistance. The lower edge of the channel may provide support.
Intermediate wave (2) may be a multi-week bounce that may find resistance at the upper edge of the Elliott channel.
DAILY CHART
Click chart to enlarge.
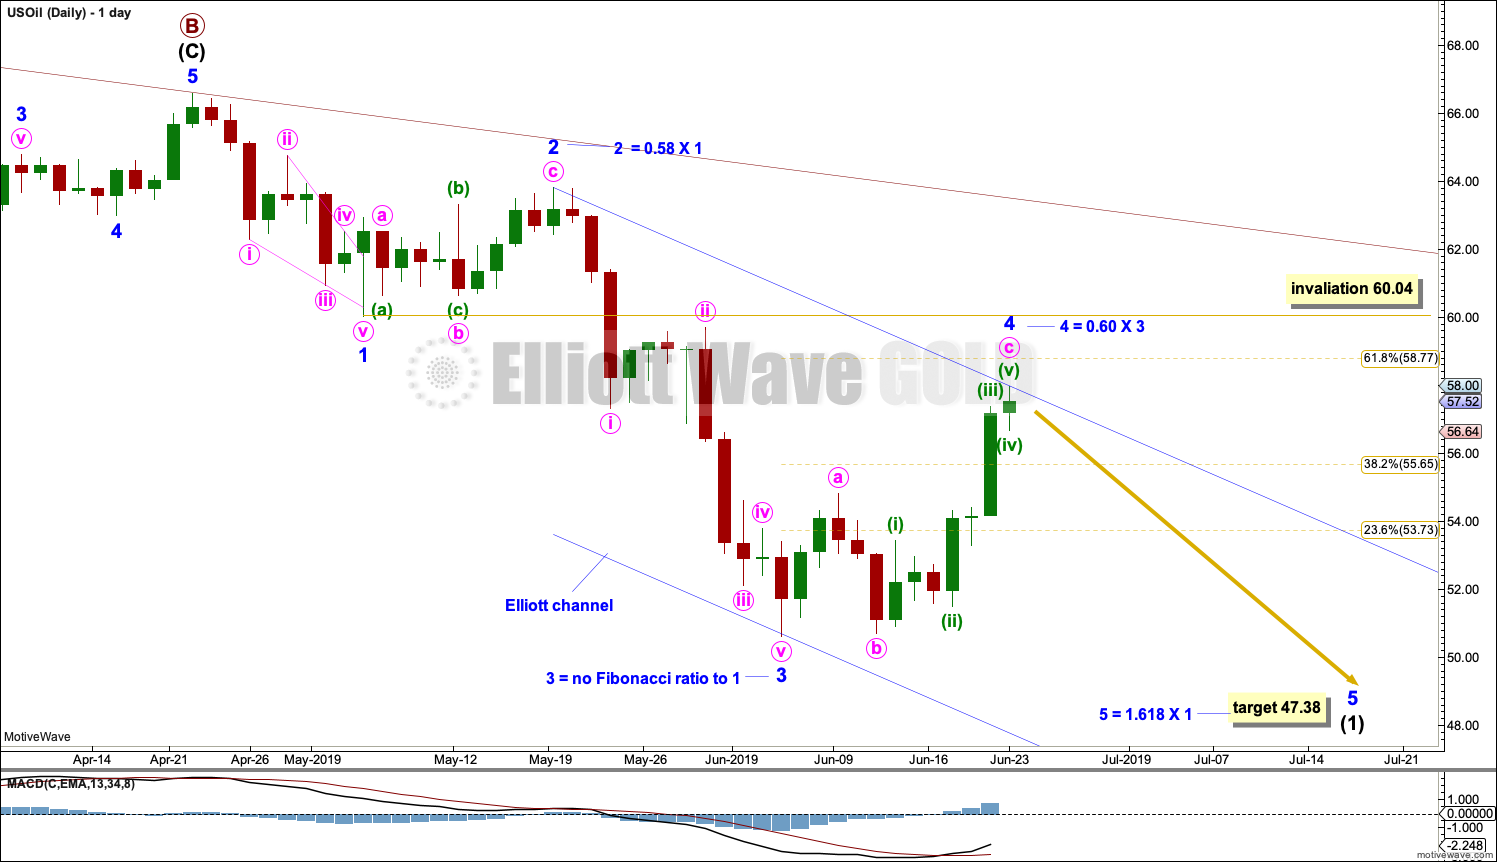
Note that monthly and weekly charts are on a semi-log scale, but this daily chart is on an arithmetic scale. This makes a slight difference to trend channels.
The daily chart focusses on the structure of intermediate wave (1) within primary wave C.
Intermediate wave (1) may be continuing lower as an impulse. Within intermediate wave (1), minor waves 1 through to 4 may be complete. Minor wave 3 shows an increase in downwards momentum beyond that of minor wave 1. This wave count fits with MACD.
Minor wave 2 was a relatively deep zigzag lasting 10 sessions. Minor wave 4 may be complete as a deep zigzag lasting 12 sessions. The lack of alternation in this wave count reduces its probability. Minor wave 4 is slightly longer in duration than minor wave 2, which further slightly reduces the probability of this wave count. The alternate below may be a reasonable solution.
Minor wave 3 did not exhibit a Fibonacci ratio to minor wave 1. A target is calculated that would expect minor wave 5 to exhibit a Fibonacci ratio to minor wave 1.
DAILY CHART ALTERNATE
Click chart to enlarge.
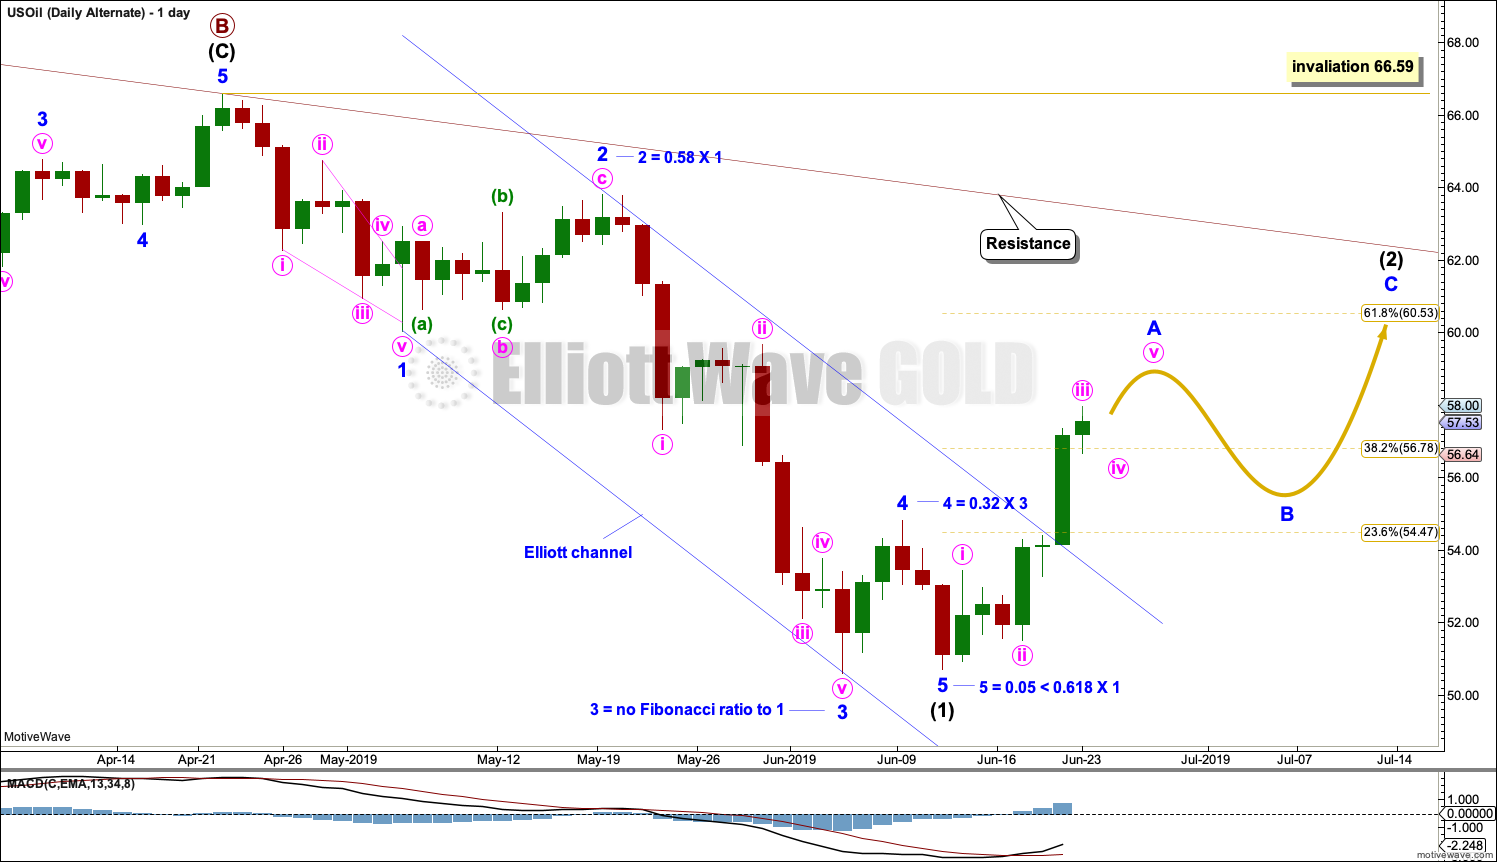
It is possible that intermediate wave (1) is complete. Minor wave 4 for this wave count now exhibits some alternation to minor wave 2; minor wave 2 may be a relatively deep zigzag or flat, and minor wave 4 may be a more shallow zigzag.
Minor wave 5 ends with a slight 0.11 truncation. This reduces the probability of this wave count.
Intermediate wave (2) would most likely unfold as a zigzag and may end either about the 0.618 Fibonacci ratio of intermediate wave (1) or about the upper edge of the maroon Elliott channel. Intermediate wave (2) may continue for another one to three weeks.
Intermediate wave (2) may not move beyond the start of intermediate wave (1) above 66.59.
TECHNICAL ANALYSIS
MONTHLY CHART
Click chart to enlarge. Chart courtesy of StockCharts.com.
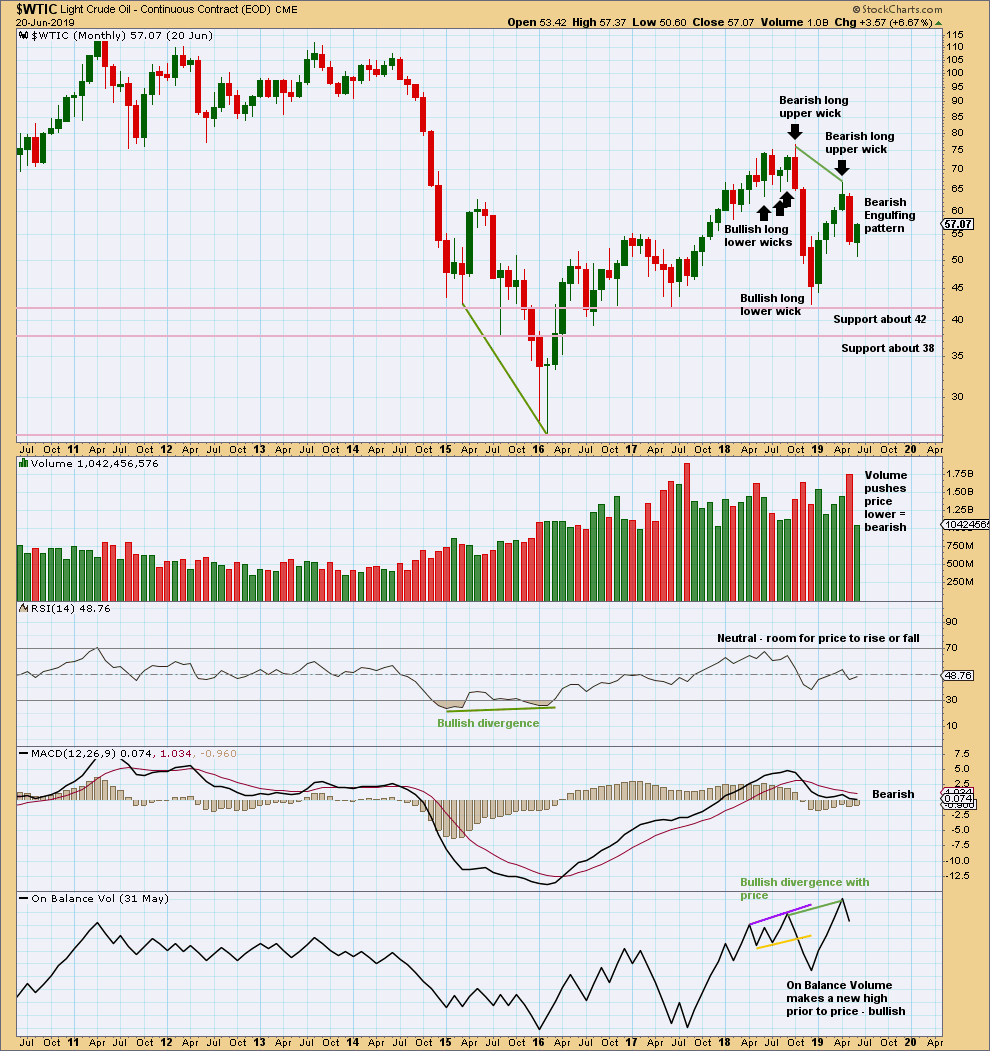
May has closed with a strong Bearish Engulfing candlestick pattern, which has strong support from volume. This supports the Elliott wave count.
WEEKLY CHART
Click chart to enlarge. Chart courtesy of StockCharts.com.
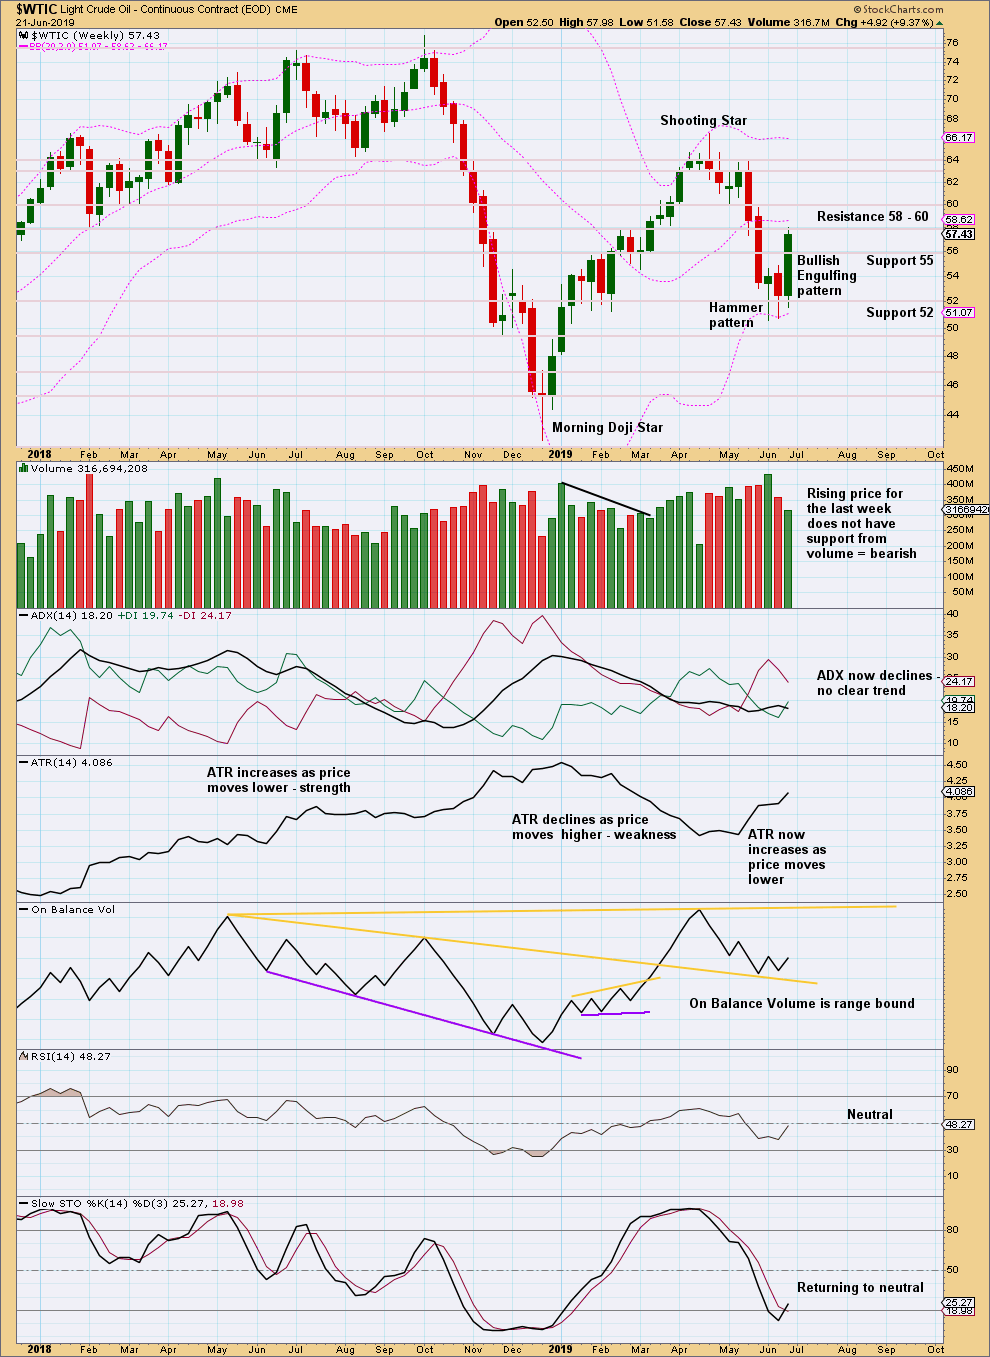
This week’s Bullish Engulfing pattern may reasonably be expected to be followed by either upwards or sideways movement to relive extreme conditions. Volume suggests upwards movement here may be limited.
DAILY CHART
Click chart to enlarge. Chart courtesy of StockCharts.com.
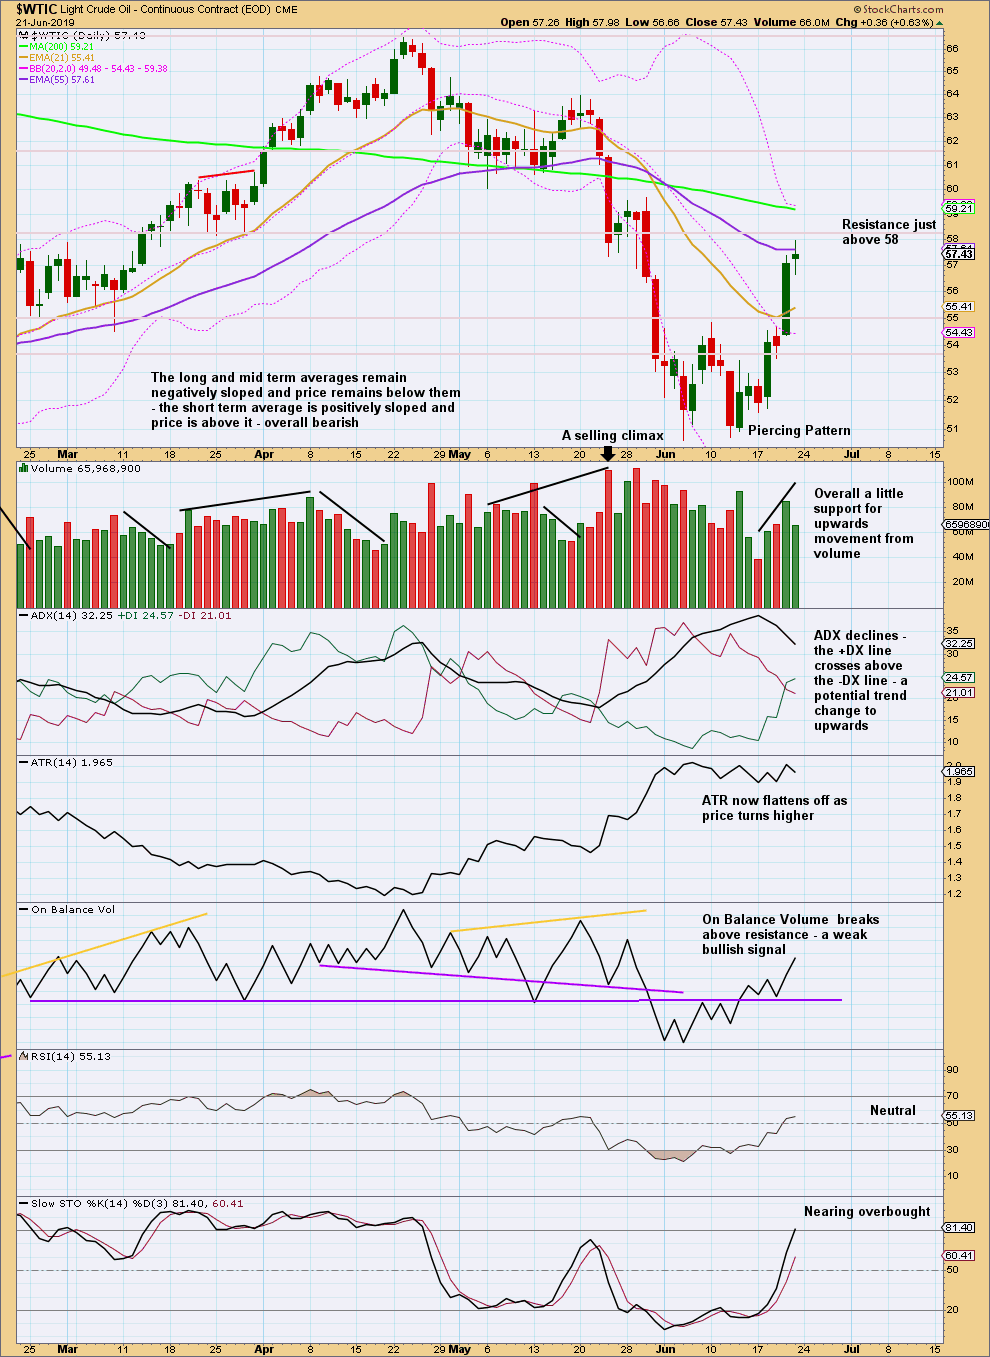
Some upwards movement is relieving extreme conditions. There is room for this bounce to continue.
Published @ 12:42 p.m. EST on June 22, 2019.
—
Careful risk management protects your trading account(s).
Follow my two Golden Rules:
1. Always trade with stops.
2. Risk only 1-5% of equity on any one trade.
—
New updates to this analysis are in bold.