
A small bounce to about 61.33 was expected to begin the week, and thereafter downwards movement was expected to continue and to show an increase in momentum. The bounce was more shallow than expected, reaching only to 59.69, but strong downwards movement fits the larger picture exactly.
Summary: The next mid term target is now calculated at 46.66.
The final target is now calculated at 10.72.
MAIN ELLIOTT WAVE COUNT
MONTHLY CHART
Click chart to enlarge.
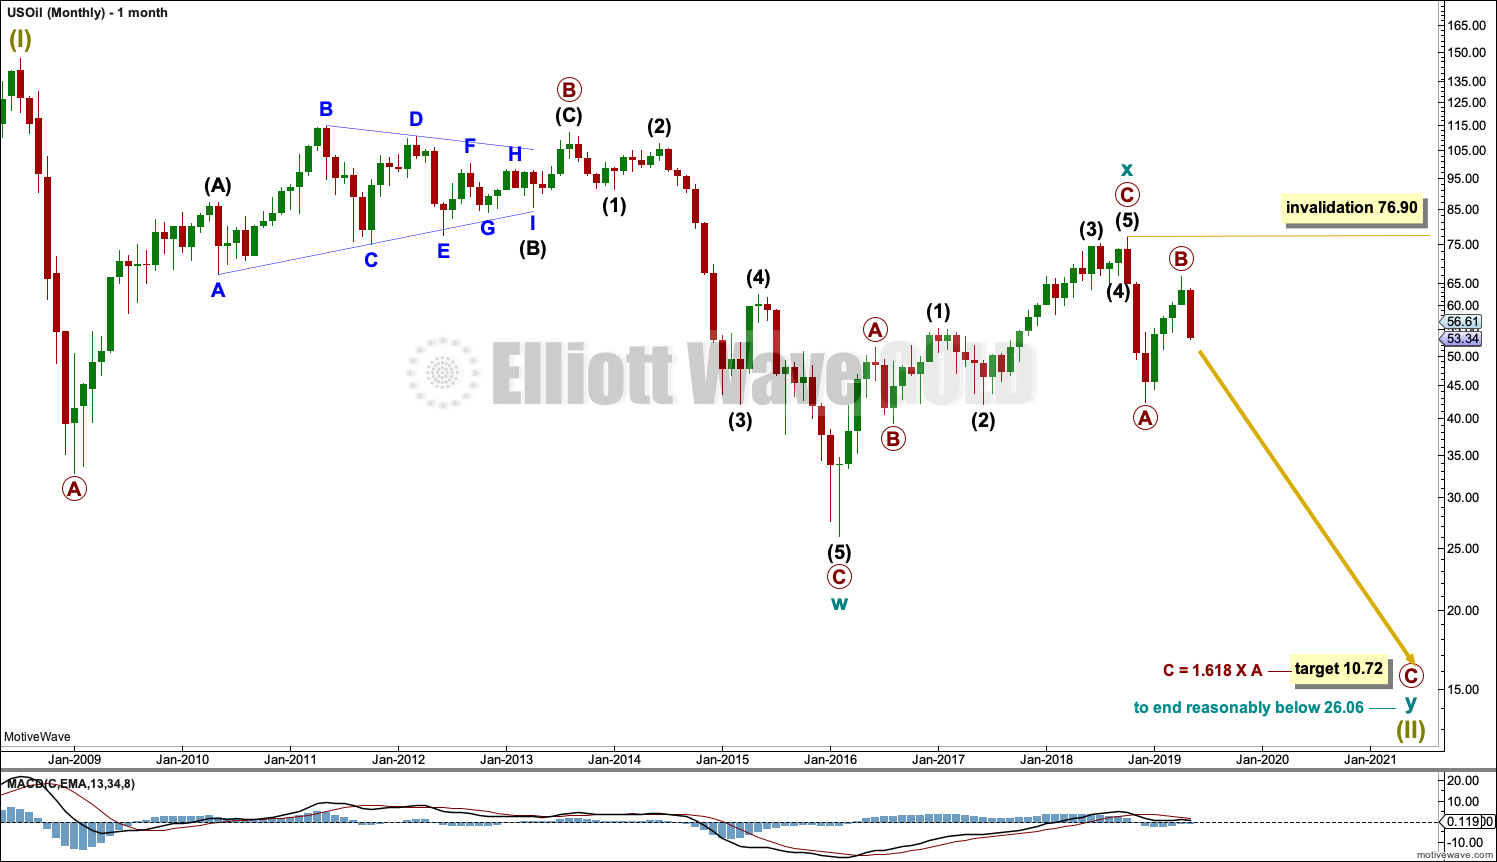
The basic Elliott wave structure is five steps forward and three steps back. This Elliott wave count expects that US Oil is still within a three steps back pattern, which began in July 2008. The Elliott wave count expects that the bear market for US Oil continues.
This Elliott wave corrective structure is a double zigzag, which is a fairly common structure. The correction is labelled Super Cycle wave (II).
The first zigzag in the double is complete and labelled cycle wave y. The double is joined by a three in the opposite direction labelled cycle wave x, which subdivides as a zigzag. The second zigzag in the double may now have begun, labelled cycle wave w.
The purpose of a second zigzag in a double zigzag is to deepen the correction when the first zigzag does not move price deep enough. To achieve this purpose cycle wave y may be expected to move reasonably below the end of cycle wave w at 26.06. The target calculated would see this expectation met.
Cycle wave y is expected to subdivide as a zigzag, which subdivides 5-3-5.
Cycle wave w lasted 7.6 years and cycle wave x lasted 2.7 years. Cycle wave y may be expected to last possibly about a Fibonacci 5 or 8 years.
If it continues higher, then primary wave B may not move beyond the start of primary wave A above 76.90.
WEEKLY CHART
Click chart to enlarge.
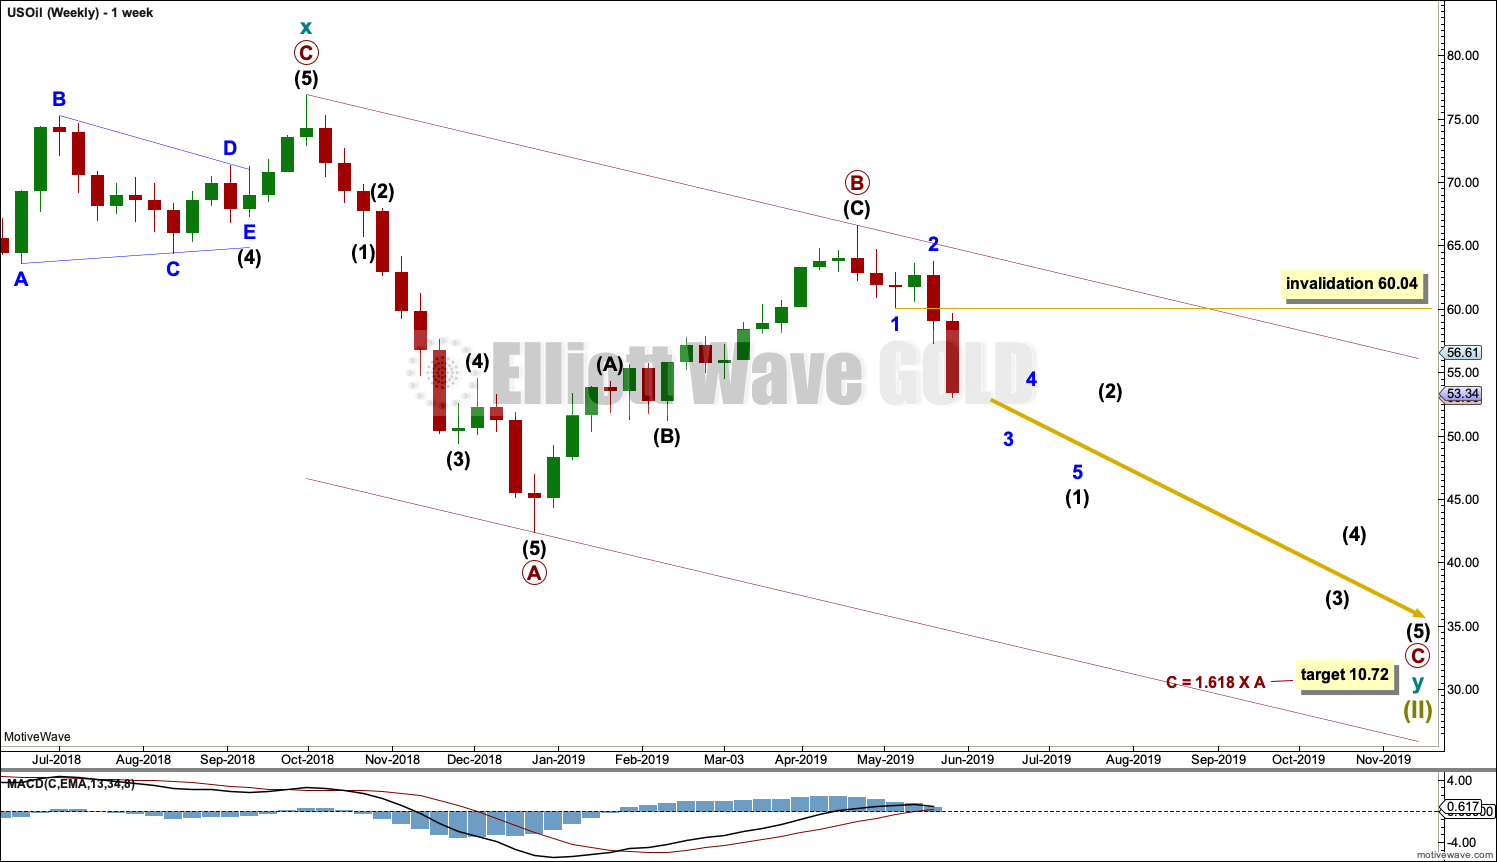
This weekly chart is focussed on the start of cycle wave y.
Cycle wave y is expected to subdivide as a zigzag. A zigzag subdivides 5-3-5. Primary wave A must subdivide as a five wave structure if this wave count is correct.
Primary wave A may be a complete five wave impulse at the last low.
Primary wave B may now be a complete single zigzag at the last high.
Primary wave C may have just begun. Primary wave C must subdivide as a five wave structure.
Primary wave A lasted 12 weeks, just one short of a Fibonacci 13.
Primary wave C may be longer in time as well as price. If cycle wave y lasts a Fibonacci 5 years, then primary wave C within it may take as long as a Fibonacci 233 weeks.
Intermediate wave (1) within primary wave C may be subdividing as an impulse. Within the impulse, minor wave 4 may not move into minor wave 1 price territory above 60.04.
Draw a channel about the zigzag of primary wave y using Elliott’s technique for a correction. Draw the first trend line from the start of primary wave A to the end of primary wave B, then place a parallel copy on the end of primary wave A. The upper edge of this channel may show where bounces along the way down find resistance. The lower edge of the channel may provide support.
DAILY CHART
Click chart to enlarge.
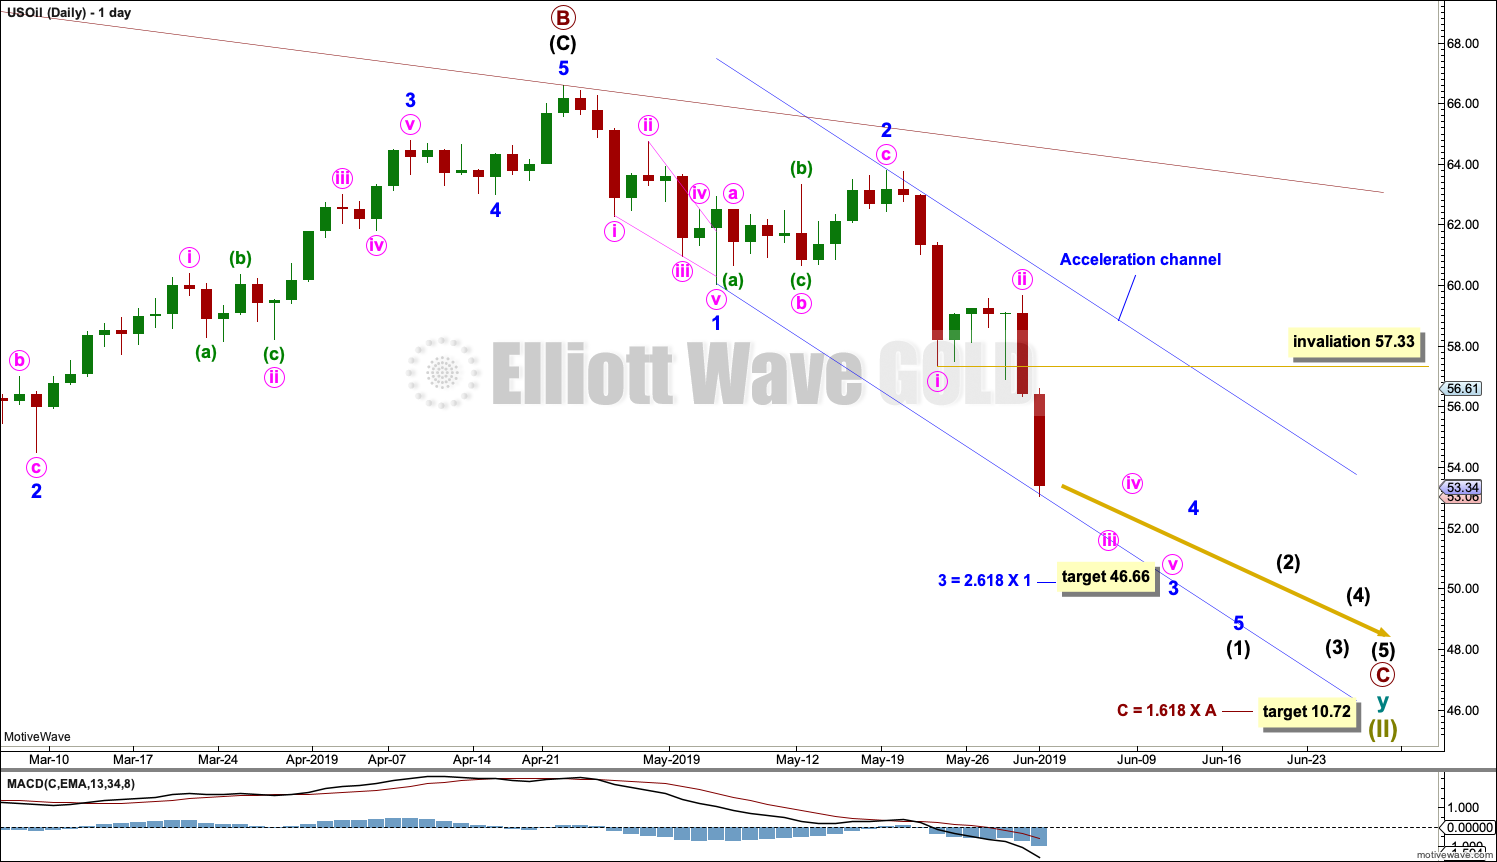
Note that monthly and weekly charts are on a semi-log scale, but this daily chart is on an arithmetic scale. This makes a slight difference to trend channels.
Primary wave C must subdivide as a five wave structure, most likely an impulse. Within the impulse, minor waves 1 and now 2 may be complete. The target calculated last week for minor wave 3 to reach 1.618 the length of minor wave 1 at 53.21 has been met and passed and the structure of minor wave 3 looks incomplete. A new target is calculated for minor wave 3 to end using the next Fibonacci ratio in the sequence.
Minor wave 3 may only subdivide as an impulse. Within the impulse, minute wave iv may not move into minute wave i price territory above 57.33.
TECHNICAL ANALYSIS
MONTHLY CHART
Click chart to enlarge. Chart courtesy of StockCharts.com.
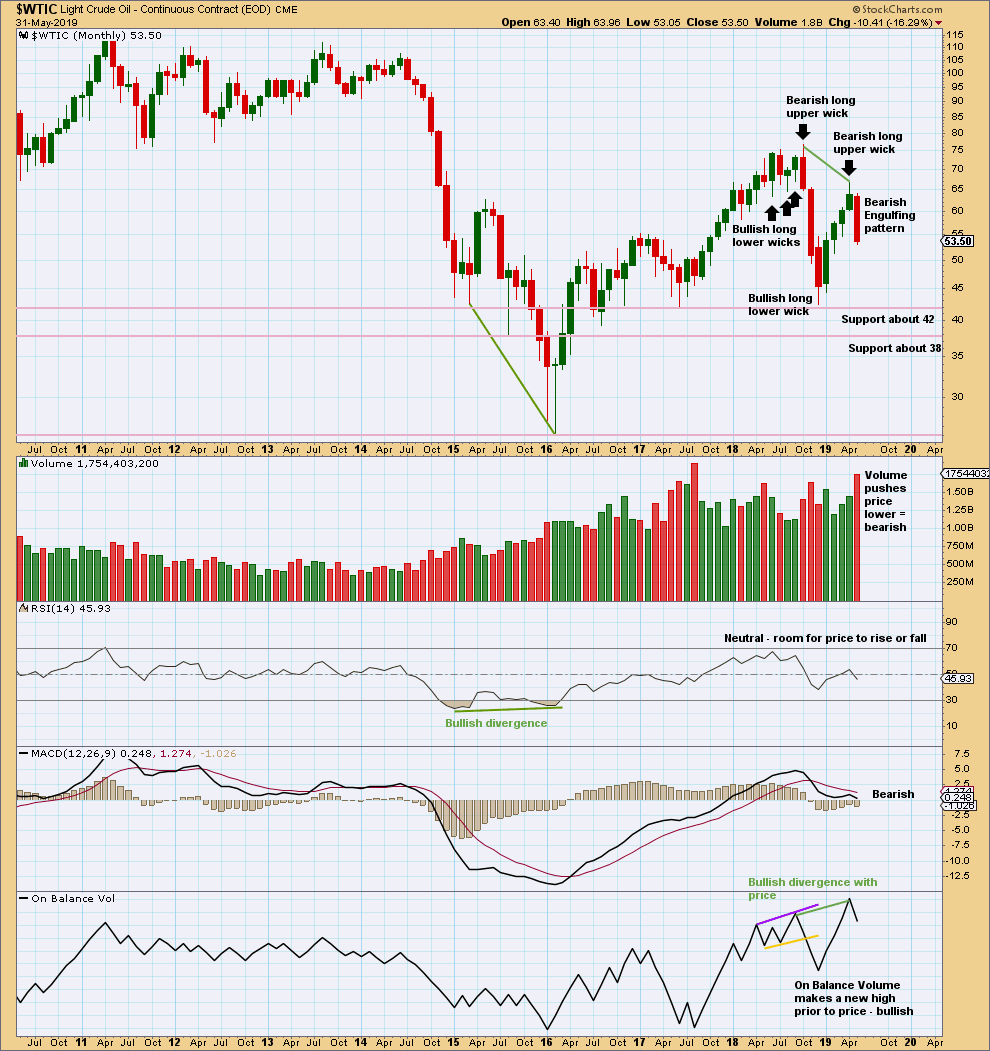
May has closed with a strong Bearish Engulfing candlestick pattern, which has strong support from volume. This supports the Elliott wave count.
WEEKLY CHART
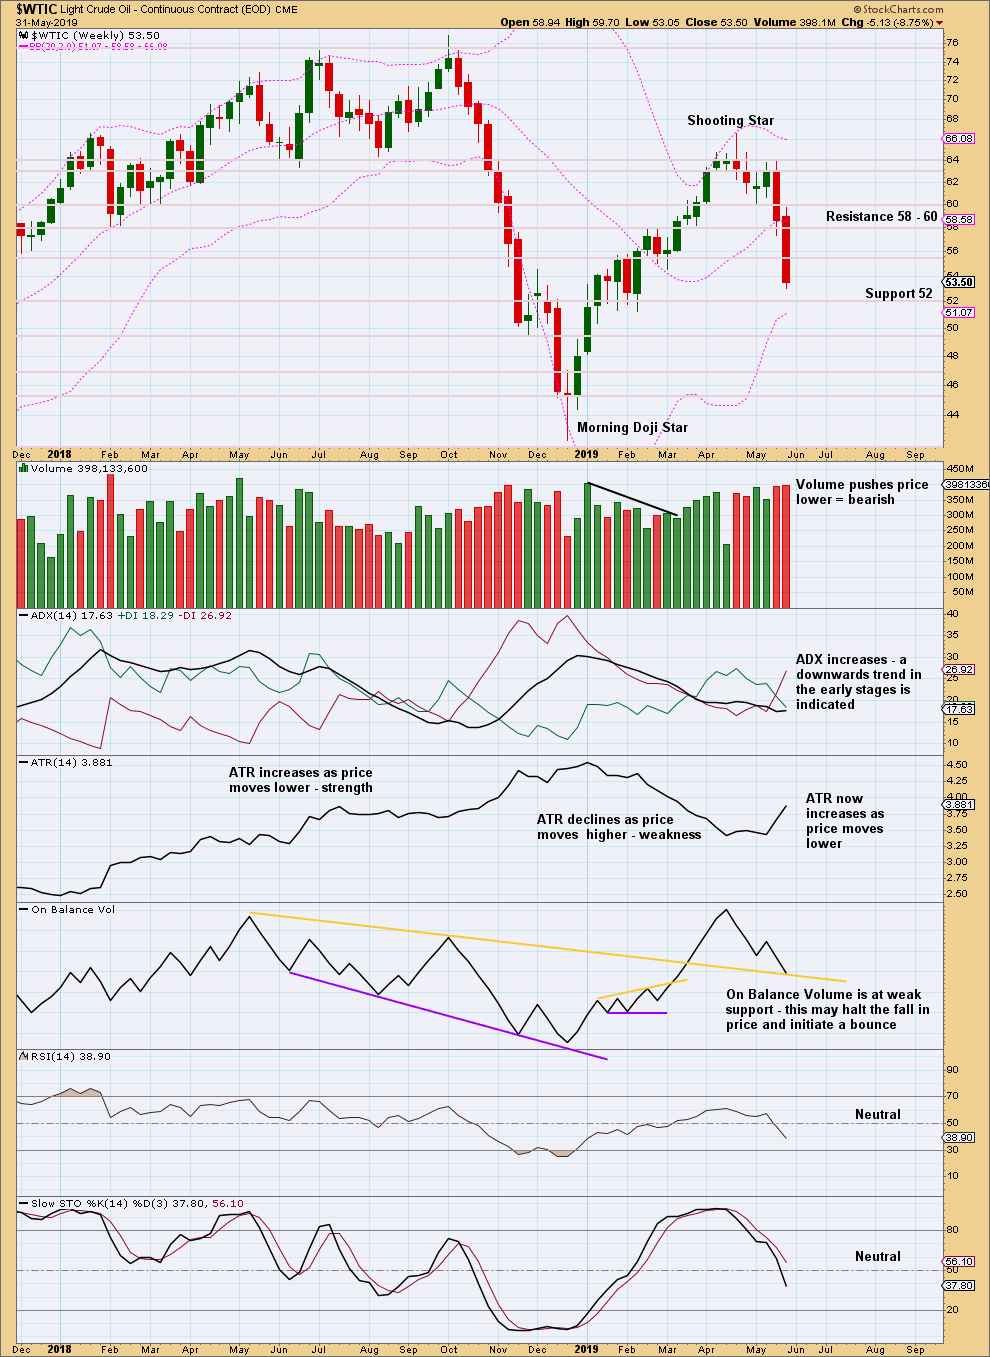
Click chart to enlarge. Chart courtesy of StockCharts.com.
This chart remains bearish and supports the Elliott wave count.
Support on On Balance Volume is weak. It may not halt a fall in price.
DAILY CHART
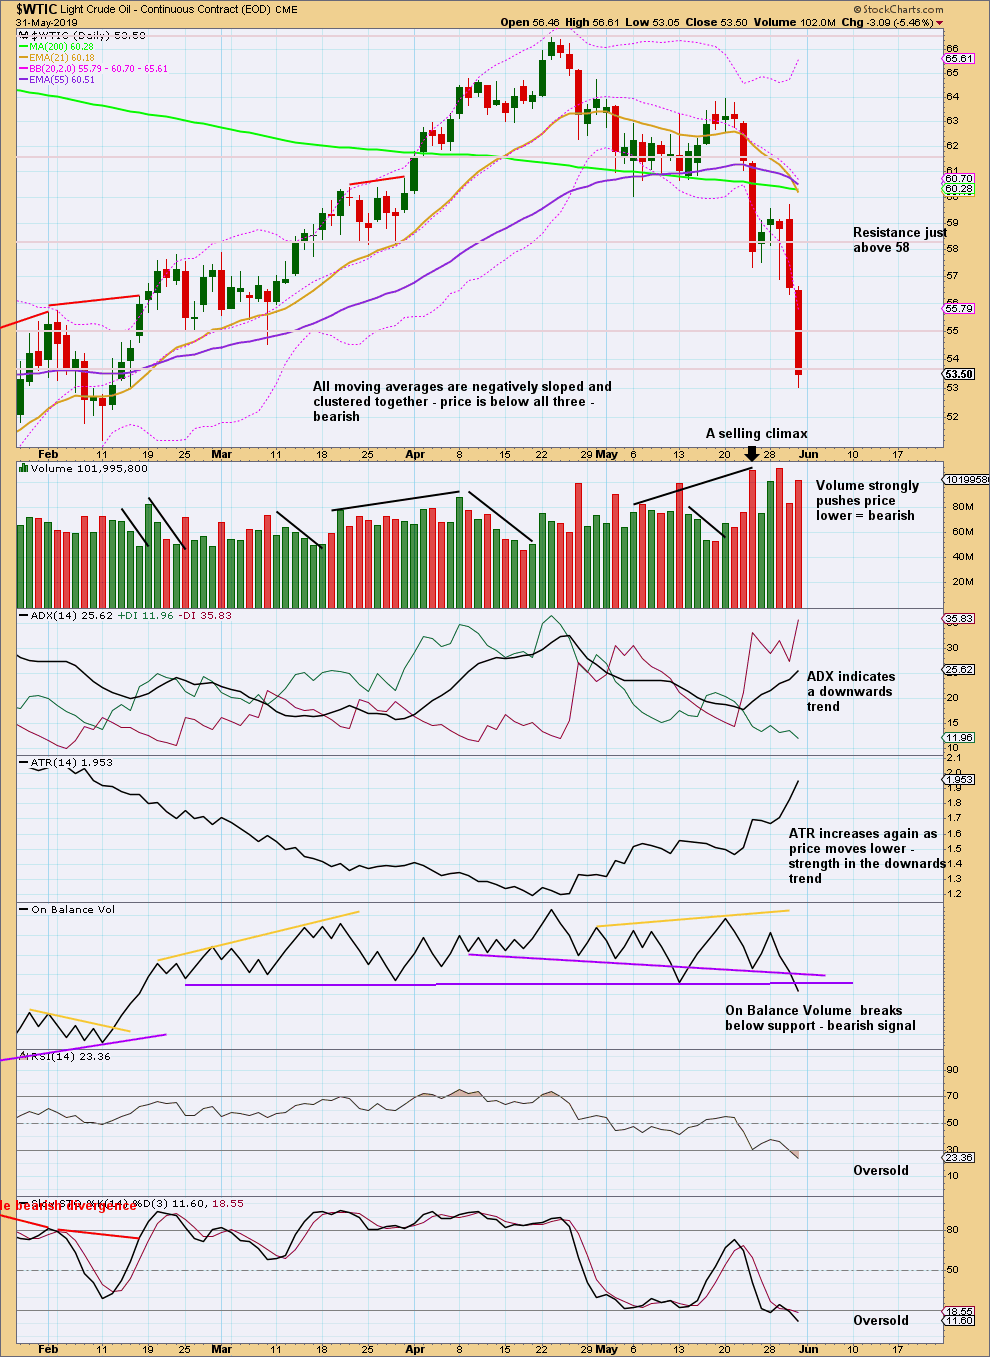
Click chart to enlarge. Chart courtesy of StockCharts.com.
The downwards trend has strength.
Stochastics may remain oversold for a reasonable period of time when Oil trends strongly. Only when it has been oversold for a while and then exhibits bullish divergence with price would it be indicating an end to the downwards trend.
Likewise, RSI may also remain extreme for reasonable periods of time when Oil trends. Bullish divergence would indicate a possible end to the trend. That is not evident yet.
Published @ 01:31 p.m. EST on June 1, 2019.
—
Careful risk management protects your trading account(s).
Follow my two Golden Rules:
1. Always trade with stops.
2. Risk only 1-5% of equity on any one trade.
—
New updates to this analysis are in bold.