
At the end of this week, monthly charts are updated and reviewed for Silver.
Summary: At this stage, some pullback to relieve extreme conditions looks likely to have begun. How low this goes will indicate which wave count, bull or bear, would be most likely. The target for a pullback on the bullish count is about 15.149.
A new low below 14.288 would indicate the bearish wave count would be most likely. At that stage, a mid-term target would be at 10.39.
If price makes a new high by any amount at any time frame above 17.680, then only the very bullish Elliott wave count would remain. The target would then be at 33.94.
ELLIOTT WAVE COUNTS
BEARISH WAVE COUNT
MONTHLY CHART
Click chart to enlarge.
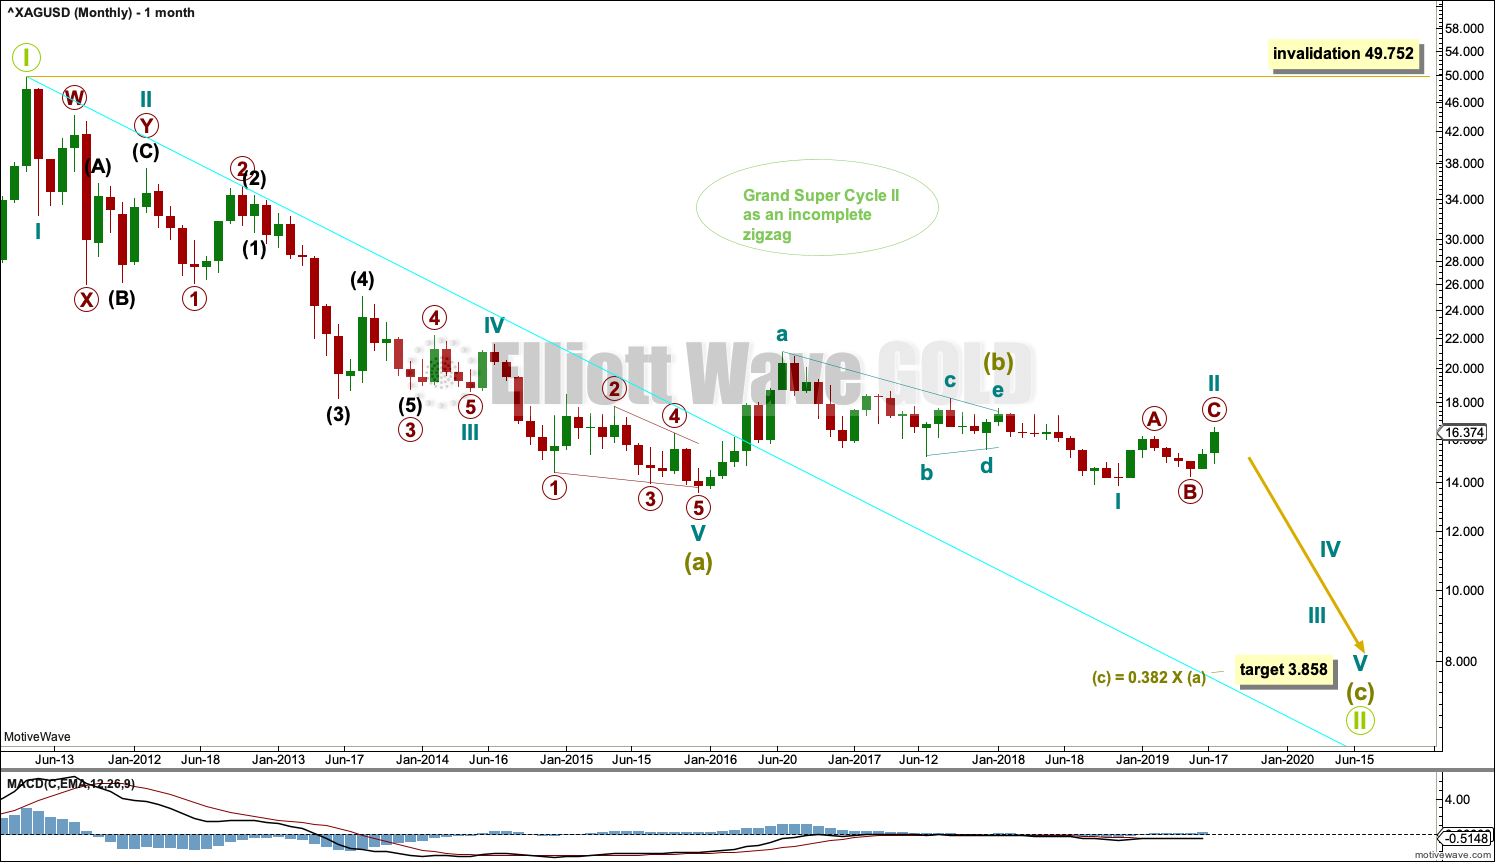
This week the degree of labelling for the bearish wave count is moved up one degree to be in line with the Elliott wave count for Gold.
There is less historical data for Silver than Gold. The wave count for Silver sees a second wave correction unfolding where Gold sees a fourth wave. Either way, the structure may be incomplete for both. Gold and Silver usually have somewhat different wave counts and see major highs and lows at different times.
This wave count sees Super Cycle wave (a) as a complete five wave impulse. Super Cycle wave (b) may not move beyond its start above 49.752.
Super Cycle wave (b) may be a complete regular contracting triangle.
Super Cycle wave (c) would most likely move below the end of Super Cycle wave (a) at 13.569 to avoid a truncation. The target calculated would see this achieved.
Super Cycle wave (c) must subdivide as a five wave motive structure, either an impulse or an ending diagonal, with an impulse much more likely.
WEEKLY CHART
Click chart to enlarge.
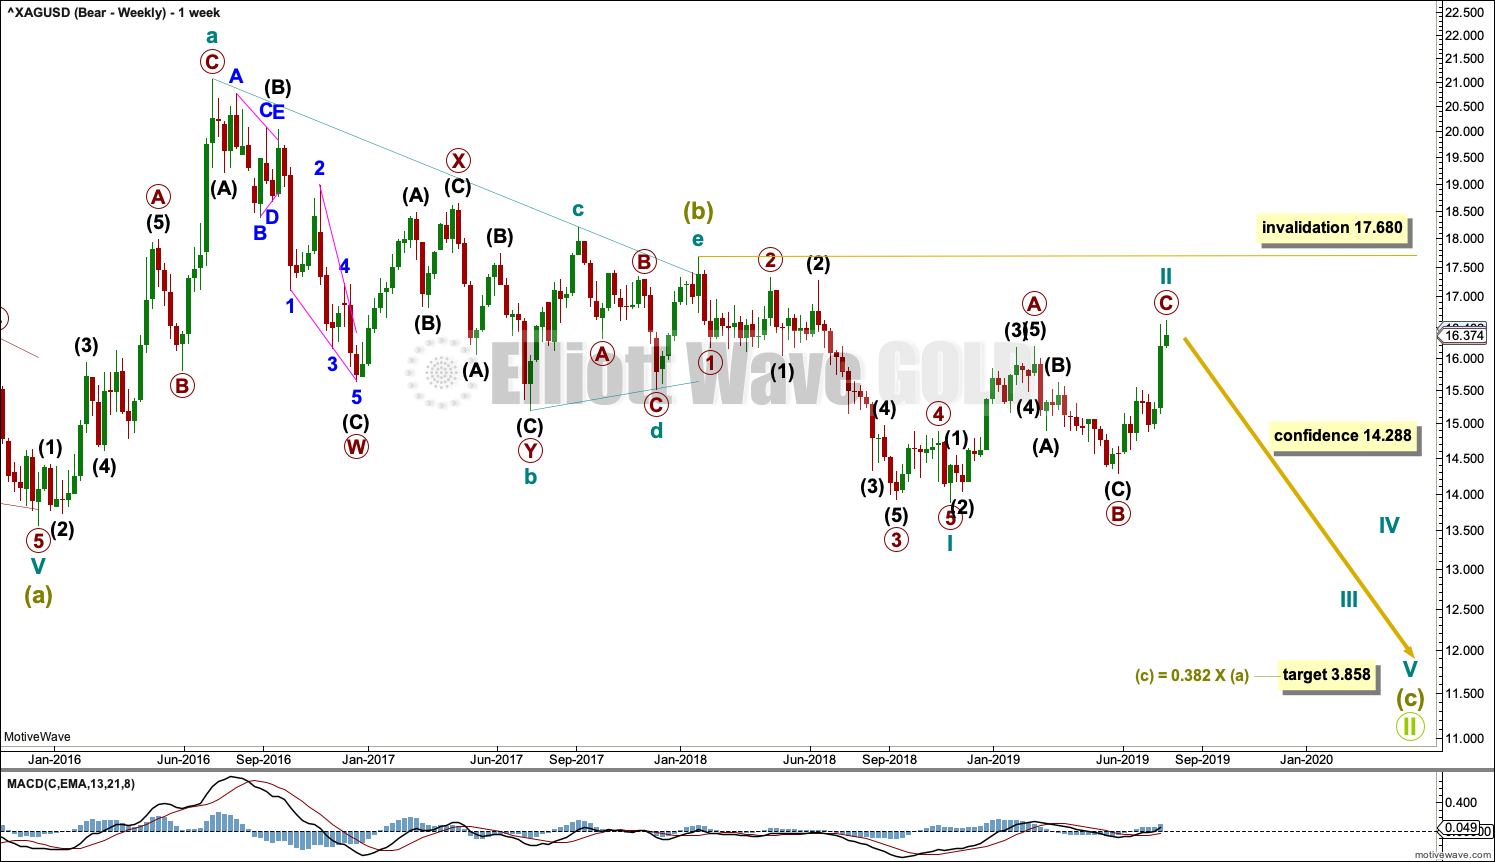
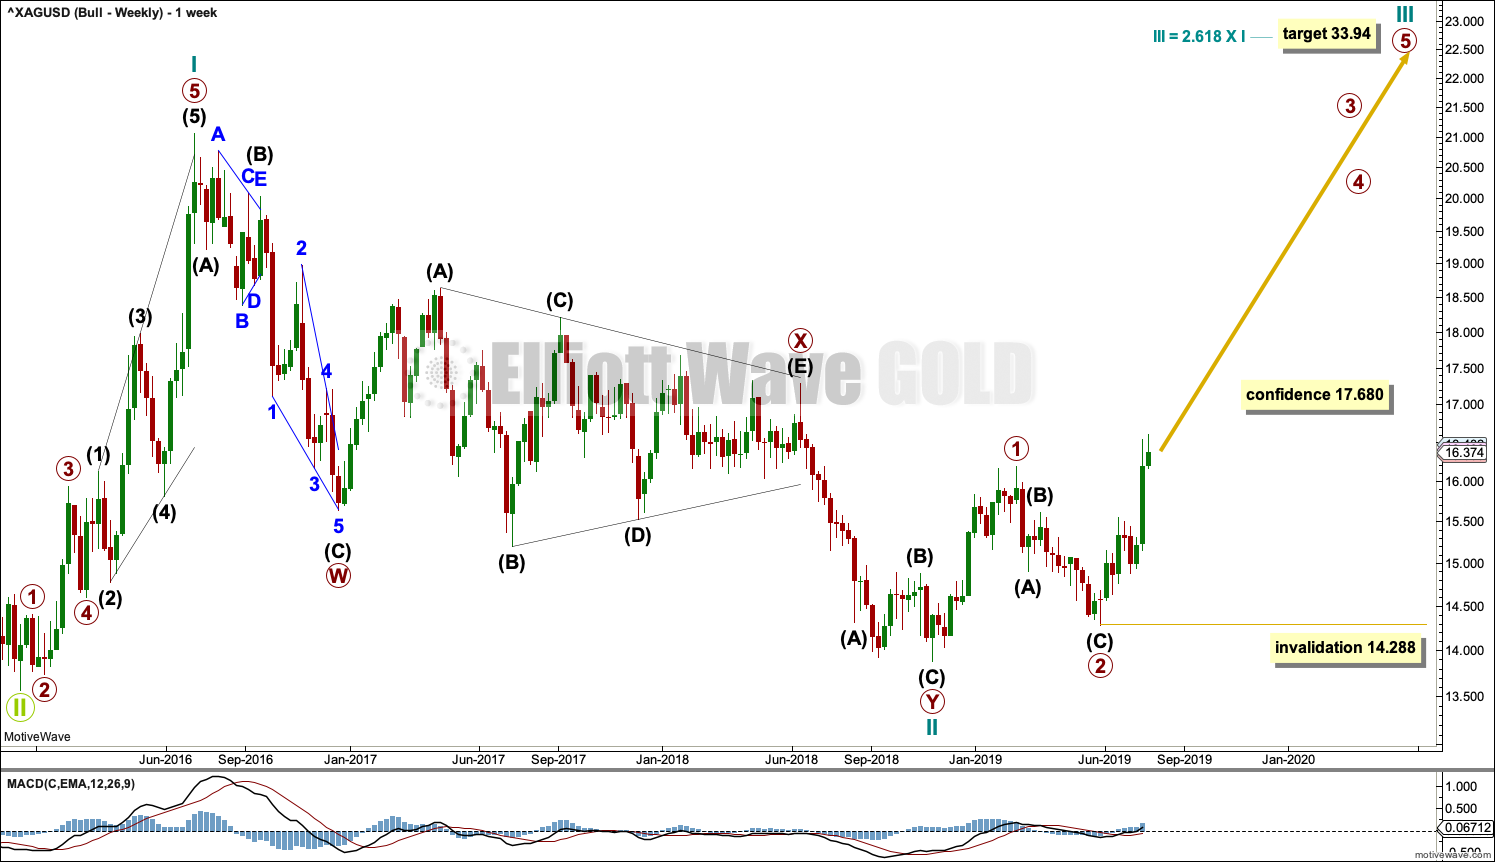
The basic Elliott wave structure is five steps forward followed by three steps back. At this time, it is expected that Silver is within a very large three steps back pattern that began at the all time high in April 2011.
Three steps back are almost always labelled in Elliott wave as A-B-C. This Elliott wave count now labels waves A and B complete as Super Cycle wave (a) and a triangle for Super Cycle wave (b).
The Elliott wave structure for Grand Super Cycle wave II may be a zigzag. Zigzags subdivide 5-3-5. Within this zigzag, Super Cycle waves (a) and (b) may be complete. Super Cycle wave (c) must subdivide as a five wave Elliott wave structure, most likely an impulse.
Within the impulse of Super Cycle wave (c), if cycle wave II continues higher as a double zigzag, it may not move beyond the start of cycle wave I above 17.680.
Within the zigzag of Grand Super Cycle wave II, it would be extremely likely for Super Cycle wave (c) to move below the end of cycle wave a at 13.569 to avoid a truncation. The target would see this achieved.
The daily chart below focusses on primary waves B and C within cycle wave II.
DAILY CHART
Click chart to enlarge.
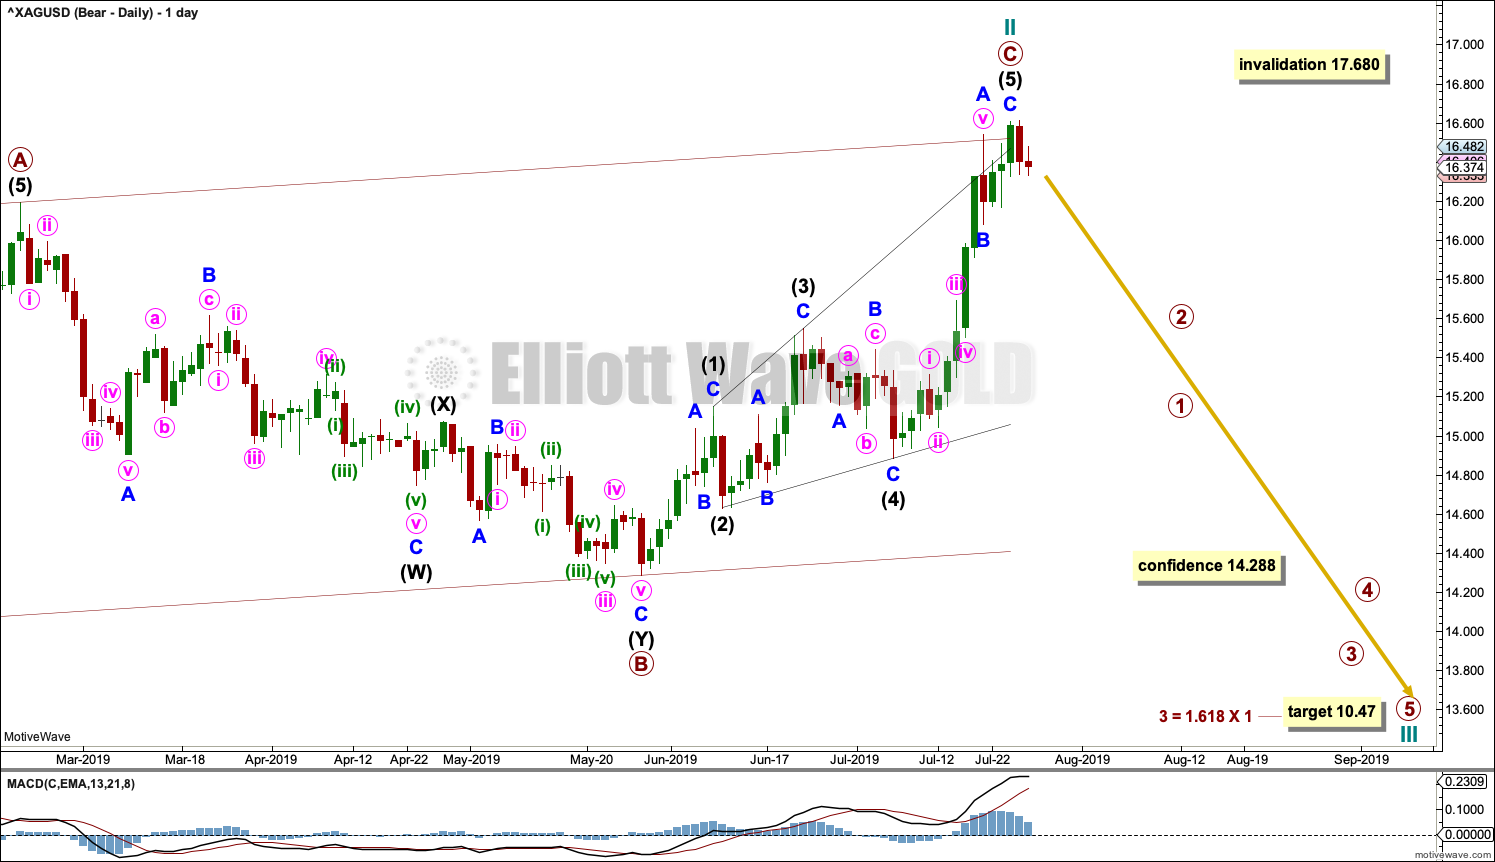
Cycle wave II may be a complete zigzag.
Zigzags subdivide 5-3-5. Within the zigzag, primary wave C is seen again as a complete ending expanding diagonal.
Within ending diagonals, all sub-waves must subdivide as zigzags and fourth waves must overlap first wave price territory. Within expanding diagonals, the third wave should be longer than the first, the fifth wave should be longer than the third, the fourth wave should be longer than the second, and the trend lines should diverge.
This wave count meets all rules for ending expanding diagonals. This structure still has the right look.
A target is now recalculated for cycle wave III to reach a common Fibonacci ratio to cycle wave I.
If cycle wave II continues any higher as a double zigzag, or primary wave C extends higher, then cycle wave II may not move beyond the start of cycle wave I above 17.680.
BULLISH WAVE COUNT
MONTHLY CHART
Click chart to enlarge.
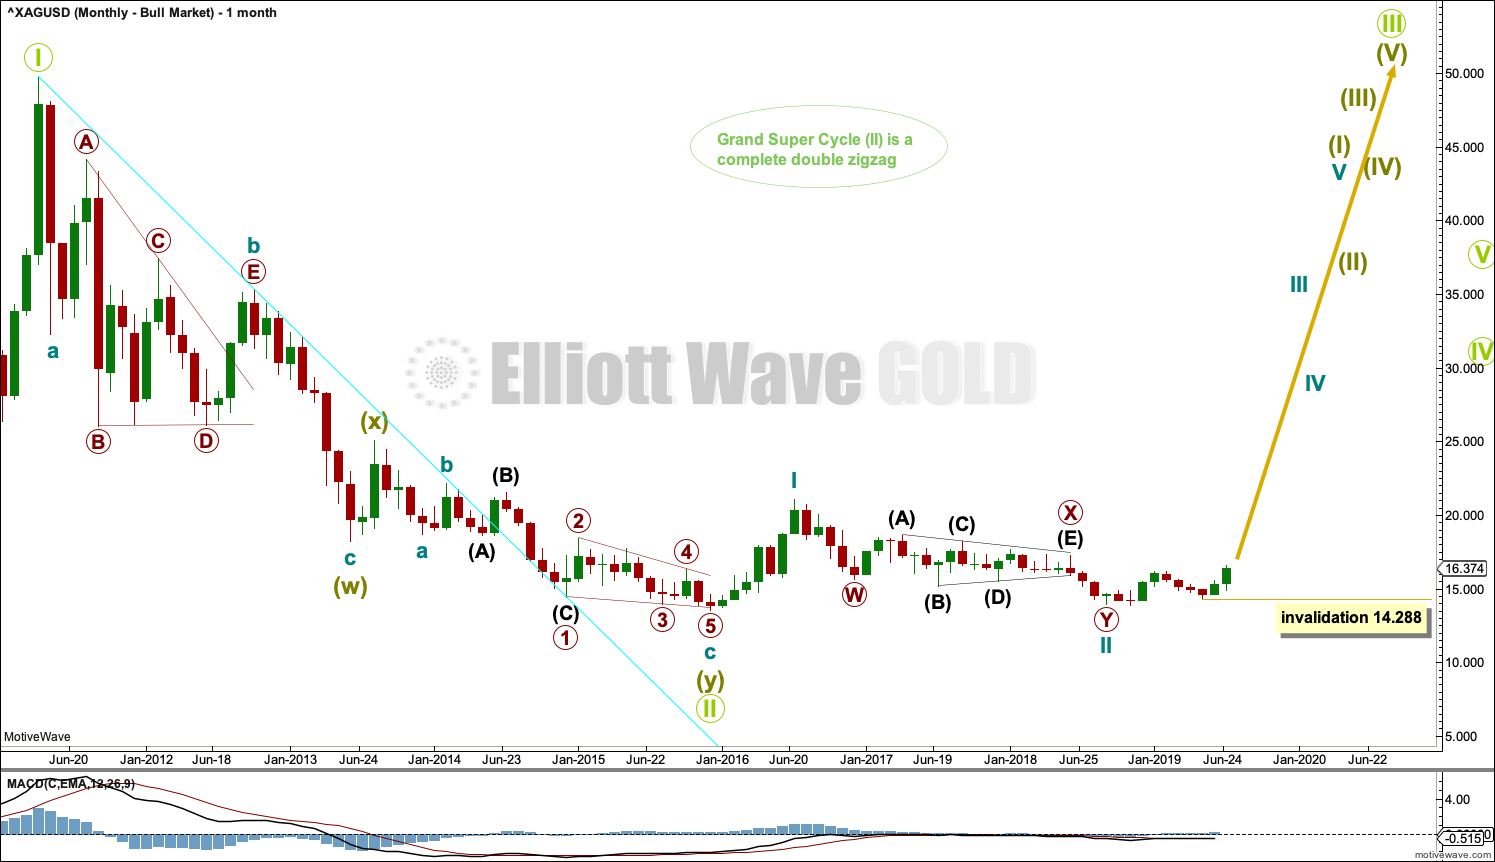
This bullish wave count looks at the possibility that the bear market may be over for Silver and a new bull market may have begun.
Grand Super Cycle wave II may be a complete double zigzag. Within this structure, there is a typically brief and shallow super cycle wave (x). The brevity of this X wave is acceptable within this structure.
If Grand Super Cycle wave II is complete, then a new substantial bull market may be in the very early stages for silver.
WEEKLY CHART
Click chart to enlarge.
This bullish Elliott wave count sees the three steps back pattern as complete and a new bull market beginning for Silver at the low in December 2015.
A new bull market should begin with a five wave structure upwards. This is labelled cycle wave I.
Following five steps forward should be three steps back. This is labelled cycle wave II. The Elliott wave corrective structure of cycle wave II is labelled as a double zigzag, which is a fairly common structure.
Cycle wave III may only subdivide as an impulse. Within the impulse, primary waves 1 and 2 may now be complete.
Primary wave 3 may only subdivide as an impulse. Within the impulse, no second wave correction may move beyond its start below 14.288.
DAILY CHART
Click chart to enlarge.
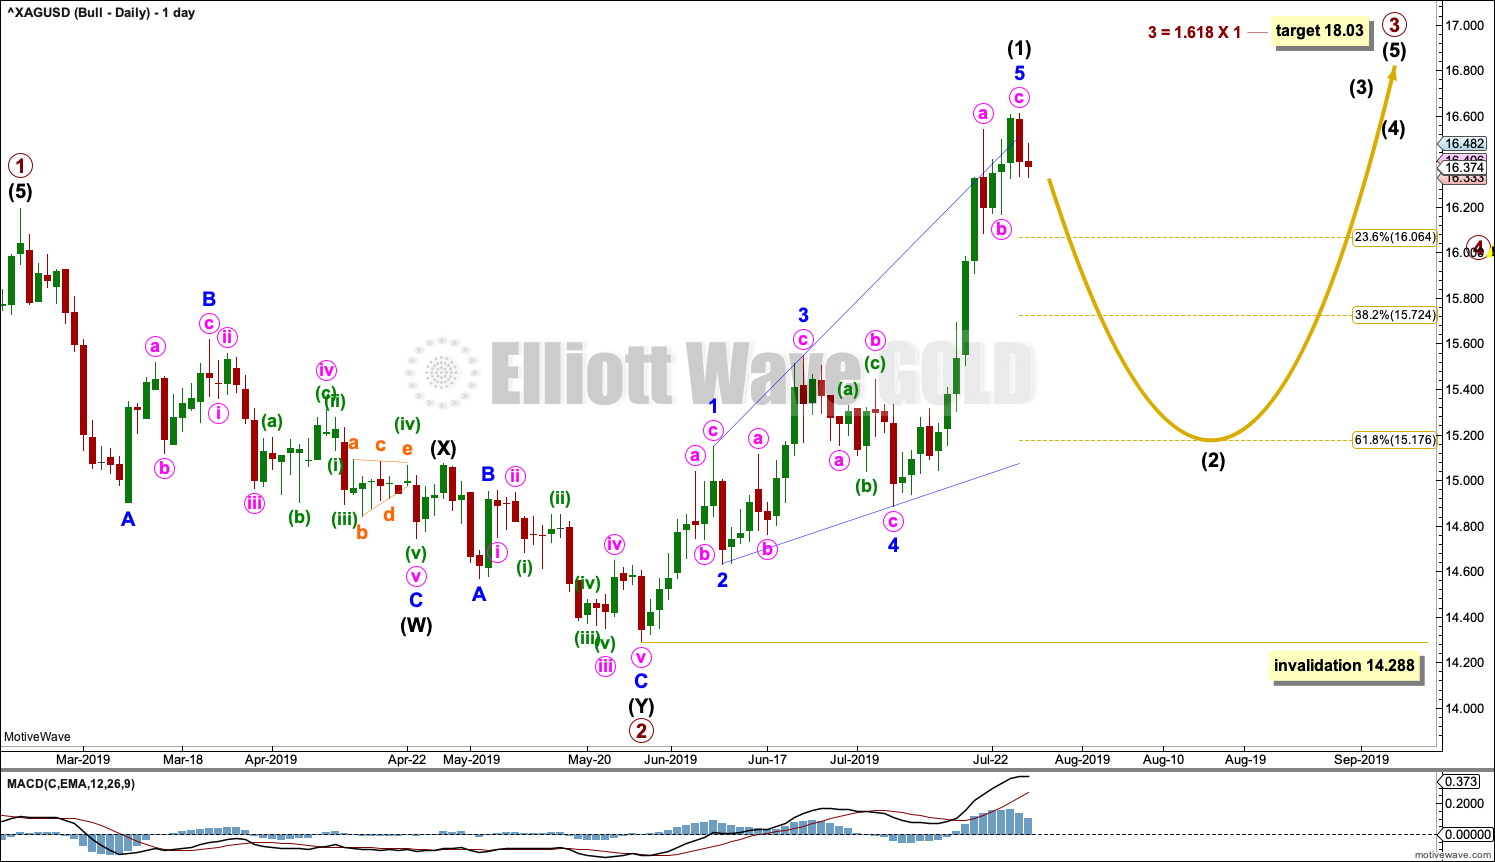
Primary wave 3 may only subdivide as an impulse. Within the impulse, intermediate wave (1) may again be complete as a leading expanding diagonal.
Within leading diagonals, sub-waves two and four must subdivide as zigzags. Sub-waves one, three and five are most commonly zigzags but may sometimes appear as impulses. In this example, they all fit best as zigzags. Within a leading diagonal, wave four must overlap wave one price territory.
Within expanding diagonals, the third wave should be longer than the first, the fifth wave should be longer than the third, the fourth wave should be longer than the second, and the trend lines should diverge.
This structure meets all Elliott wave rules for a leading expanding diagonal. It still has the right look.
Second wave corrections following leading diagonals in first wave positions are normally very deep. Here, intermediate wave (2) may be expected to be at least 0.618 the depth of intermediate wave (1), but it could be deeper than that.
Intermediate wave (2) may not move beyond the start of intermediate wave (1) below 14.288.
ALTERNATE MONTHLY CHART
Click chart to enlarge.
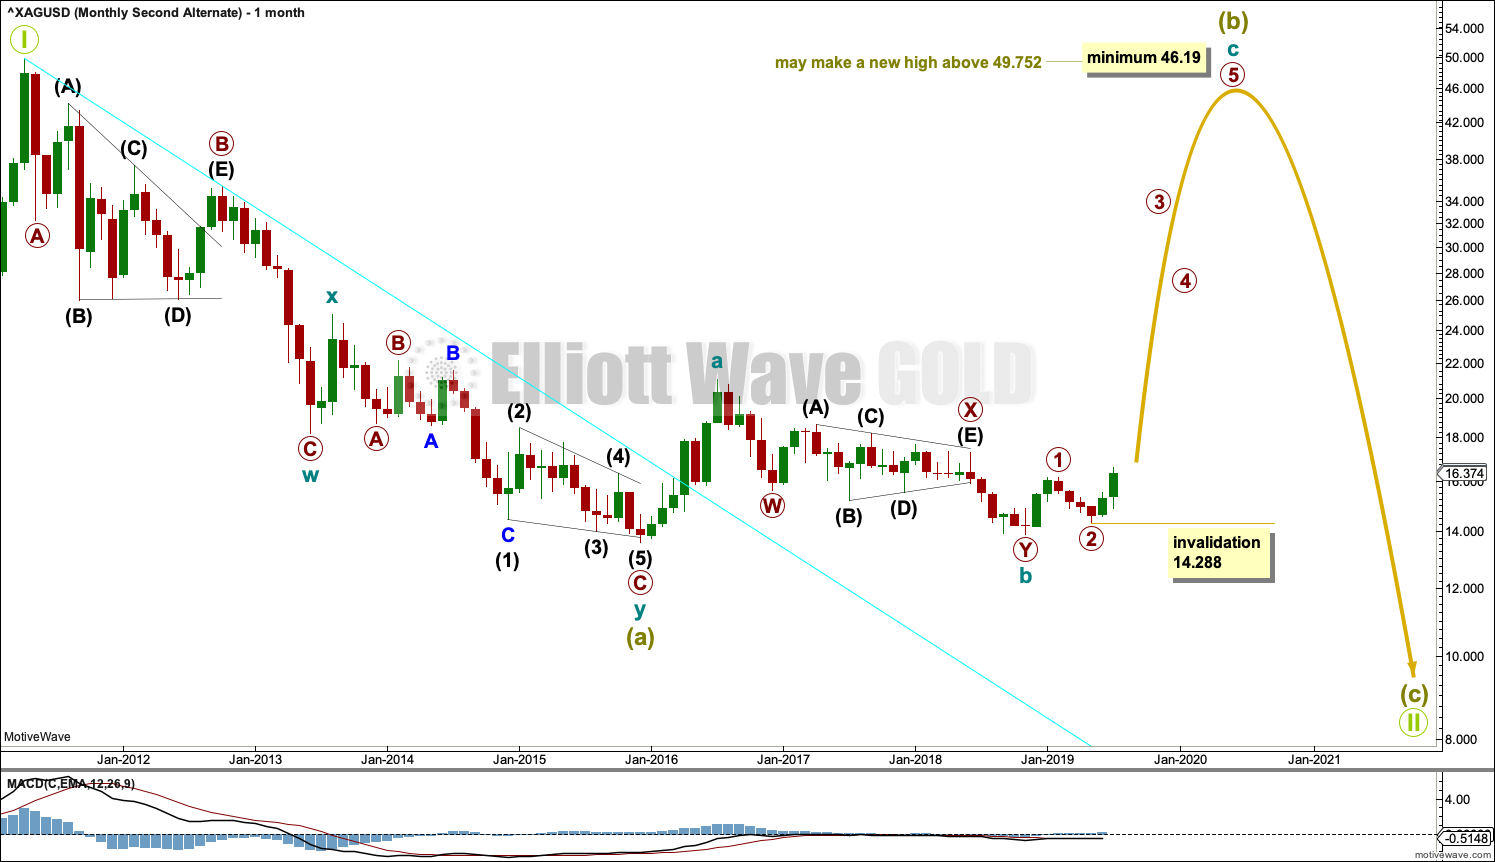
By simply moving the degree of labelling all down one degree (from the bullish monthly chart above), within the last bear market from April 2011 to December 2015, it is possible that Grand Super Cycle wave II is an incomplete flat correction.
If super cycle wave (a) is a double zigzag, then Grand Super Cycle wave II may not continue further as a combination because multiples may not subdivide into multiples.
If super cycle wave (a) is a corrective structure, then Grand Super Cycle wave II may be unfolding as a flat correction. Within the flat correction, super cycle wave (b) must retrace a minimum 0.9 length of super cycle wave (a), and may make a new high above the start of super cycle wave (a) as in an expanded flat.
Grand Super Cycle wave II may not unfold as a triangle. Triangles may not occur as the sole corrective structure in a second wave position.
This wave count does not diverge in expected direction from the bullish wave count at this time, and may not diverge for some years. It will be left as another possibility to consider if it remains valid in another one to few years time.
TECHNICAL ANALYSIS
WEEKLY CHART
Click chart to enlarge. Chart courtesy of StockCharts.com.
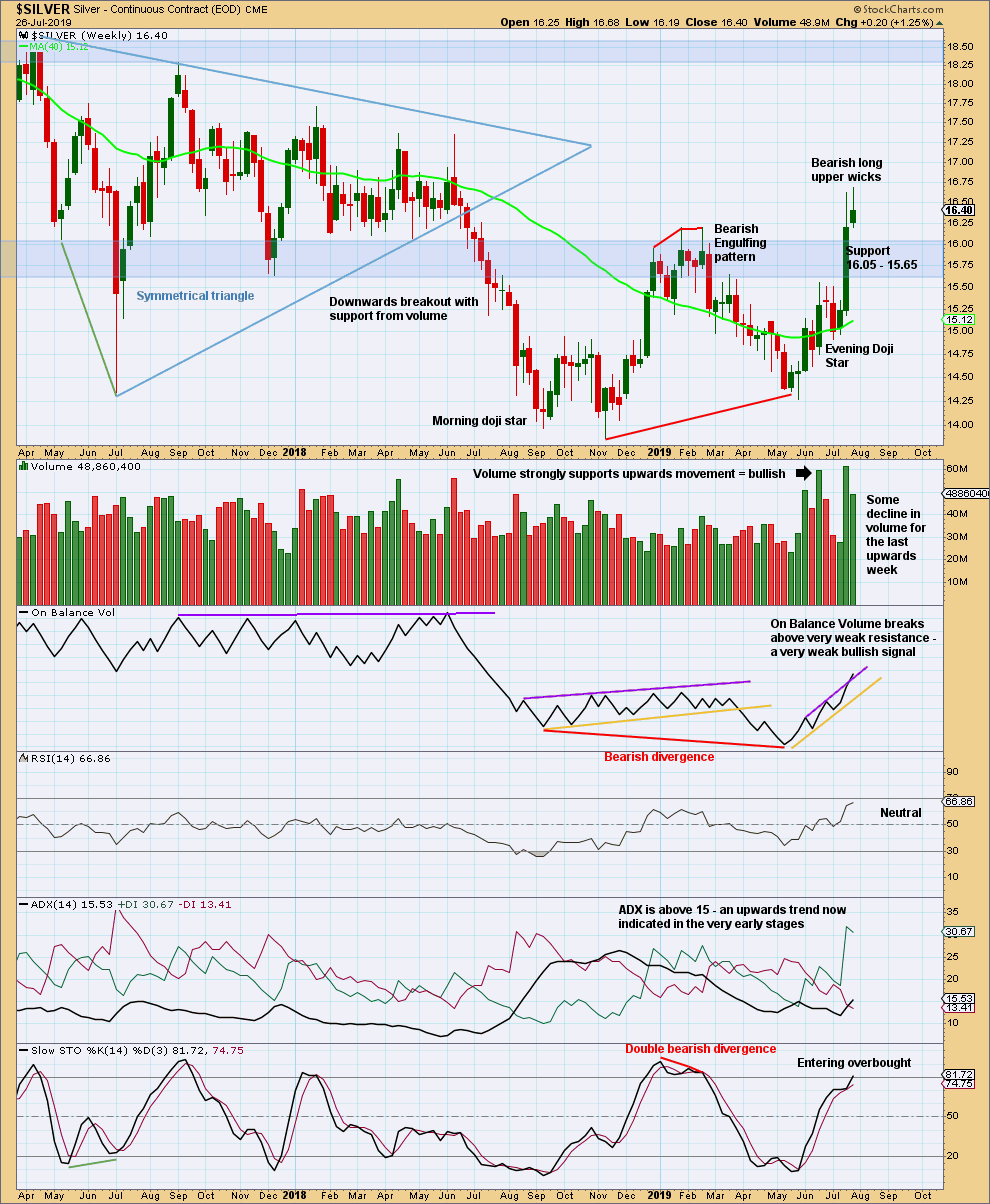
This week two long upper wicks and some decline in volume suggest some consolidation to back test support may begin about here.
There is an upwards trend. The break above resistance is highly technically significant.
DAILY CHART
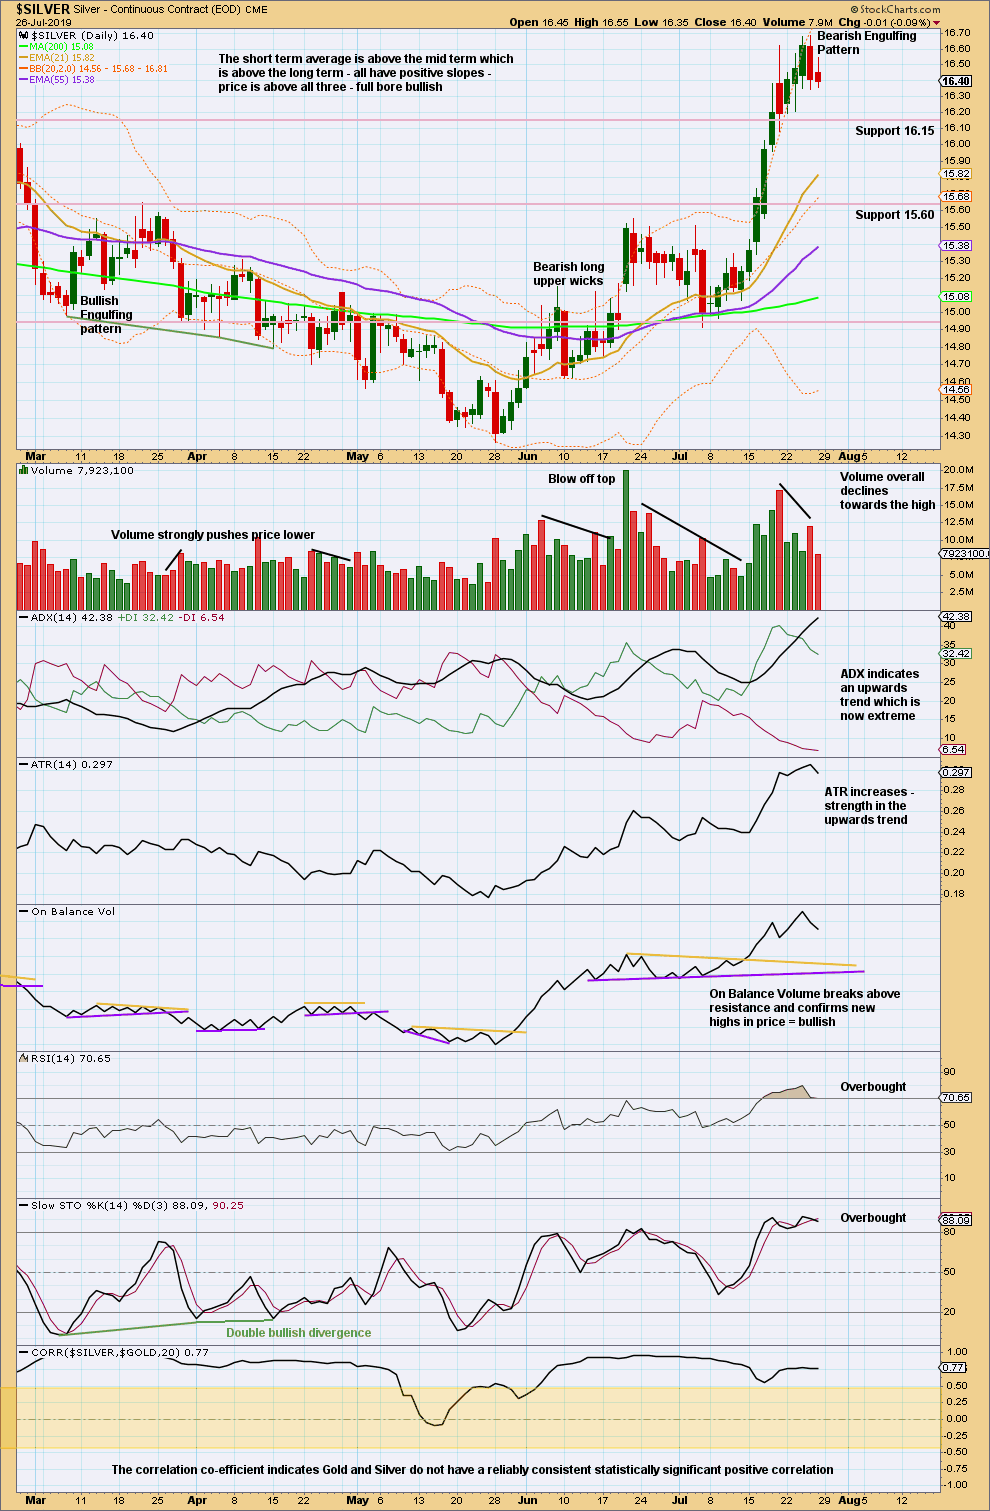
Click chart to enlarge. Chart courtesy of StockCharts.com.
While the breakout and upwards trend are significant at the weekly chart level, this week at the daily chart level some caution may be had regarding the upwards trend. At this time frame, it is now very extreme and there is a bearish candlestick reversal pattern at the last high.
Look for a possible pullback or consolidation now to relieve extreme conditions.
Published @ 01:49 a.m. EST on July 27, 2019.
—
Careful risk management protects your trading account(s).
Follow my two Golden Rules:
1. Always trade with stops.
2. Risk only 1-5% of equity on any one trade.
—
New updates to this analysis are in bold.