
Some sideways or downwards movement was expected for the week. An outside week closes red, meeting expectations overall.
Summary: The bounce may end now next week or possibly the week after at a target zone from 60.53 to 61.74. If price comes up to touch the upper edge of the maroon channel, then it should find strong resistance there and end the bounce.
The larger trend most likely still remains down. The final target is calculated at 10.72.
MAIN ELLIOTT WAVE COUNT
MONTHLY CHART
Click chart to enlarge.
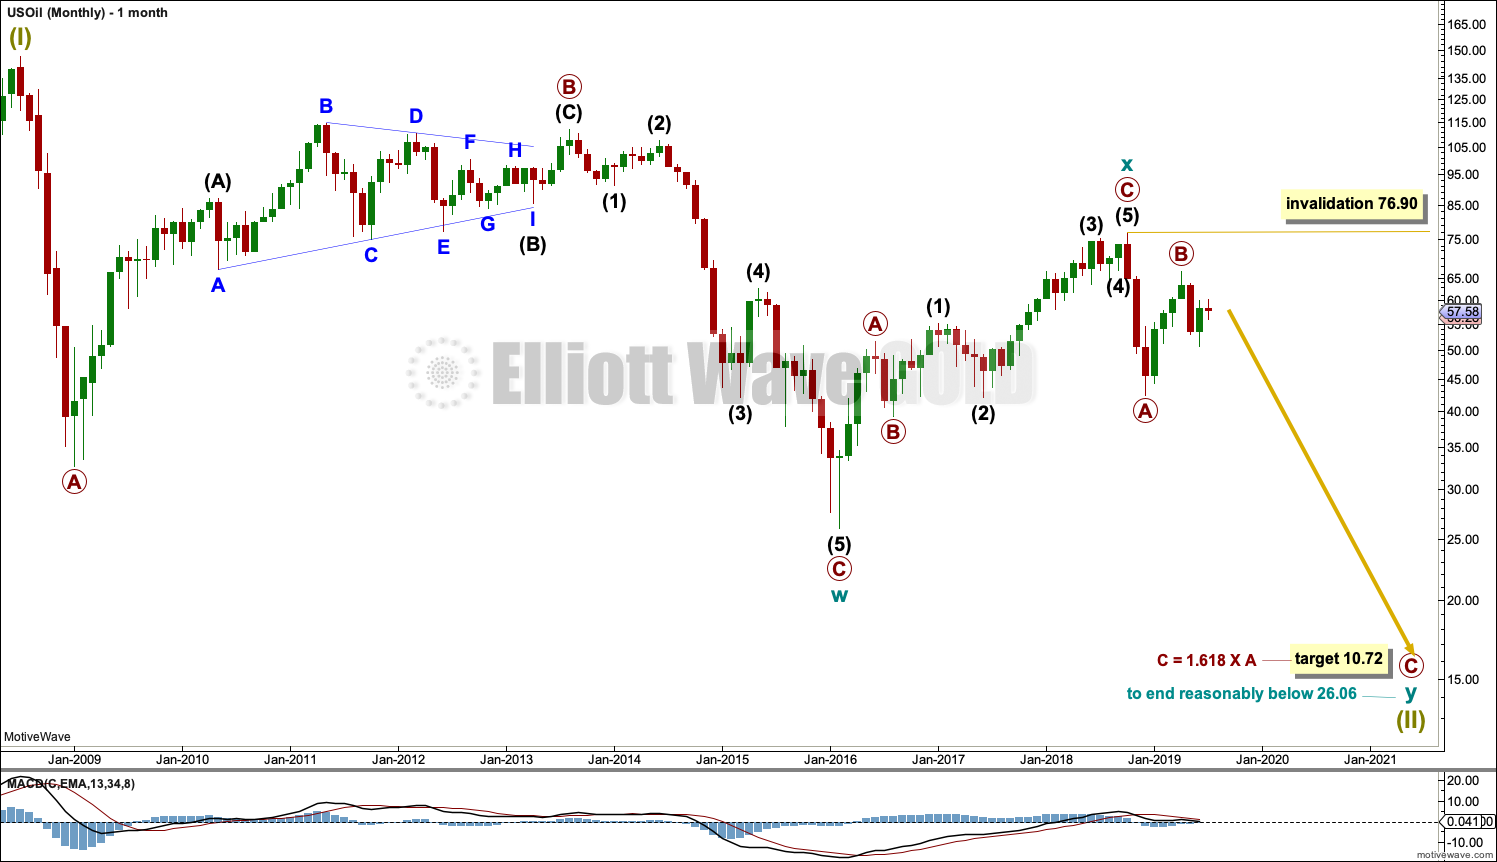
The basic Elliott wave structure is five steps forward and three steps back. This Elliott wave count expects that US Oil is still within a three steps back pattern, which began in July 2008. The Elliott wave count expects that the bear market for US Oil continues.
This Elliott wave corrective structure is a double zigzag, which is a fairly common structure. The correction is labelled Super Cycle wave (II).
The first zigzag in the double is complete and labelled cycle wave y. The double is joined by a three in the opposite direction labelled cycle wave x, which subdivides as a zigzag. The second zigzag in the double may now have begun, labelled cycle wave w.
The purpose of a second zigzag in a double zigzag is to deepen the correction when the first zigzag does not move price deep enough. To achieve this purpose cycle wave y may be expected to move reasonably below the end of cycle wave w at 26.06. The target calculated would see this expectation met.
Cycle wave y is expected to subdivide as a zigzag, which subdivides 5-3-5.
Cycle wave w lasted 7.6 years and cycle wave x lasted 2.7 years. Cycle wave y may be expected to last possibly about a Fibonacci 5 or 8 years.
If it continues higher, then primary wave B may not move beyond the start of primary wave A above 76.90.
The upwards wave labelled cycle wave x would have to be counted as a five wave impulse to see US Oil as within a new bull market. Such a wave count could be made but would look forced. This wave subdivides best as a three.
WEEKLY CHART
Click chart to enlarge.
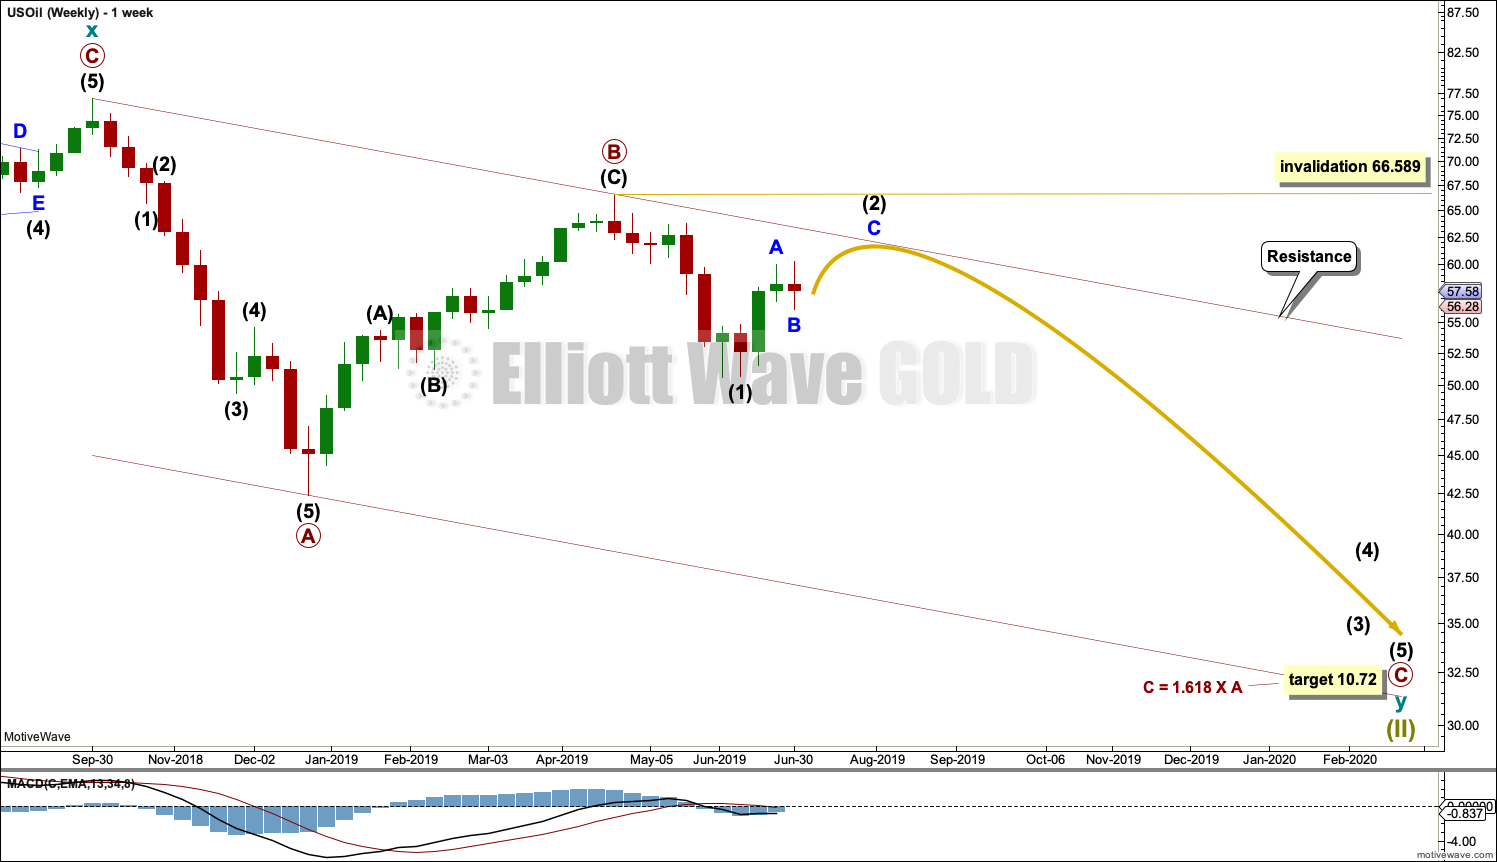
This weekly chart is focussed on the start of cycle wave y.
Cycle wave y is expected to subdivide as a zigzag. A zigzag subdivides 5-3-5. Primary wave A must subdivide as a five wave structure if this wave count is correct.
Primary wave A may be a complete five wave impulse at the last low.
Primary wave B may now be a complete single zigzag at the last high.
Primary wave C may have just begun. Primary wave C must subdivide as a five wave structure.
Primary wave A lasted 12 weeks, just one short of a Fibonacci 13.
Primary wave C may be longer in time as well as price. If cycle wave y lasts a Fibonacci 5 years, then primary wave C within it may take as long as a Fibonacci 233 weeks.
Intermediate wave (1) within primary wave C may be a complete impulse. Intermediate wave (2) may not move beyond the start of intermediate wave (1) above 66.59.
Draw a channel about the zigzag of primary wave y using Elliott’s technique for a correction. Draw the first trend line from the start of primary wave A to the end of primary wave B, then place a parallel copy on the end of primary wave A. The upper edge of this channel may show where bounces along the way down find resistance. The lower edge of the channel may provide support.
If intermediate wave (2) does come up to touch the upper edge of the maroon channel, then that may offer an opportunity to join the downwards trend.
DAILY CHART
Click chart to enlarge.
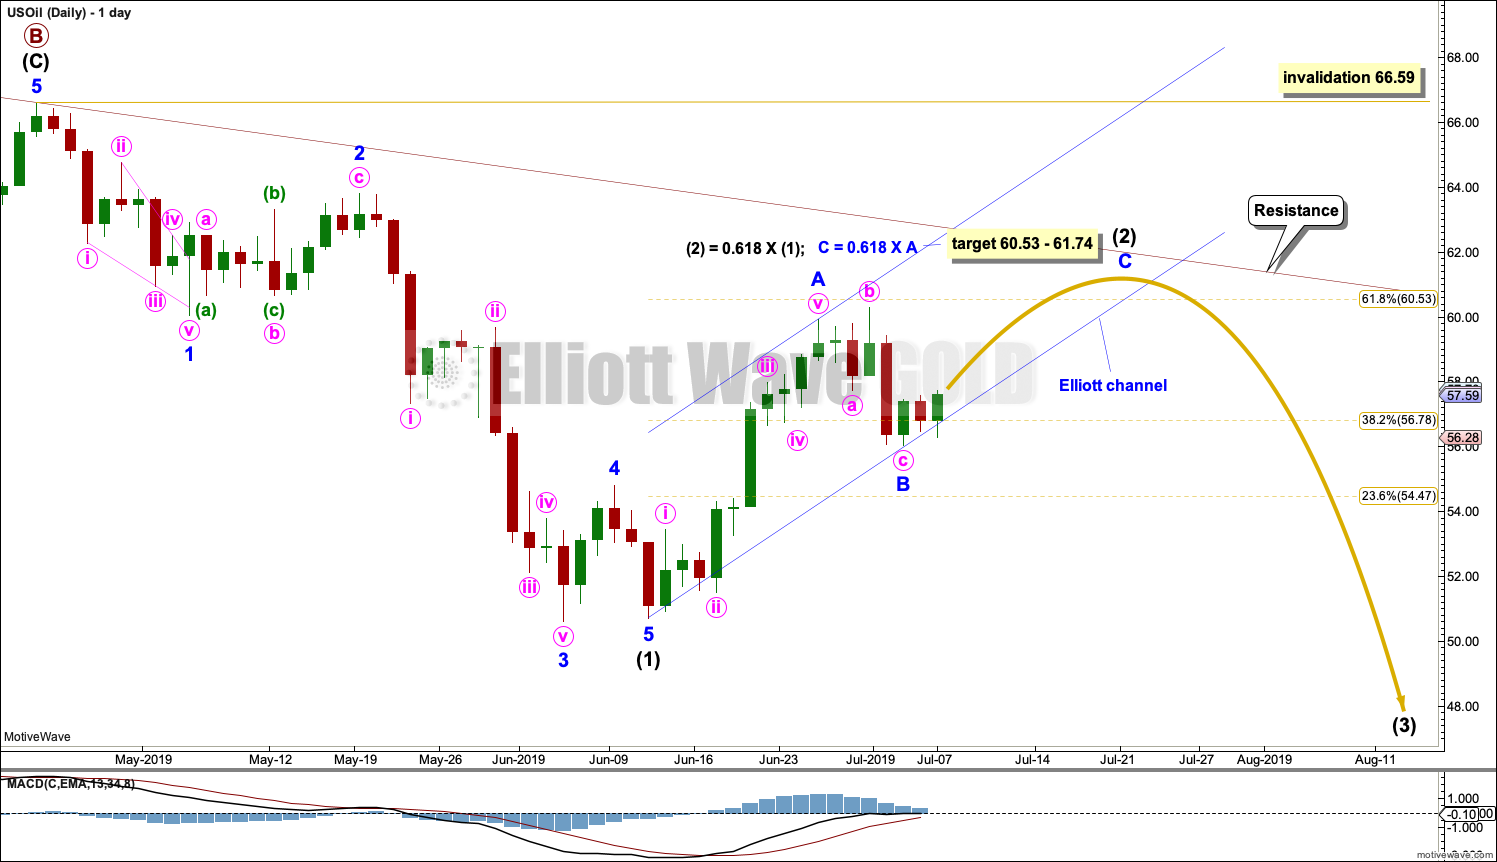
Note that monthly and weekly charts are on a semi-log scale, but this daily chart is on an arithmetic scale. This makes a slight difference to trend channels.
It is possible that intermediate wave (1) is complete. Minor wave 4 for this wave count exhibits some alternation to minor wave 2; minor wave 2 may be a relatively deep zigzag or flat, and minor wave 4 may be a more shallow zigzag.
Minor wave 5 ends with a slight 0.11 truncation.
Intermediate wave (2) would most likely unfold as a zigzag and may end either about the 0.618 Fibonacci ratio of intermediate wave (1) or about the upper edge of the maroon Elliott channel. Intermediate wave (2) may continue for another week or possibly two.
Intermediate wave (2) may not move beyond the start of intermediate wave (1) above 66.59.
Within the zigzag of intermediate wave (2), minor wave A may now be a complete five wave impulse and minor wave B may be a complete expanded flat. If minor wave A is correctly labelled as a five and if minor wave B continues lower, then minor wave B may not move beyond the start of minor wave A, below 50.72.
The target zone may see intermediate wave (2) come up to resistance at the upper edge of the channel.
TECHNICAL ANALYSIS
MONTHLY CHART
Click chart to enlarge. Chart courtesy of StockCharts.com.
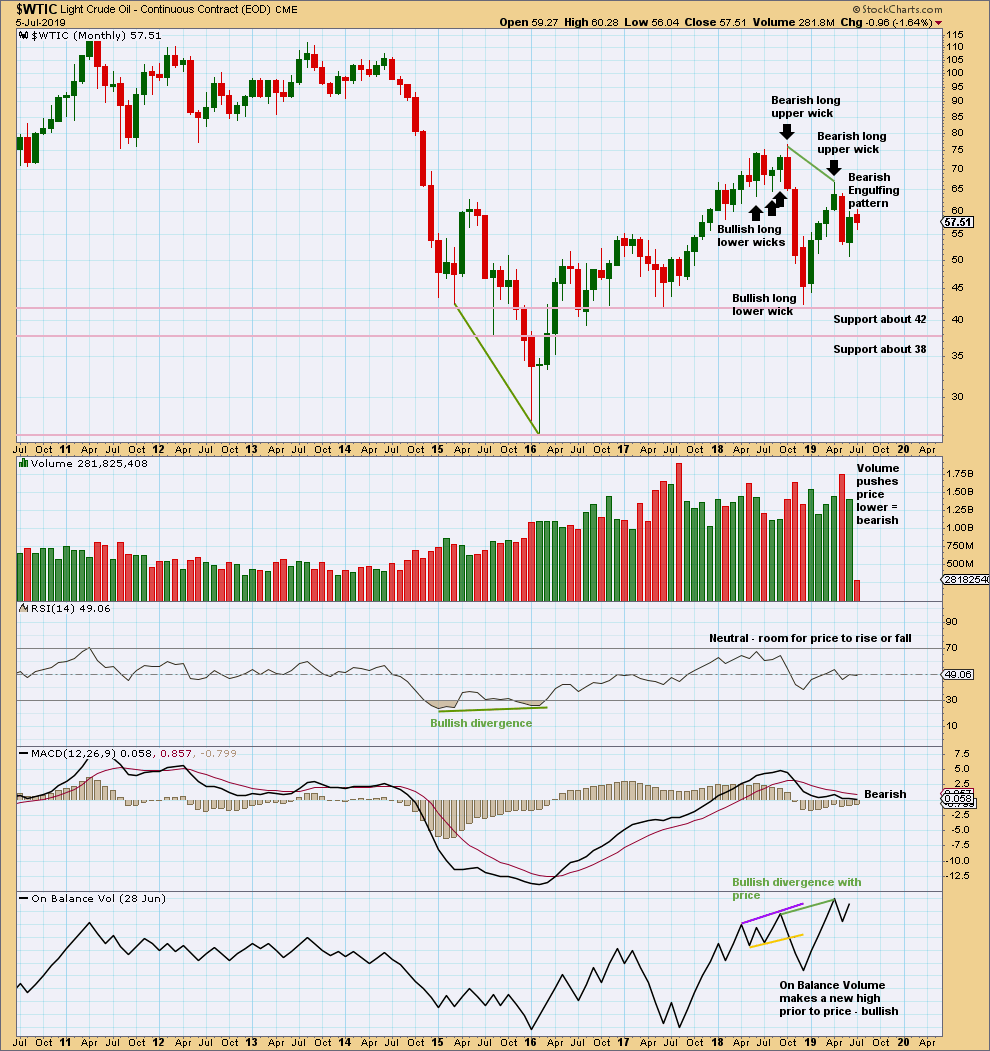
May has closed with a strong Bearish Engulfing candlestick pattern, which has strong support from volume. This supports the Elliott wave count.
June moved price lower with a lower low and a lower high, but the candlestick closed green and the balance of volume was upwards. Upwards movement within the month did not have support from volume. This also supports the Elliott wave count.
WEEKLY CHART
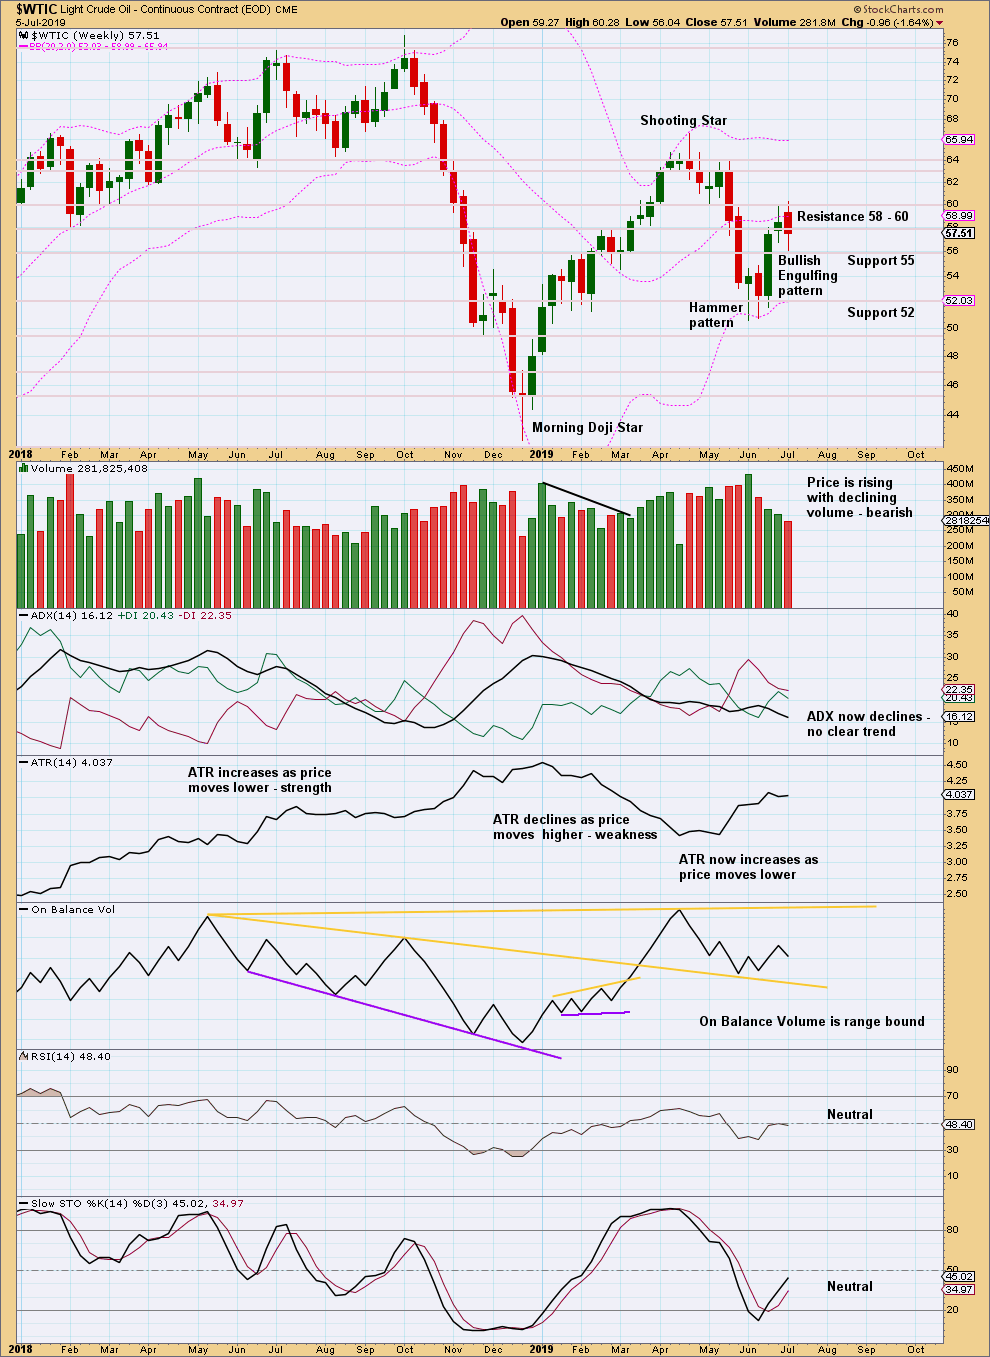
Click chart to enlarge. Chart courtesy of StockCharts.com.
An outside week closes red with the balance of volume downwards. Volume during the week did not push price lower.
DAILY CHART
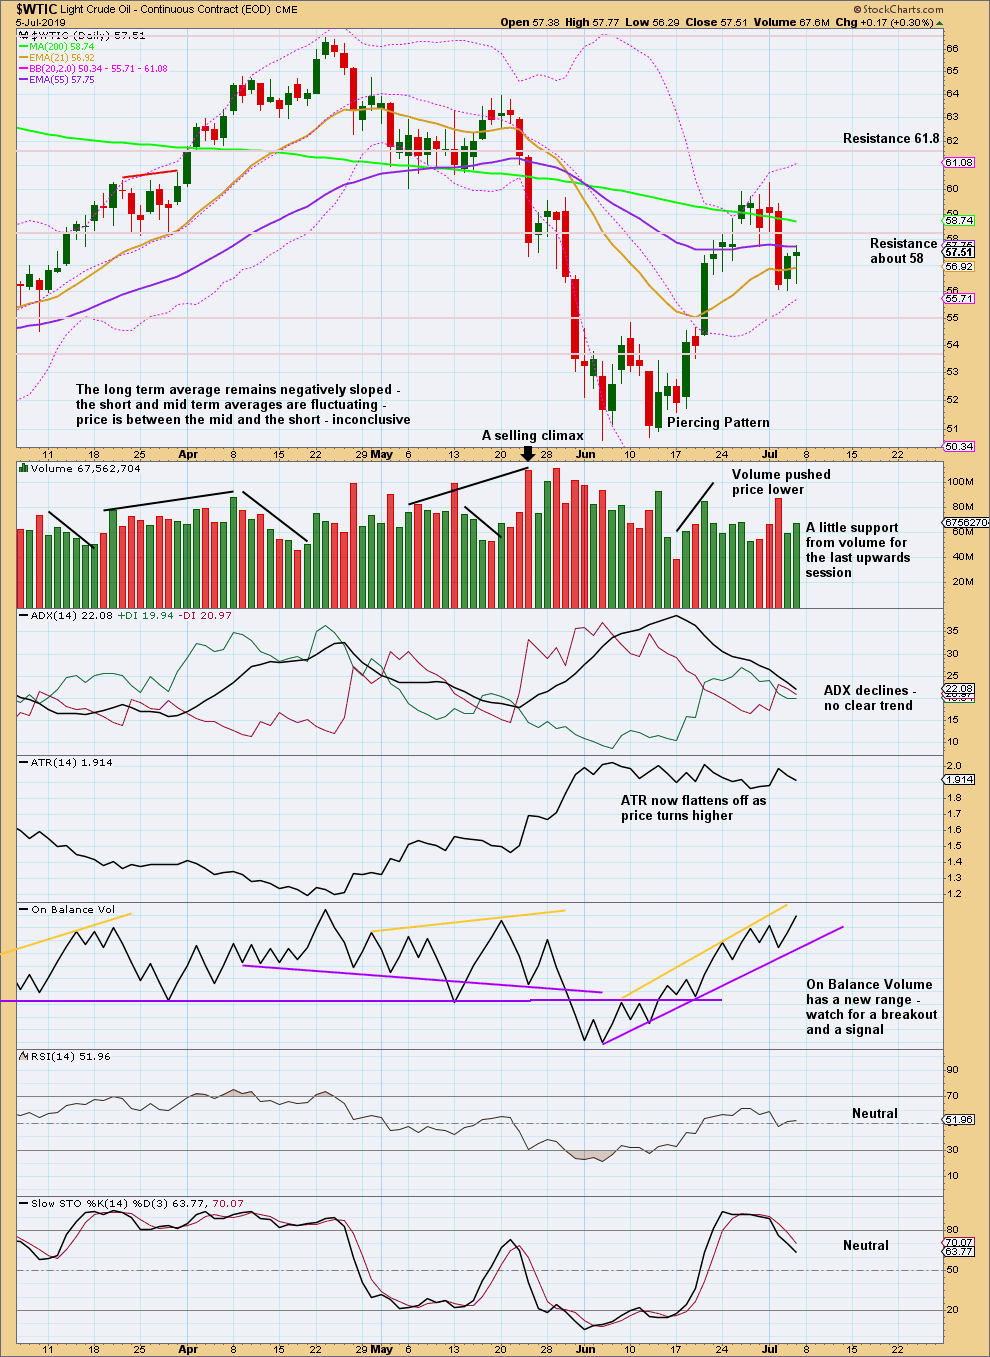
Click chart to enlarge. Chart courtesy of StockCharts.com.
For the bounce up to the last high volume and ATR declined, suggesting the movement was a counter trend movement.
Now price has pulled back with a little push from volume. It is possible the bounce could be over.
For the very short term, a little support from volume for upwards movement within Friday’s session suggests more upwards movement to begin next week.
Published @ 10:02 p.m. EST.
—
Careful risk management protects your trading account(s).
Follow my two Golden Rules:
1. Always trade with stops.
2. Risk only 1-5% of equity on any one trade.
—
New updates to this analysis are in bold.