
Again, downwards movement was expected for Oil. An outside week closes green, and price remains below resistance.
Summary: A mid-term target is at 35.25 for a third wave down. This may exhibit an increase in momentum, and may end with a capitulation spike.
The final target is calculated at 10.72. Confidence in this target may be had if price makes a new low below 50.61.
For the short term, a new high now above 58.82, and then above the channel on the main daily chart, would indicate a deeper bounce. The target would then be at 74.75.
The bullish alternate wave count would have confidence above 76.90. At that stage, a target for a third wave to end would be at 89.80.
MAIN ELLIOTT WAVE COUNT – BEARISH
MONTHLY CHART
Click chart to enlarge.
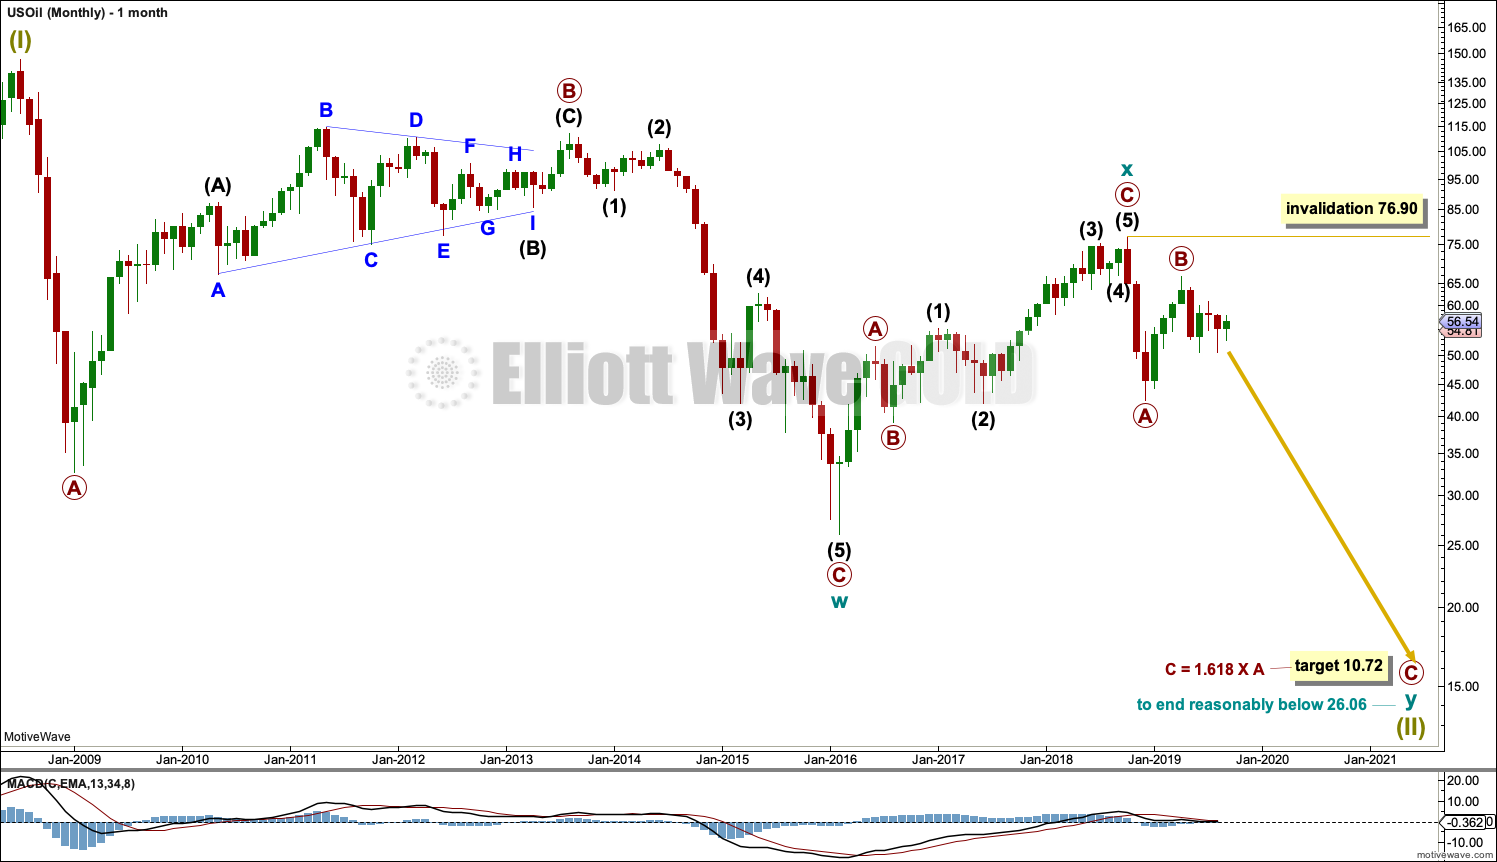
The basic Elliott wave structure is five steps forward and three steps back. This Elliott wave count expects that US Oil is still within a three steps back pattern, which began in July 2008. The Elliott wave count expects that the bear market for US Oil continues.
This Elliott wave corrective structure is a double zigzag, which is a fairly common structure. The correction is labelled Super Cycle wave (II).
The first zigzag in the double is complete and labelled cycle wave y. The double is joined by a three in the opposite direction labelled cycle wave x, which subdivides as a zigzag. The second zigzag in the double may now have begun, labelled cycle wave w.
The purpose of a second zigzag in a double zigzag is to deepen the correction when the first zigzag does not move price deep enough. To achieve this purpose cycle wave y may be expected to move reasonably below the end of cycle wave w at 26.06. The target calculated would see this expectation met.
Cycle wave y is expected to subdivide as a zigzag, which subdivides 5-3-5.
Cycle wave w lasted 7.6 years and cycle wave x lasted 2.7 years. Cycle wave y may be expected to last possibly about a Fibonacci 5 or 8 years.
If it continues higher, then primary wave B may not move beyond the start of primary wave A above 76.90.
WEEKLY CHART
Click chart to enlarge.
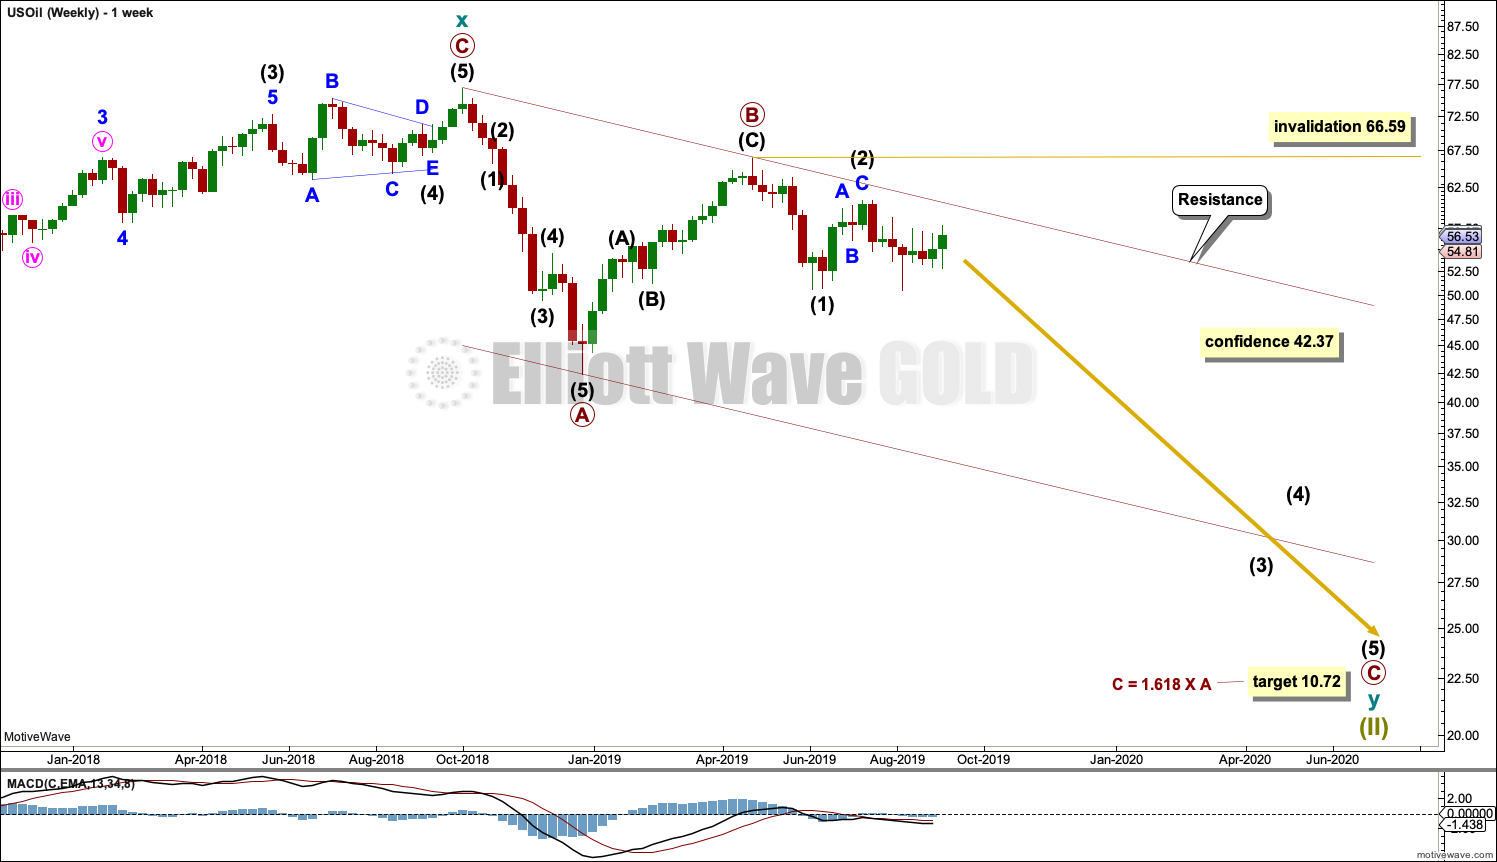
This weekly chart shows all of cycle waves x and y so far.
Cycle wave y is expected to subdivide as a zigzag. A zigzag subdivides 5-3-5. Primary wave A must subdivide as a five wave structure if this wave count is correct.
Primary wave A may be a complete five wave impulse at the last low.
Primary wave B may now be a complete single zigzag at the last high.
Primary wave C may have just begun. Primary wave C must subdivide as a five wave structure.
Primary wave A lasted 12 weeks, just one short of a Fibonacci 13.
Primary wave C may be longer in time as well as price. If cycle wave y lasts a Fibonacci 5 years, then primary wave C within it may take as long as a Fibonacci 233 weeks.
Intermediate wave (1) within primary wave C may be a complete impulse. Intermediate wave (2) may not move beyond the start of intermediate wave (1) above 66.59.
Draw a channel about the zigzag of primary wave y using Elliott’s technique for a correction. Draw the first trend line from the start of primary wave A to the end of primary wave B, then place a parallel copy on the end of primary wave A. The upper edge of this channel is so far showing where bounces along the way down find resistance. The lower edge of the channel may provide support. If this channel is breached by upwards movement prior to a new high above 66.59, then this wave count would be discarded in favour of the second bearish wave count below.
DAILY CHART
Click chart to enlarge.
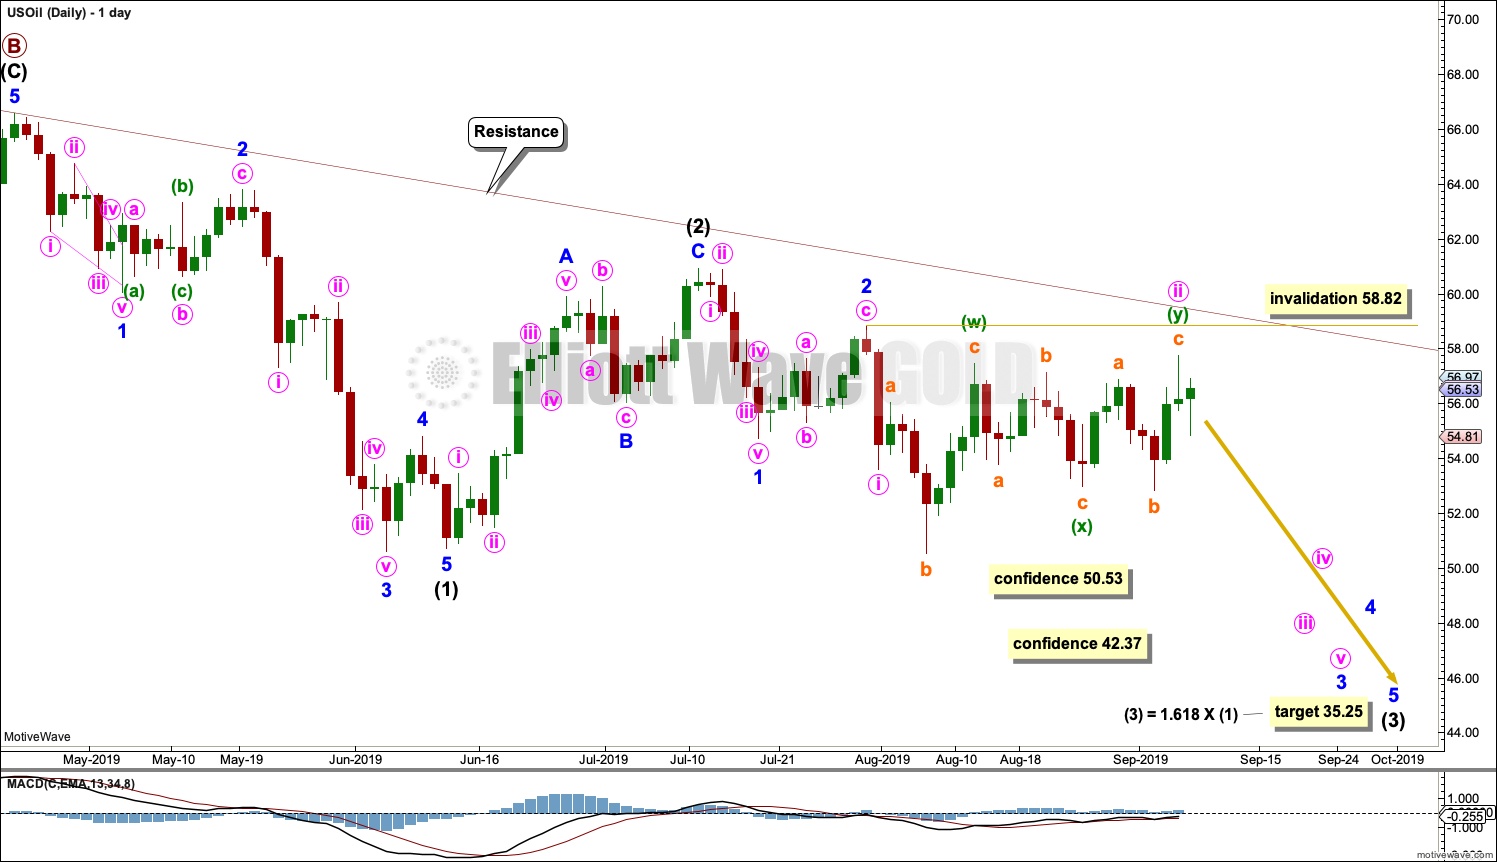
Note that monthly and weekly charts are on a semi-log scale, but this daily chart is on an arithmetic scale. This makes a slight difference to trend channels.
Intermediate wave (1) looks complete. Minor wave 4 for this wave count exhibits some alternation to minor wave 2; minor wave 2 may be a relatively deep zigzag or flat, and minor wave 4 may be a more shallow zigzag.
Minor wave 5 ends with a slight 0.11 truncation. All Elliott wave counts must now accept this small truncation.
Intermediate wave (2) may also now be complete as a zigzag.
Intermediate wave (3) may only subdivide as an impulse, and it must move below the end of intermediate wave (1). Within intermediate wave (3), minor waves 1 and 2 may now be complete.
Minor wave 3 may only subdivide as an impulse. Within minor wave 3, minute waves i and ii may now be complete. Minute wave ii may have continued sideways this week as a double flat correction. If it continues any further, then minute wave ii may not move beyond the start of minute wave i above 58.82.
Minute wave iii may only subdivide as an impulse.
The next downwards wave for this wave count is now expected to be a third wave at three degrees. It may be expected to exhibit an increase in momentum and an increase in ATR. So far it has support from volume pushing price lower.
Oil, typical of commodities, exhibits swift and strong fifth waves. This tendency is especially prevalent in its fifth waves to end third wave impulses one degree higher. Its third waves often begin relatively slowly, build momentum through their middles, and then explode at the end. Intermediate wave (3) here may be beginning slowly and that would be typical behaviour for this market.
SECOND WEEKLY CHART
Click chart to enlarge.
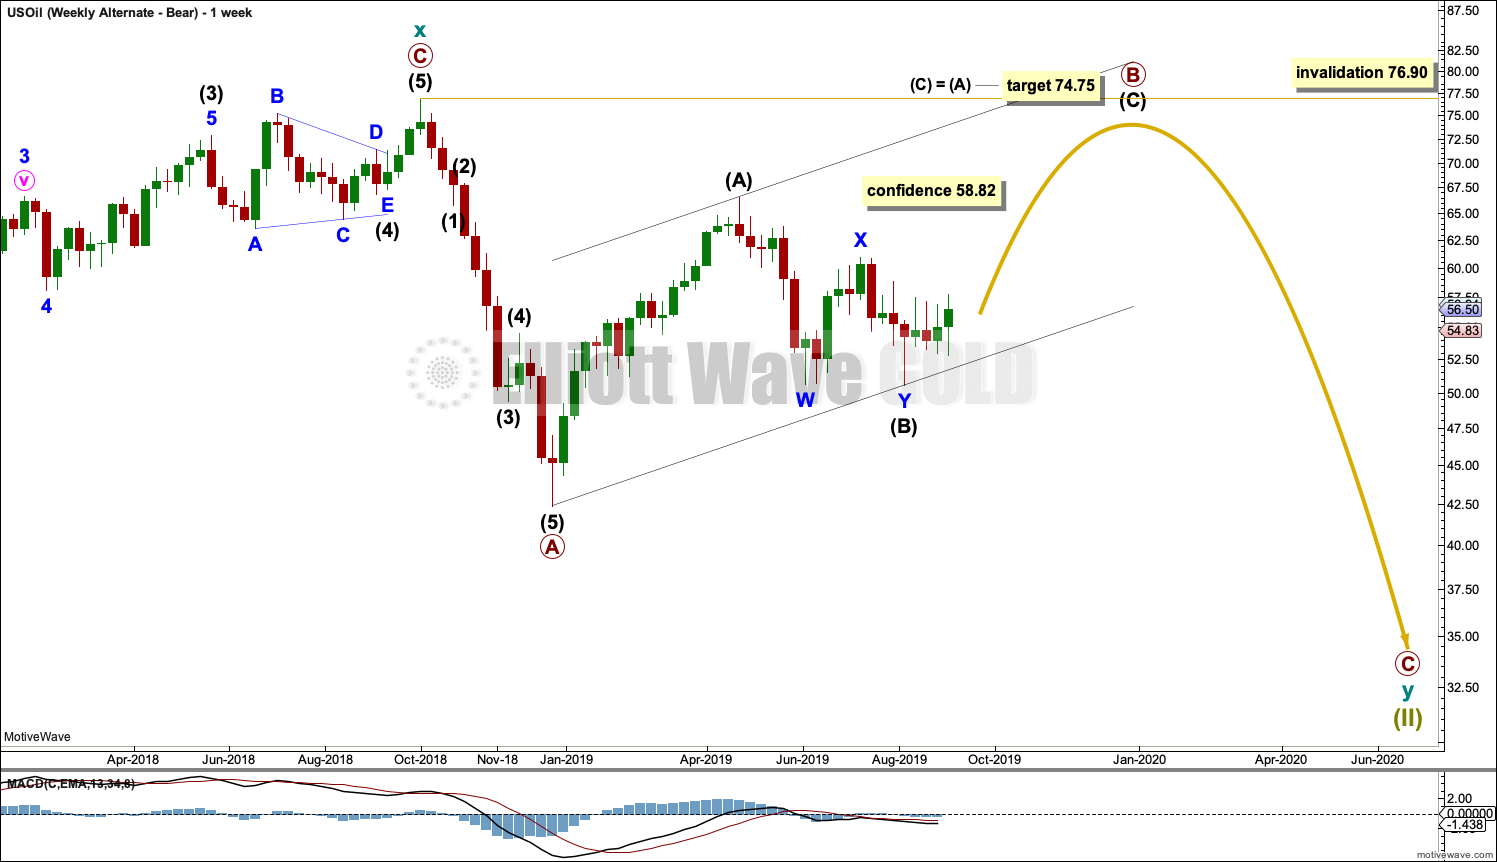
This wave count considers the possibility that primary wave B within the zigzag of cycle wave y may be incomplete. This wave count should only be used if price makes a new high by any amount at any time frame above 58.82.
Primary wave B may not move beyond the start of primary wave A above 76.90.
SECOND DAILY CHART
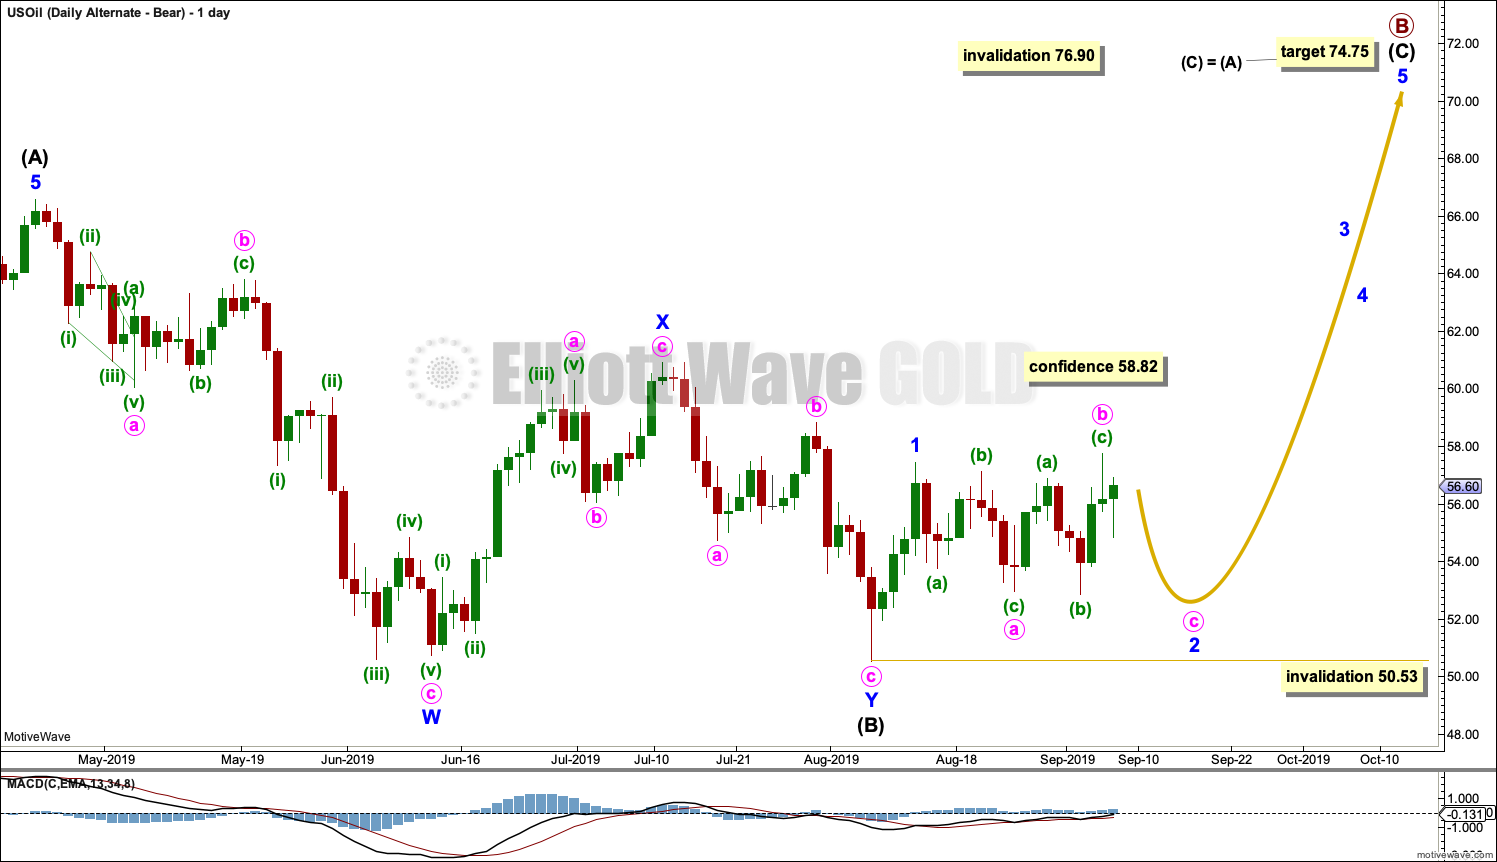
Click chart to enlarge.
Intermediate wave (B) will only fit as a double zigzag. This is possible, but minor wave Y of the double zigzag has barely achieved its purpose to move the correction deeper as it only moves very slightly below the end of minor wave W.
Intermediate wave (C) must subdivide as a five wave motive structure, either an impulse or an ending diagonal. It should move beyond the end of intermediate wave (A) to avoid a truncation.
So far minor wave 1 within intermediate wave (C) may be complete. Minor wave 2 may be completing as an expanded flat correction. Minor wave 2 may not move beyond the start of minor wave 1 below 50.53.
ALTERNATE ELLIOTT WAVE COUNT
MONTHLY CHART
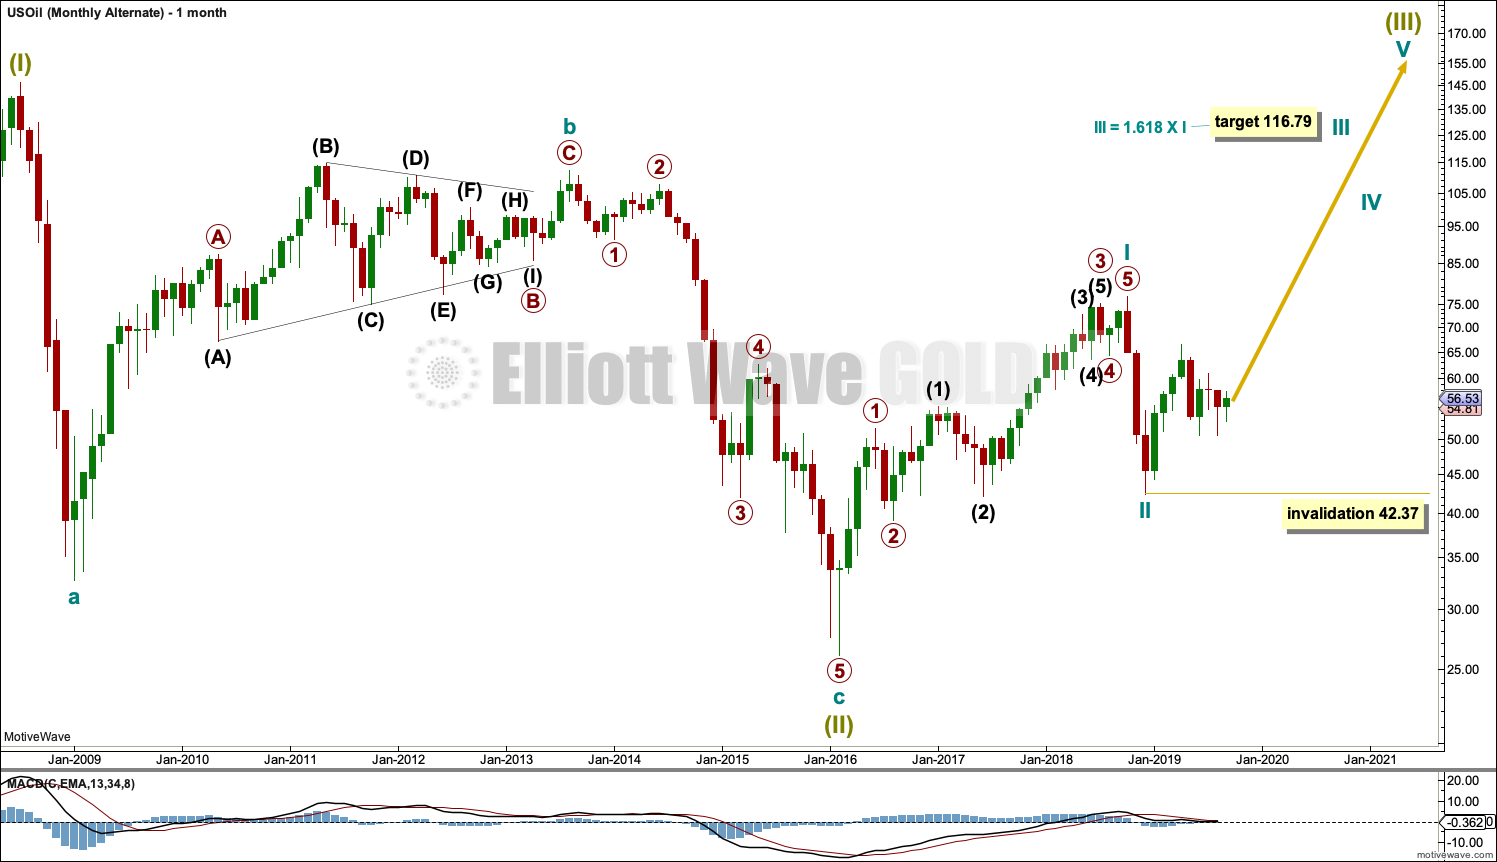
Click chart to enlarge.
It is possible that the bear market is over for Oil and a new bull market has begun.
For a bullish wave count for Oil, the upwards wave from the major low at 26.06 in February 2016 must be seen as a complete five wave impulse. This is labelled cycle wave I.
Cycle wave II may be a complete zigzag at 0.679 the depth of cycle wave I.
A target is calculated for cycle wave III to reach a common Fibonacci ratio to cycle wave I.
Within cycle wave III, no second wave correction may move beyond the start of its first wave below 42.37.
WEEKLY CHART
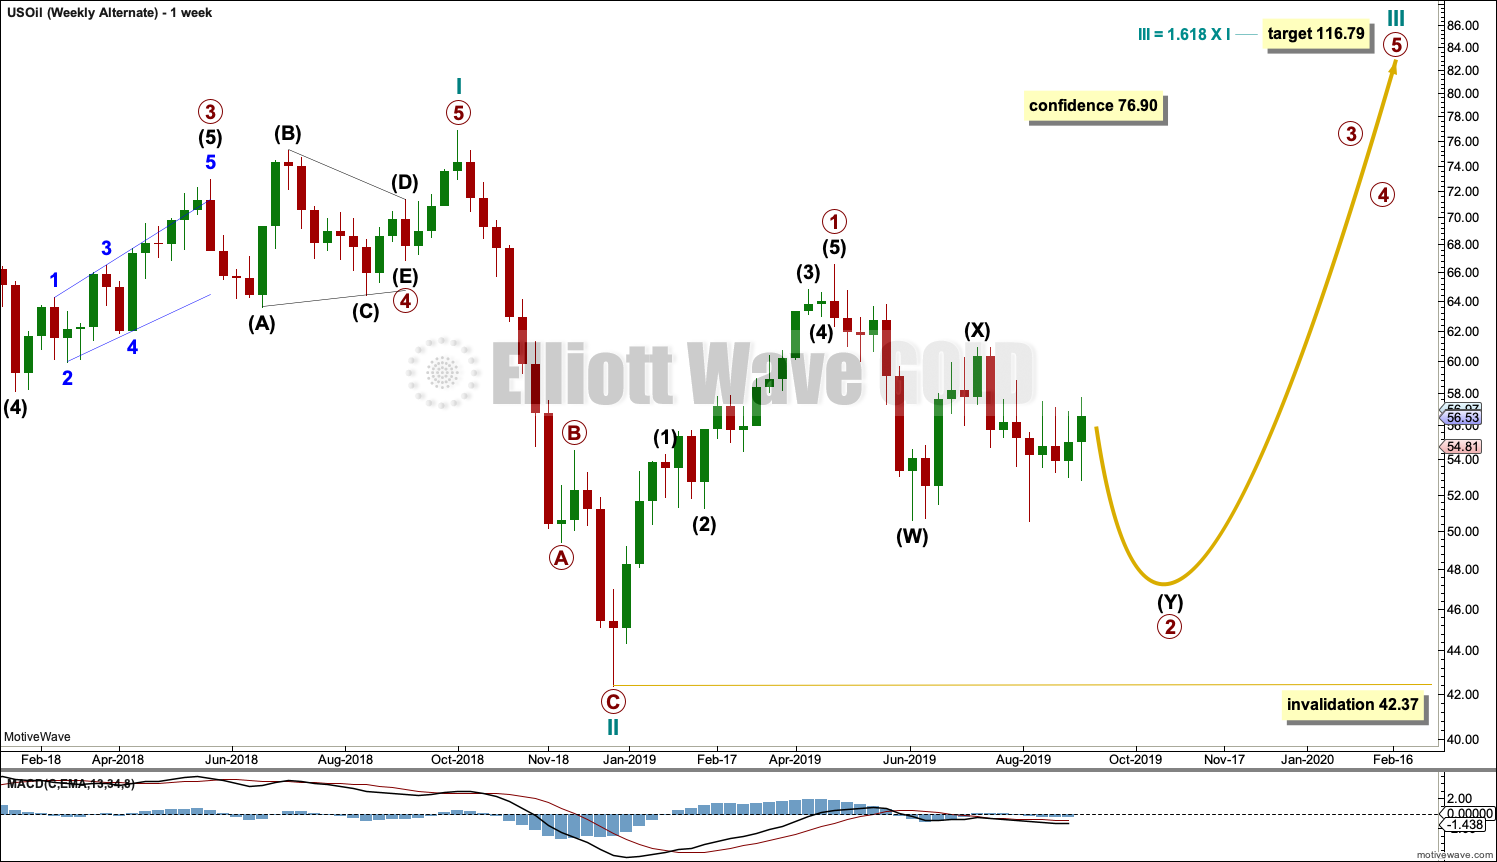
Click chart to enlarge.
This weekly chart shows detail of cycle wave I as a five wave impulse.
Cycle wave II does look best as a three. This is the only part of this wave count that has a better look than the main wave count, which sees this downwards wave as a five.
The upwards wave of primary wave 1 within cycle wave III must be seen as a five wave structure for a bullish wave count to work. This movement at lower time frames does not subdivide well at all as a five; this reduces the probability of this wave count.
Cycle wave III may only subdivide as an impulse. Within cycle wave III, so far primary wave 1 may be complete. Primary wave 2 may be moving lower as a double zigzag. Primary wave 2 may not move beyond the start of primary wave 1 below 42.37.
DAILY CHART
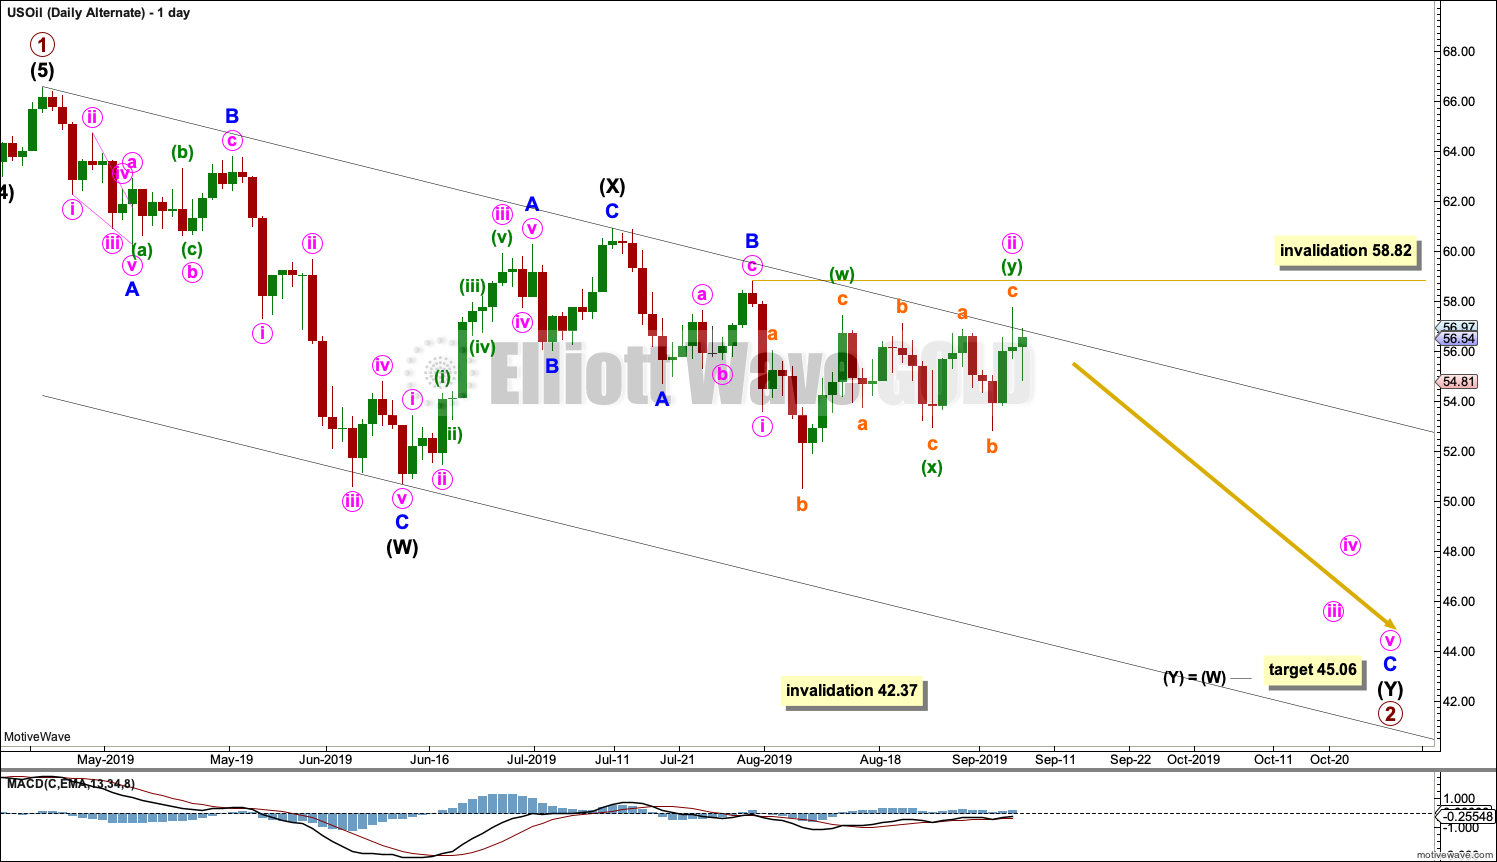
Click chart to enlarge.
Primary wave 2 may be continuing lower as a double zigzag.
The first zigzag in the double would be complete, labelled intermediate wave (W). Within intermediate wave (W), minor wave C ends with a slight truncation for minute wave v. This is acceptable.
The double may be now joined by a complete three in the opposite direction, a zigzag labelled intermediate wave (X).
A second zigzag may now unfold labelled intermediate wave (Y). Within intermediate wave (Y), minor waves A and B may be complete. Minor wave C must now complete lower as a five wave structure. Within minor wave C, minute waves i and ii may now be complete. Minute wave ii may have continued sideways this week as a double flat correction. If it continued any higher, minute wave ii may not move beyond the start of minute wave i above 58.82.
Minute wave iii may only subdivide as an impulse.
TECHNICAL ANALYSIS
MONTHLY CHART

Click chart to enlarge. Chart courtesy of StockCharts.com.
August has closed with a long lower wick, which is bullish, but price has moved lower with push from volume, which is bearish.
Overall, August is judged to be more bearish than bullish.
There is now double bullish divergence between price and On Balance Volume. This supports the alternate Elliott wave count.
WEEKLY CHART
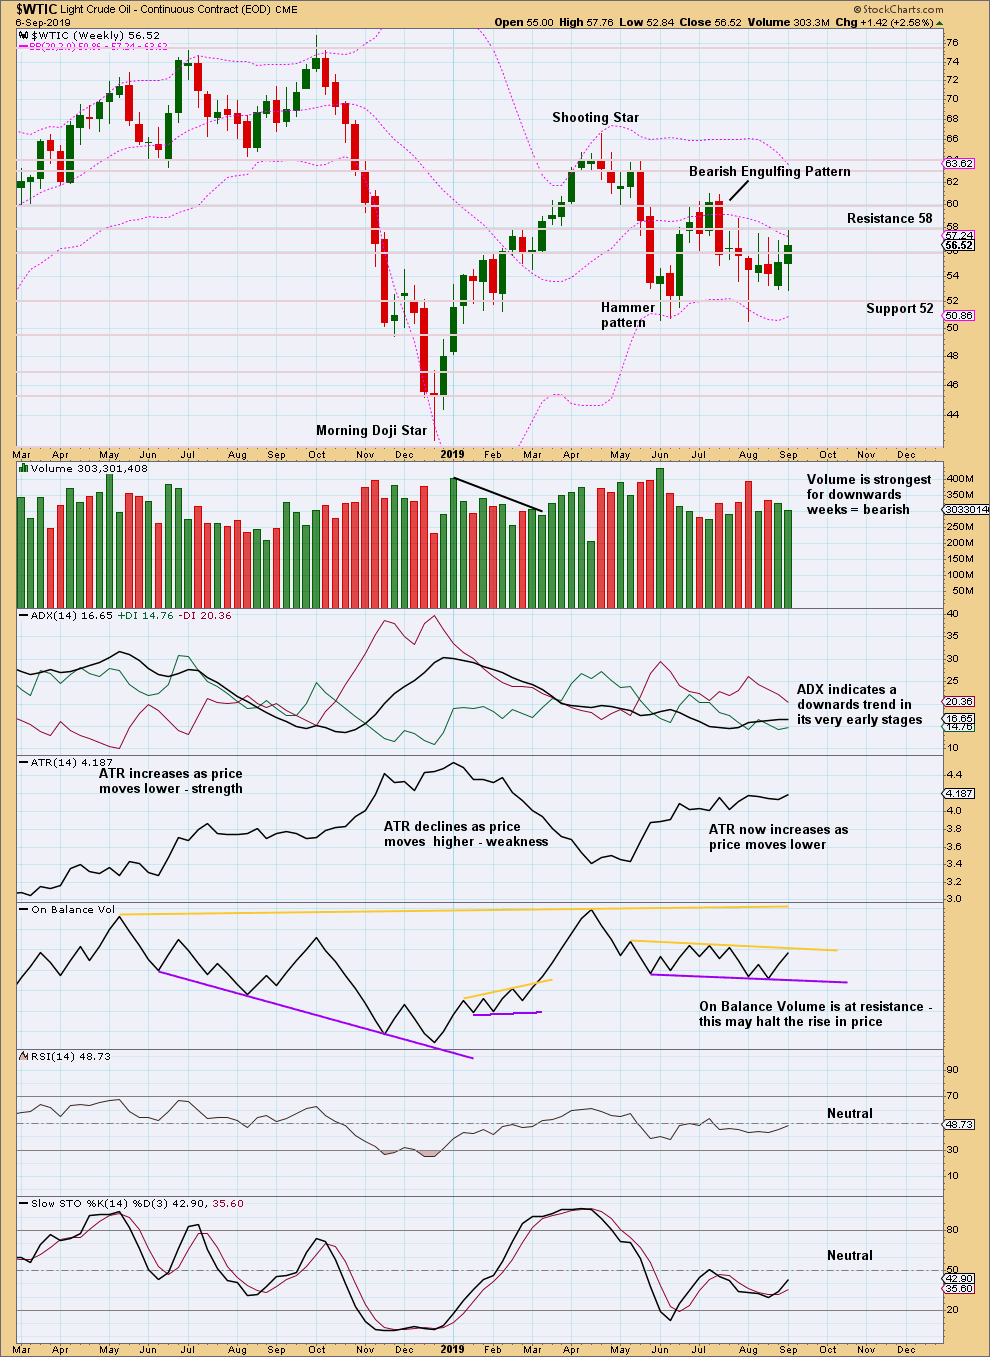
Click chart to enlarge. Chart courtesy of StockCharts.com.
This outside week has both long lower and upper wicks, with the lower wick slightly longer. The difference is not great enough to draw a strong bullish conclusion. Overall, this chart remains mostly bearish.
Price currently remains range bound with resistance about 58 and support about 52. A breakout is required to indicate the next direction.
There is again a downwards trend in place. ADX is giving the strongest signal it can give.
DAILY CHART
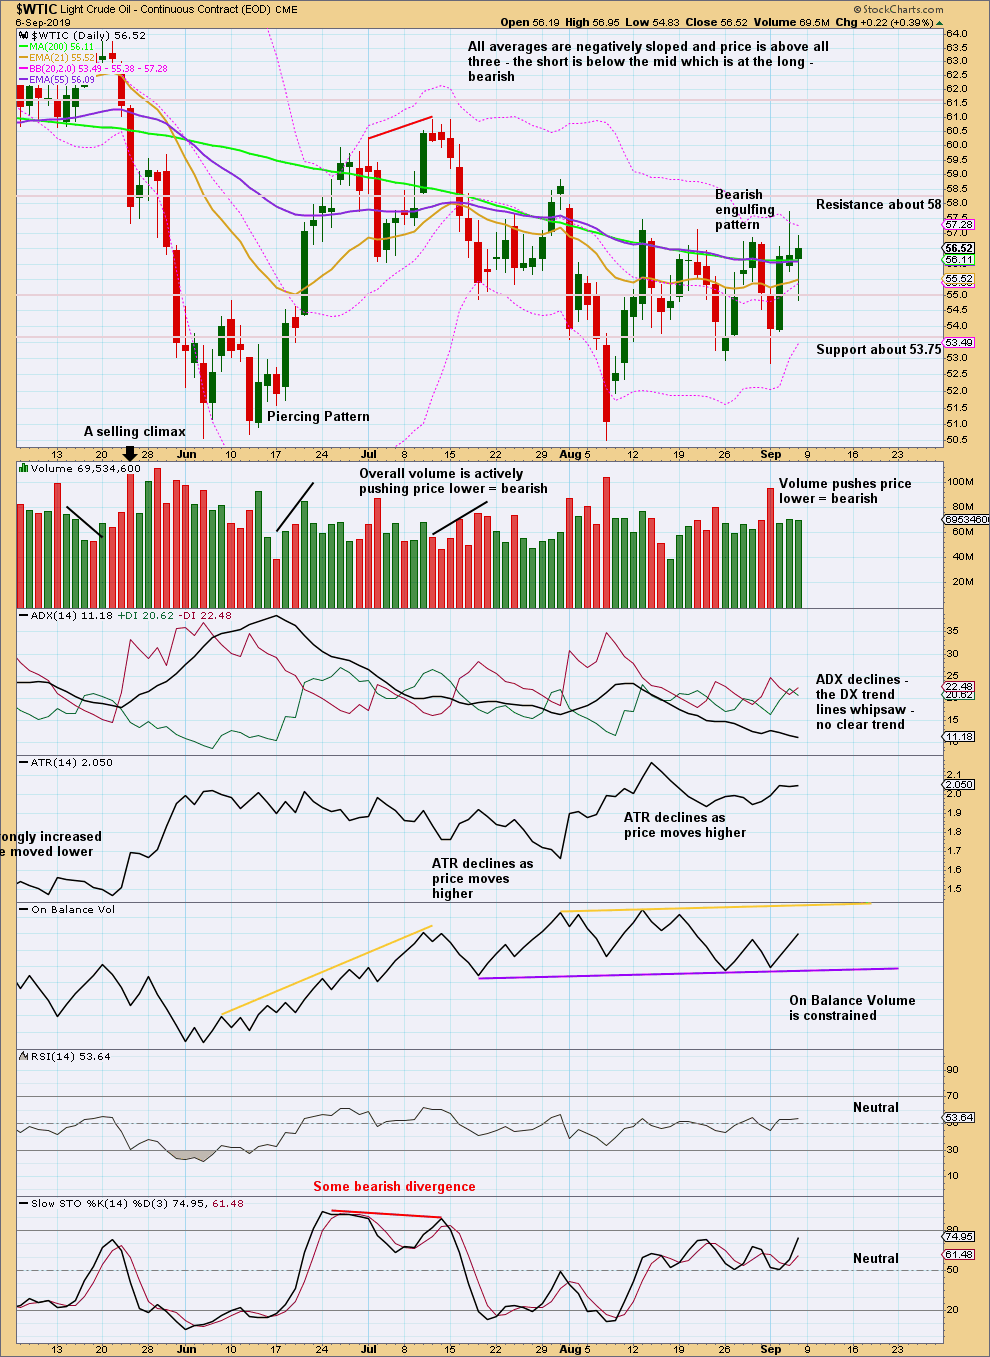
Click chart to enlarge. Chart courtesy of StockCharts.com.
Price is range bound with resistance about 58 and support about 53.75 to 52. A breakout from this consolidation is required for confidence in a trend.
Published @ 10:30 p.m. EST.
—
Careful risk management protects your trading account(s).
Follow my two Golden Rules:
1. Always trade with stops.
2. Risk only 1-5% of equity on any one trade.
—
New updates to this analysis are in bold.