
Lara’s Weekly: Elliott Wave and Technical Analysis of S&P500 and Gold and US Oil | Charts – April 3, 2020

S&P 500
Another small range day fits expectations for price to consolidate this week.
Summary: A correction may continue into next week. It may be shallow if it continues to find resistance at the lower edge of the multi-year channel. A target for it to end is about 2,651.
Thereafter, the downwards trend may resume with strength.
Alternatively, it is possible that the correction is over although this has a lower probability.
The biggest picture, Grand Super Cycle analysis, is here.
Last monthly charts are here. Video is here. Members are encouraged to view all three monthly charts. The third is much more bearish than this main wave count and remains a valid possibility.
ELLIOTT WAVE COUNTS
WEEKLY CHART
Click chart to enlarge.
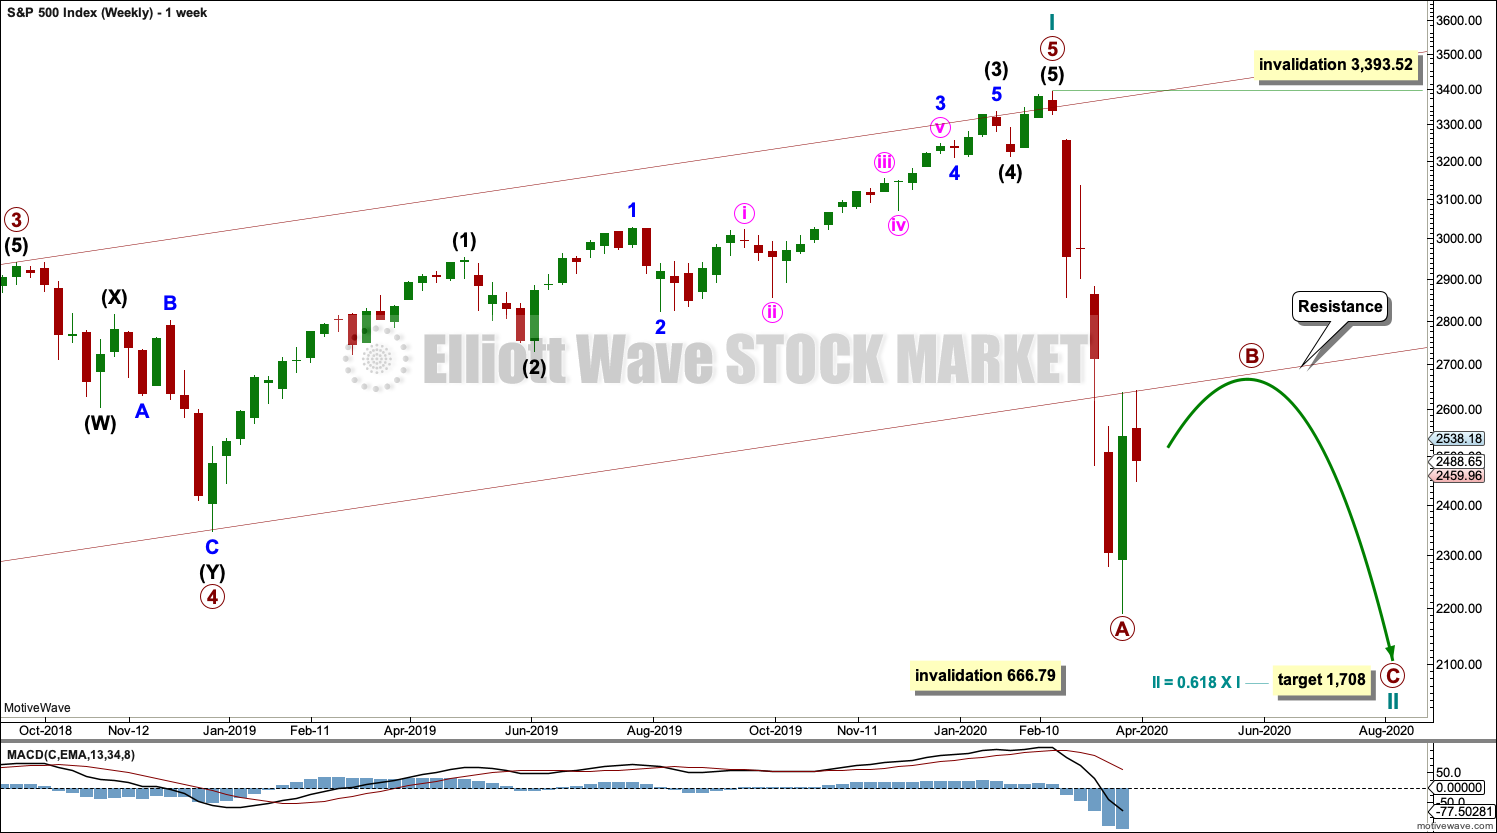
The channel is now breached by a full weekly candlestick below and not touching the lower edge. Further confidence in this wave count may be had. The lower edge of this channel is continuing so far to provide resistance.
Price is now below the 0.382 Fibonacci ratio of cycle wave I at 2,352. The structure of cycle wave II may need further to go to complete. The next Fibonacci ratio at 0.618 is now a preferred target for cycle wave II to end.
Cycle wave II would most likely subdivide as a zigzag; thus far that looks like what it is unfolding. When primary waves A and B may both be complete, then the target may be calculated using a Fibonacci ratio between primary waves A and C. At that stage, the final target may change or widen to a zone.
Cycle wave II may not move beyond the start of cycle wave I below 666.79.
DAILY CHART
Click chart to enlarge.
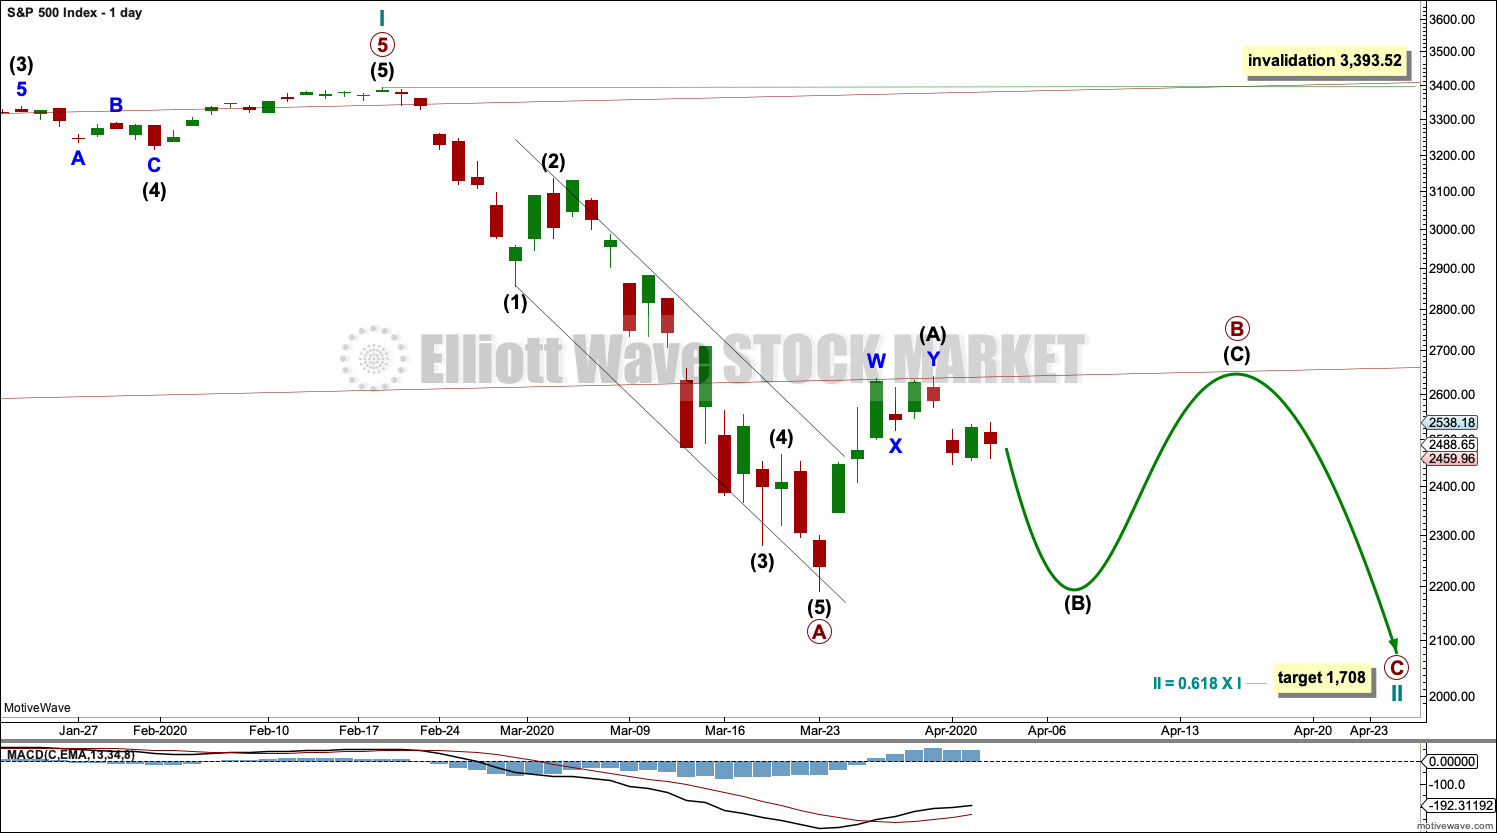
Draw the wide maroon trend channel carefully: draw the first trend line from the end of primary wave 1 at 2,093.55 (December 26, 2014), to the end of primary wave 3 at 2,940.91 (September 21, 2018), then place a parallel copy on the end of primary wave 2 at 1,810.10 (February 11, 2016). The channel is fully breached indicating a trend change from the multi-year bull trend to a new bear trend. The lower edge may now be an important line of resistance. If resistance at this line holds, then primary wave B may end close to the 0.382 Fibonacci ratio of primary wave A at 2,651.
Cycle wave II may subdivide as any Elliott wave corrective structure except a triangle. It would most likely be a zigzag. Primary wave A may be a complete five wave impulse. Primary wave B may not move beyond the start of primary wave A above 3,393.52.
ALTERNATE DAILY CHART
Click chart to enlarge.
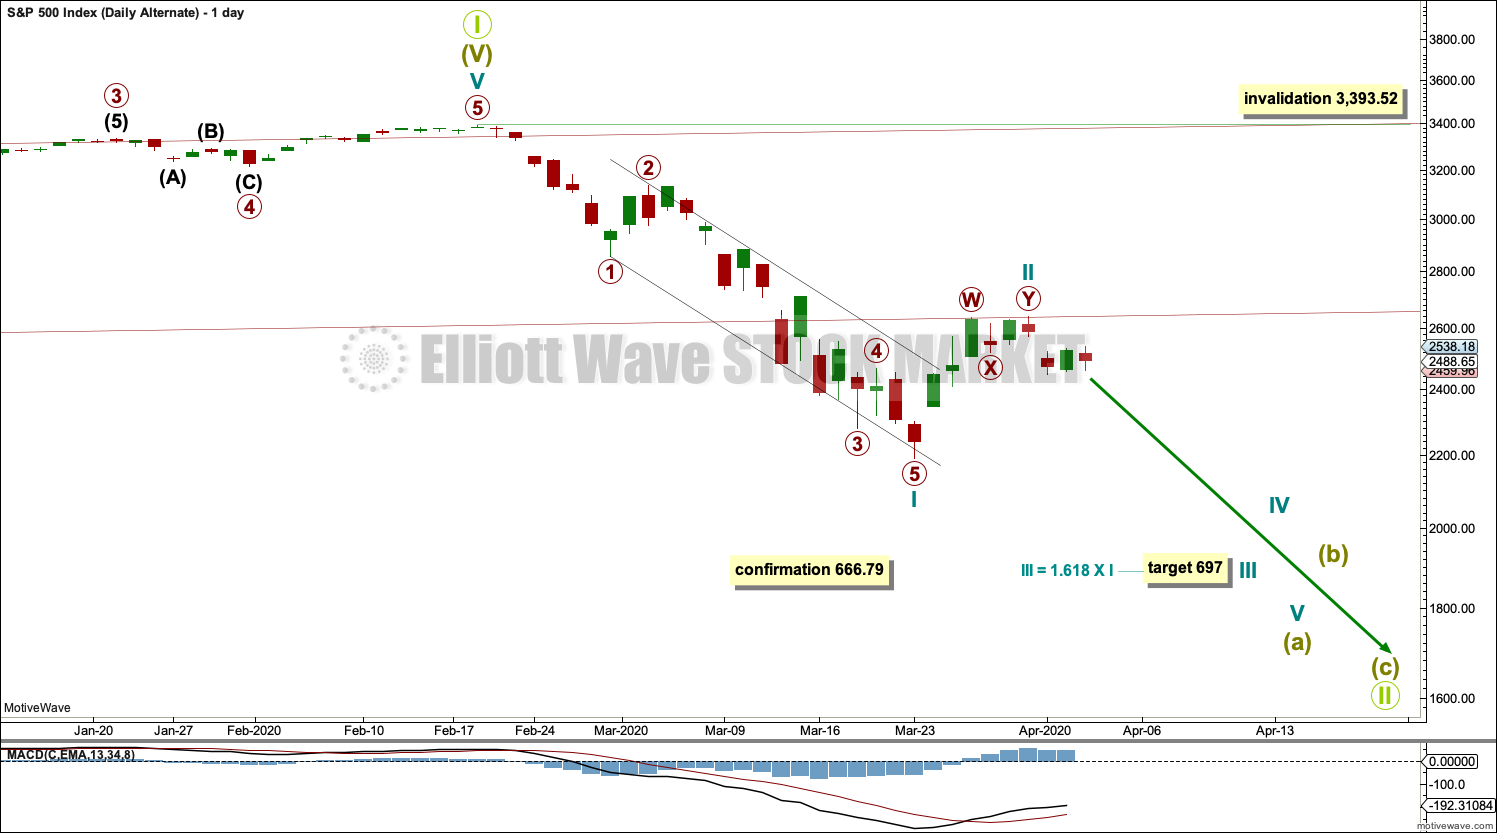
This alternate daily chart follows the Second Alternate Monthly chart published here. Video is here.
By simply moving the degree of labelling in the bull market beginning March 2009 up one degree, it is possible that a Grand Super Cycle trend change occurred on the February 19, 2020.
A correction at Grand Super Cycle degree may be expected to last at least a decade, possibly longer. Corrections for this market tend to be much quicker than bullish moves, and so a fair amount of flexibility is required in expectations for duration of the different degrees.
Grand Super Cycle II would most likely subdivide as a zigzag, although it may be any corrective structure except a triangle. It should begin with a five down at the weekly chart time frame, which would be incomplete.
The first five down on the daily chart is labelled cycle wave I. If this degree of labelling is wrong, it may be too high; it may need to be moved down one degree.
Following cycle wave I, cycle wave II may be complete as a relatively brief and shallow double zigzag. If it continues further as a flat correction, then cycle wave II may not move beyond the start of cycle wave I above 3,393.52.
A target is calculated for cycle wave III to end based upon a common Fibonacci ratio to cycle wave I.
TECHNICAL ANALYSIS
MONTHLY CHART
Click chart to enlarge. Chart courtesy of StockCharts.com.
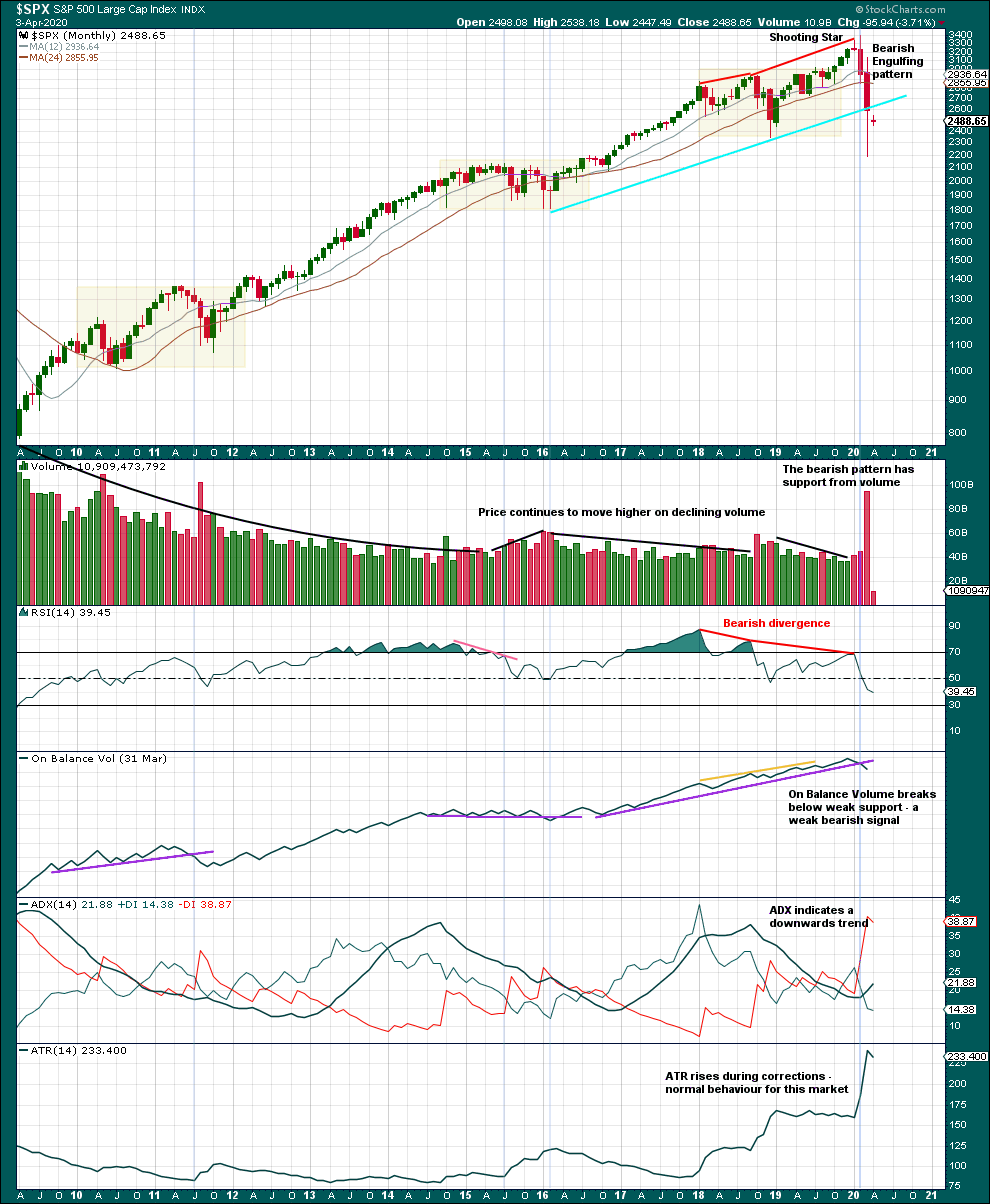
Volume for March 2020 is the highest since August 2011.
With declining volume overall since the beginning of the bull market in March 2009, support below here may be thin and weak. This may allow price to fall faster. The breach of the blue trend line is significant. The long lower wick for the candlestick of March 2020 is bullish, so look for a bounce.
WEEKLY CHART
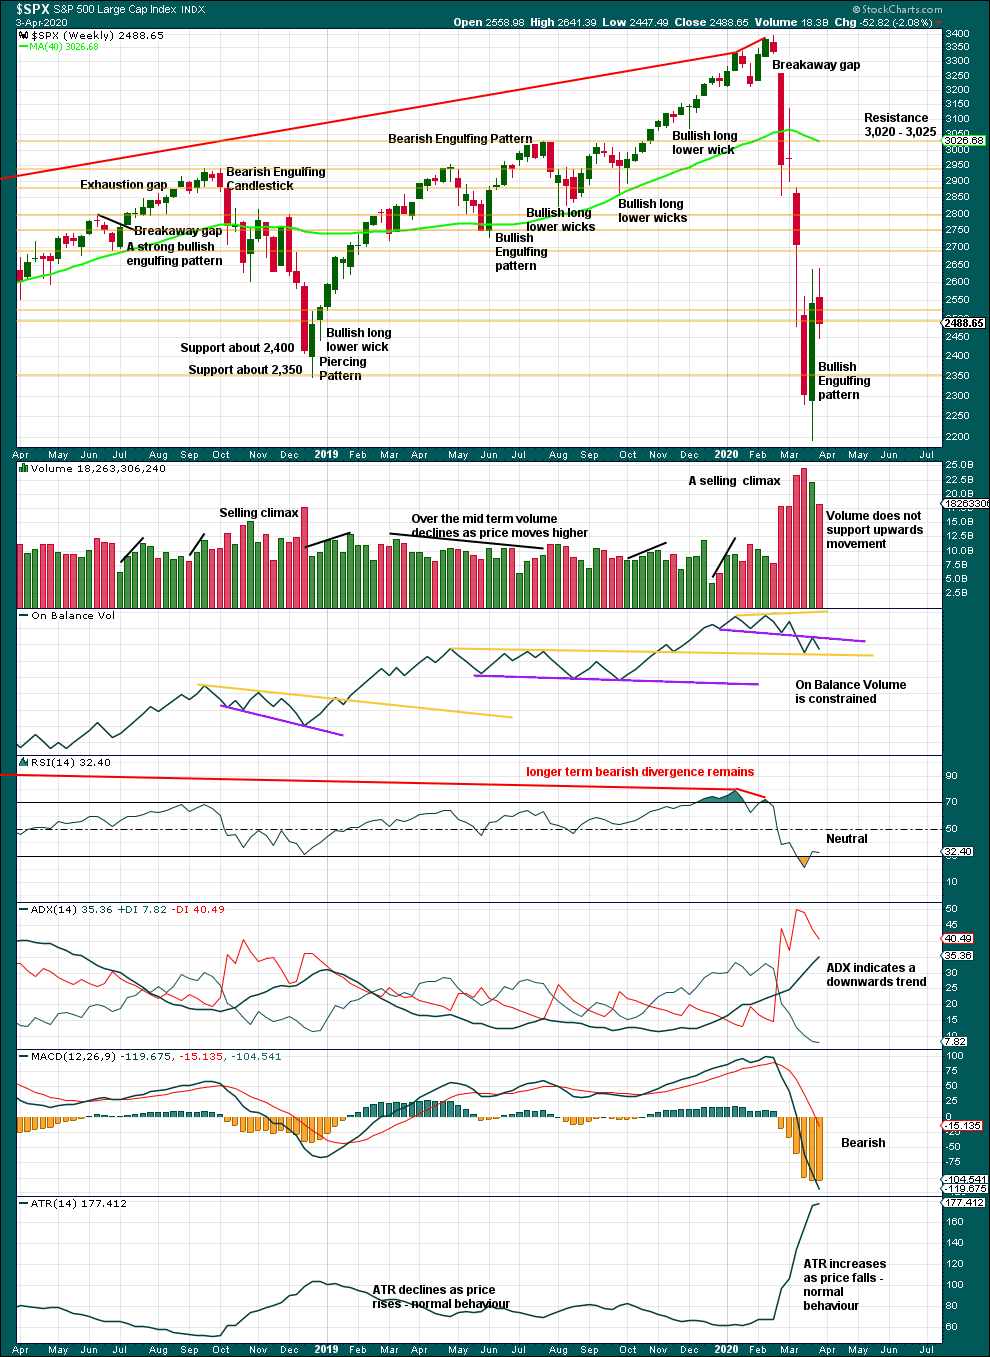
Click chart to enlarge. Chart courtesy of StockCharts.com.
The bounce has relieved RSI somewhat. ADX is still not extreme; there is room for this trend to continue. Watch On Balance Volume carefully for a breakout.
DAILY CHART
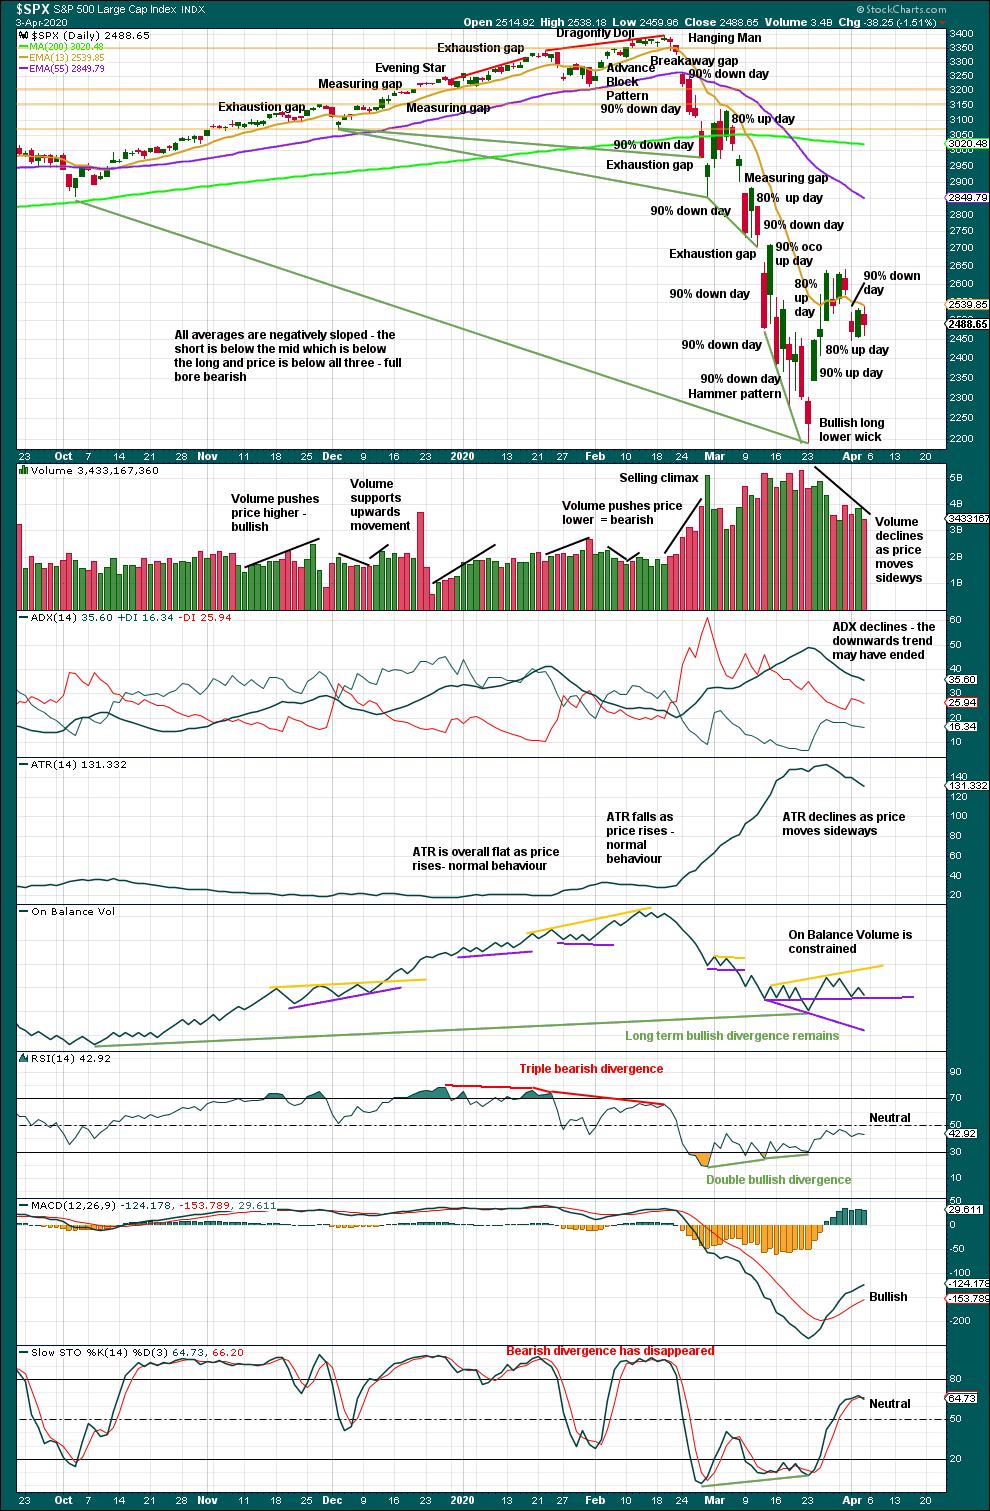
Click chart to enlarge. Chart courtesy of StockCharts.com.
Another 90% downwards day today indicates it is most likely that the bear market is incomplete. It would be highly unusual to see a 90% downwards day so close to a sustainable low.
Volume and range overall continue to decline. So far this movement this week looks like a pause within an ongoing downwards trend.
To see what signals may be looked for to identify a high, the two previous large bear markets will be analysed in end of week analysis. The DotCom crash was analysed last week here with video here.
BREADTH – AD LINE
WEEKLY CHART
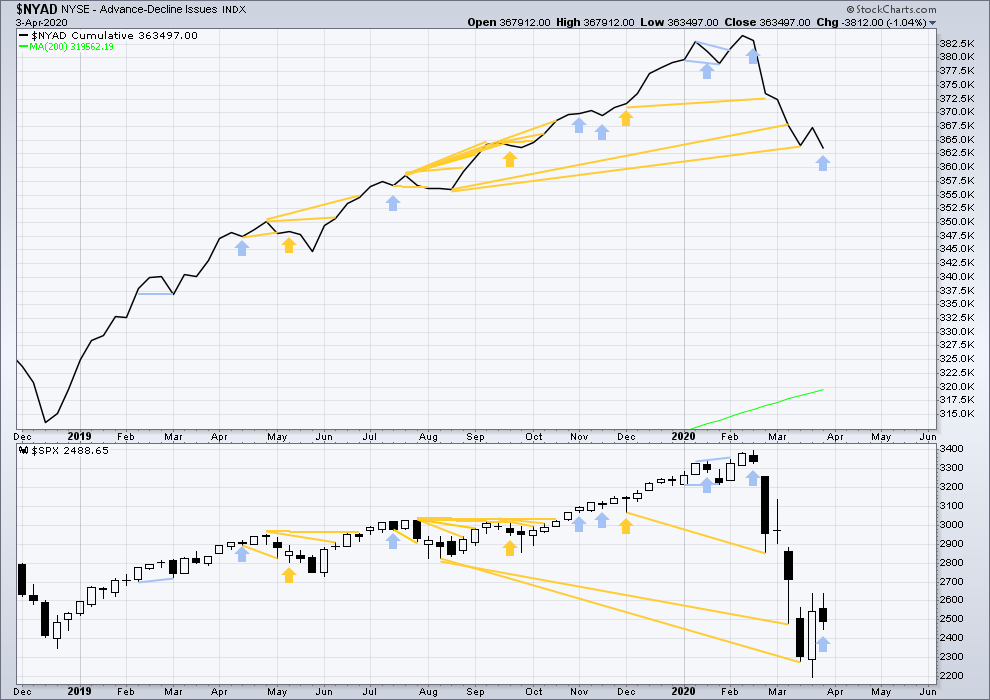
Click chart to enlarge. Chart courtesy of StockCharts.com. So that colour blind members are included, bearish signals will be noted with blue and bullish signals with yellow.
Bear markets from the Great Depression and onwards have been preceded by an average minimum of 4 months divergence between price and the AD line with only two exceptions in 1946 and 1976. With no divergence between the AD line and price at the last all time high, this current bear market now makes a third exception.
In all bear markets in the last 90 years there is some positive correlation (0.6022) between the length of bearish divergence and the depth of the following bear market. No to little divergence is correlated with more shallow bear markets. Longer divergence is correlated with deeper bear markets.
This bear market comes after no bearish divergence. It would more likely be shallow, but this is a statement of probability and not certainty. So far it is slightly more than the 0.382 Fibonacci ratio of the bull market it is correcting (beginning March 2009).
This week price has moved higher although the candlestick has closed red. The AD line has declined. This divergence is bearish for the short term.
Large caps all time high: 3,393.52 on 19th February 2020.
Mid caps all time high: 2,109.43 on 20th February 2020.
Small caps all time high: 1,100.58 on 27th August 2018.
DAILY CHART
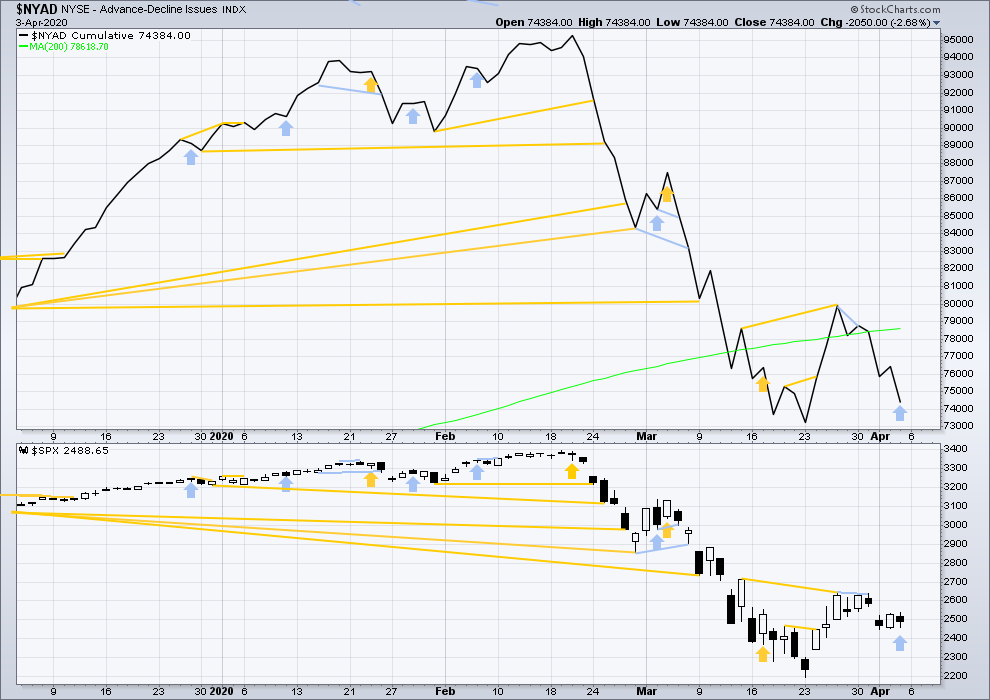
Click chart to enlarge. Chart courtesy of StockCharts.com. So that colour blind members are included, bearish signals will be noted with blue and bullish signals with yellow.
Breadth should be read as a leading indicator.
On Friday price has moved higher although the candlestick has closed red. The AD line has declined. This divergence is bearish for the short term.
VOLATILITY – INVERTED VIX CHART
WEEKLY CHART
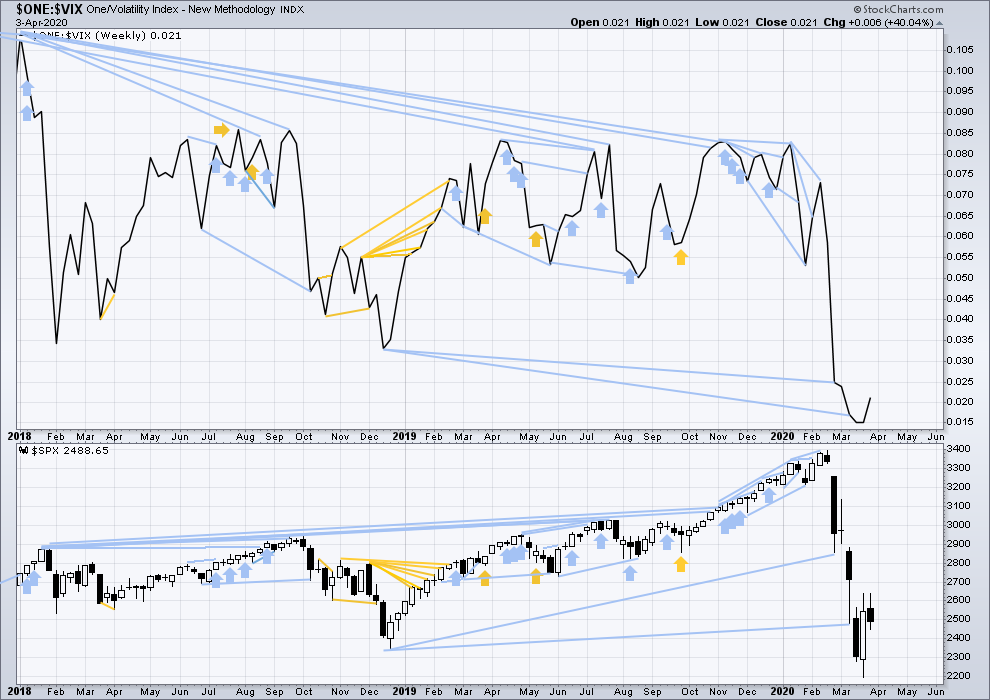
Click chart to enlarge. Chart courtesy of StockCharts.com. So that colour blind members are included, bearish signals will be noted with blue and bullish signals with yellow.
This week both price and inverted VIX have moved higher. There is no new short term divergence.
DAILY CHART
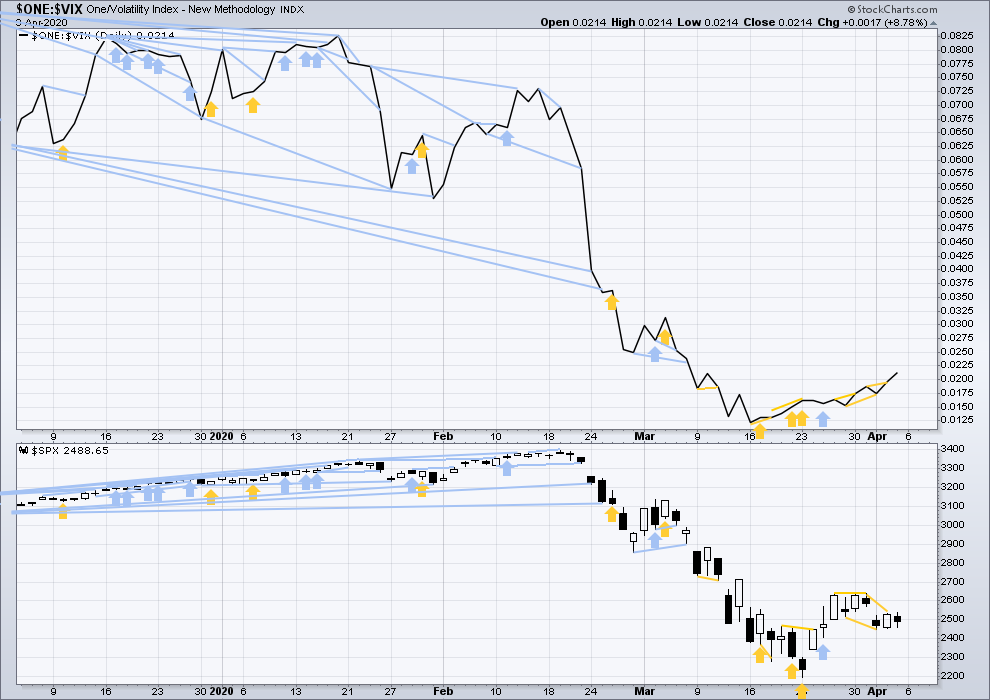
Click chart to enlarge. Chart courtesy of StockCharts.com. So that colour blind members are included, bearish signals will be noted with blue and bullish signals with yellow.
Today both price and inverted VIX have moved higher. There is no new short-term divergence.
DOW THEORY
Dow Theory has confirmed a bear market with the following lows made on a closing basis:
DJIA: 21,712.53 – a close below this point has been made on the March 12, 2020.
DJT: 8,636.79 – a close below this point has been made on March 9, 2020.
Adding in the S&P and Nasdaq for an extended Dow Theory, a bear market has now been confirmed:
S&P500: 2,346.58 – a close below this point has now been made on March 20, 2020.
Nasdaq: 7,292.22 – a close below this point was made on the March 12, 2020.
ANALYSIS OF CORRECTIONS WITHIN BEAR MARKETS
SECOND HISTORICAL EXAMPLE: GLOBAL FINANCIAL CRISIS: OCTOBER 2007 – MARCH 2009
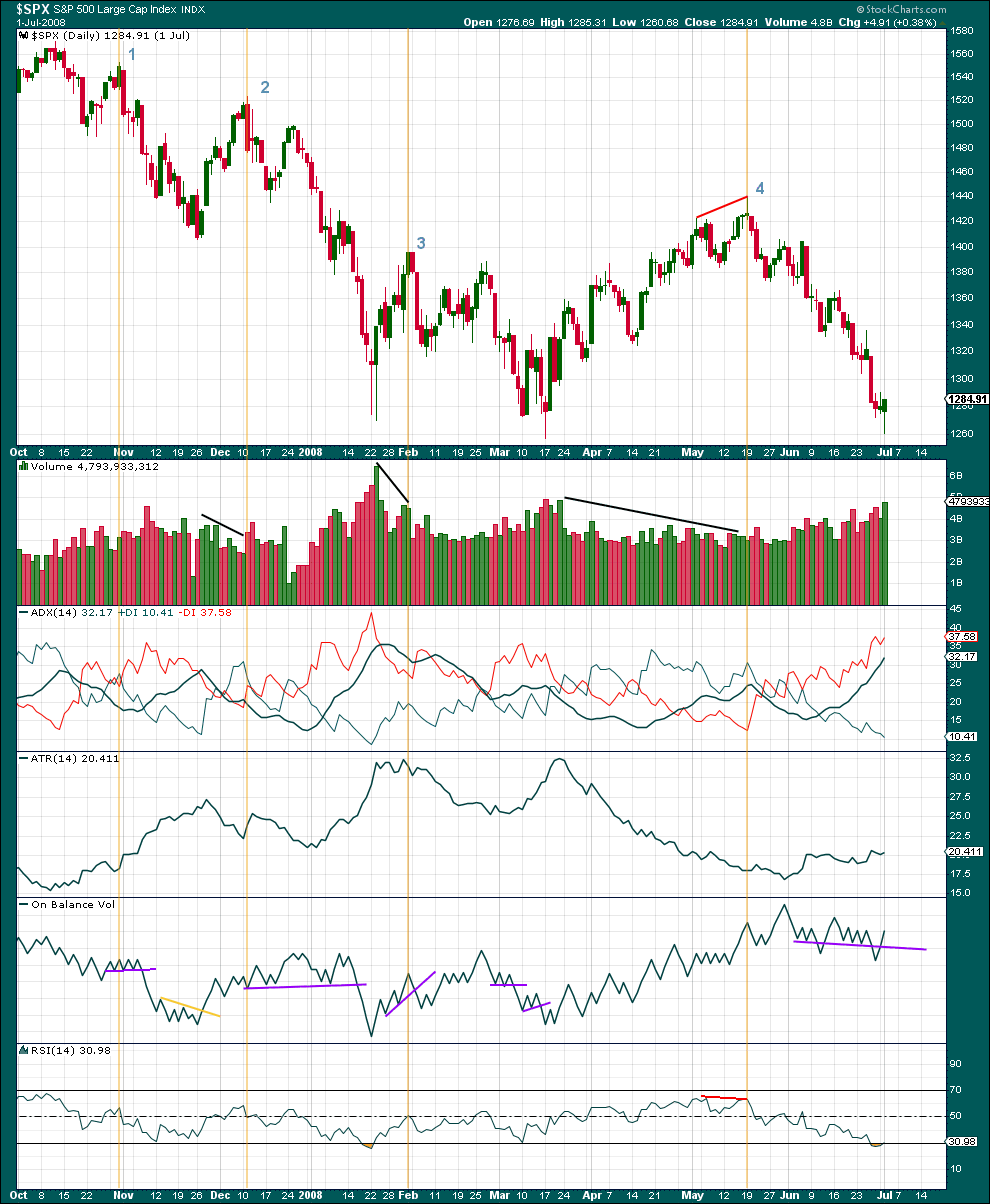
Click chart to enlarge. Chart courtesy of StockCharts.com.
This first chart looks at the first half of the Global Financial Crisis. Several bounces are noted. Each is analysed below:
1. Ended October 31, 2007. The bounce lasted 5 days. A Bearish Engulfing candlestick at the end, which had support from volume; volume declined throughout; ADX declined throughout; ATR declined throughout; On Balance Volume confirmed highs at the end; RSI exhibited no divergence at the high and did not reach overbought.
2. Ended December 11, 2007. The bounce lasted 11 days. A Bearish Engulfing candlestick at the end; volume declined throughout; ADX indicated an upwards trend at the end; ATR was overall flat; On Balance Volume confirmed highs at the end; RSI exhibited no divergence at the high and did not reach overbought.
3. Ended February 1, 2008. The bounce lasted 7 days. A Dark Cloud Cover candlestick at the end did not have support from volume; volume overall declined throughout but showed short-term increase on the final upwards days; ADX declined throughout; ATR was overall flat; On Balance Volume confirmed highs at the end; RSI exhibited no divergence at the high and did not reach overbought.
4. Ended May 19, 2008. The bounce lasted 44 days. An Evening Doji Star candlestick at the end had a little support from volume; volume declined throughout; ADX indicated an upwards trend for much of the bounce; ATR declined; On Balance Volume confirmed highs at the end; RSI exhibited short-term bearish divergence at the high and did not reach overbought.
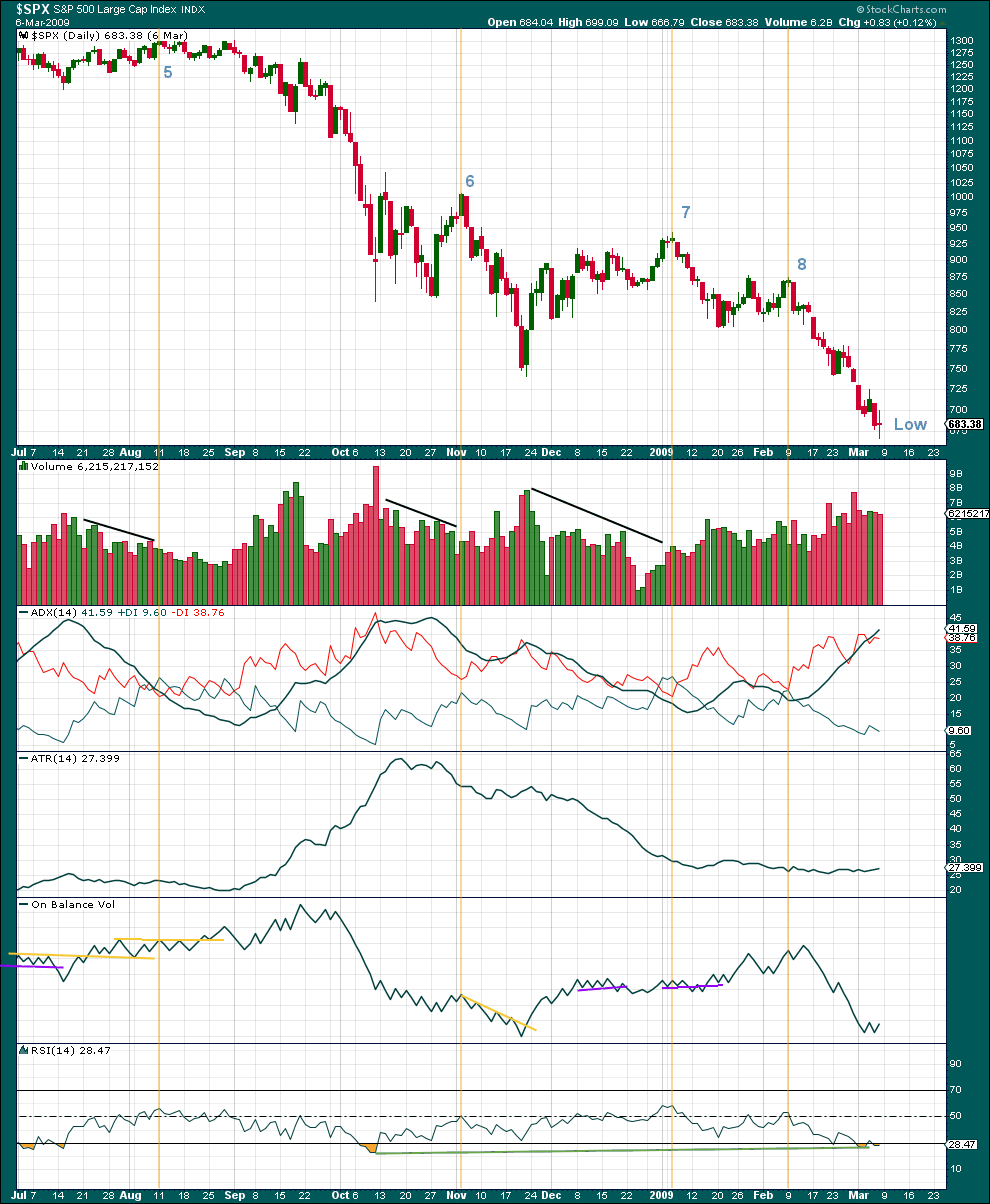
Click chart to enlarge. Chart courtesy of StockCharts.com.
5. Ended August 11, 2008. The bounce lasted 19 days. A weak Bearish Engulfing candlestick at the end did not have support from volume; volume declined throughout; ADX declined throughout; ATR was overall flat; On Balance Volume was flat at the end; RSI exhibited no divergence at the high and did not reach overbought.
6. Ended November 4, 2008. The sideways consolidation lasted 17 days. A Bearish Engulfing candlestick at the end had a very little support from volume; volume declined throughout; ADX declined; ATR declined; On Balance Volume confirmed the final high; RSI exhibited no divergence at the high and did not reach overbought.
7. Ended January 6, 2009. The bounce lasted 29 days. A Evening Star candlestick at the end did not have support from volume; volume declined throughout but showed short-term increase at the end; ADX declined; ATR declined; On Balance Volume was overall flat at final highs; RSI exhibited no divergence at the high and did not reach overbought.
8. Ended February 9, 2009. The sideways consolidation lasted 13 days. A Evening Star candlestick at the end had strong support from volume; volume was overall flat but showed a strong decline in the last two days; ADX declined; ATR declined; On Balance Volume confirmed final highs; RSI exhibited no divergence at the high and did not reach overbought.
Summary:
Major bounces may last at least 5 days or as much as 2 months. At the end of every bounce: There was a bearish candlestick pattern (although within bounces were several bearish reversal patterns that may have given false signals of a more sustainable high in place); ATR was flat or more often declined throughout; On Balance Volume most often confirmed highs at the end except for two examples where it was flat; RSI exhibited bearish divergence only once and did not reach overbought for any corrections.
Conclusion:
The presence of a bearish candlestick pattern should be looked for.
Expect ATR to decline throughout as very likely.
On Balance Volume may confirm new highs at the end of a bounce.
RSI may not exhibit bearish divergence at the end of a bounce.
GOLD
A little more upwards movement remains within a small channel and below the short-term invalidation point. The Elliott wave count remains the same.
Summary: The next target is at 1,237. Risk may now be moved down to 1,638.61.
Grand SuperCycle analysis is here.
Monthly charts were last updated here.
MAIN BEARISH ELLIOTT WAVE COUNT
WEEKLY CHART
Click chart to enlarge.
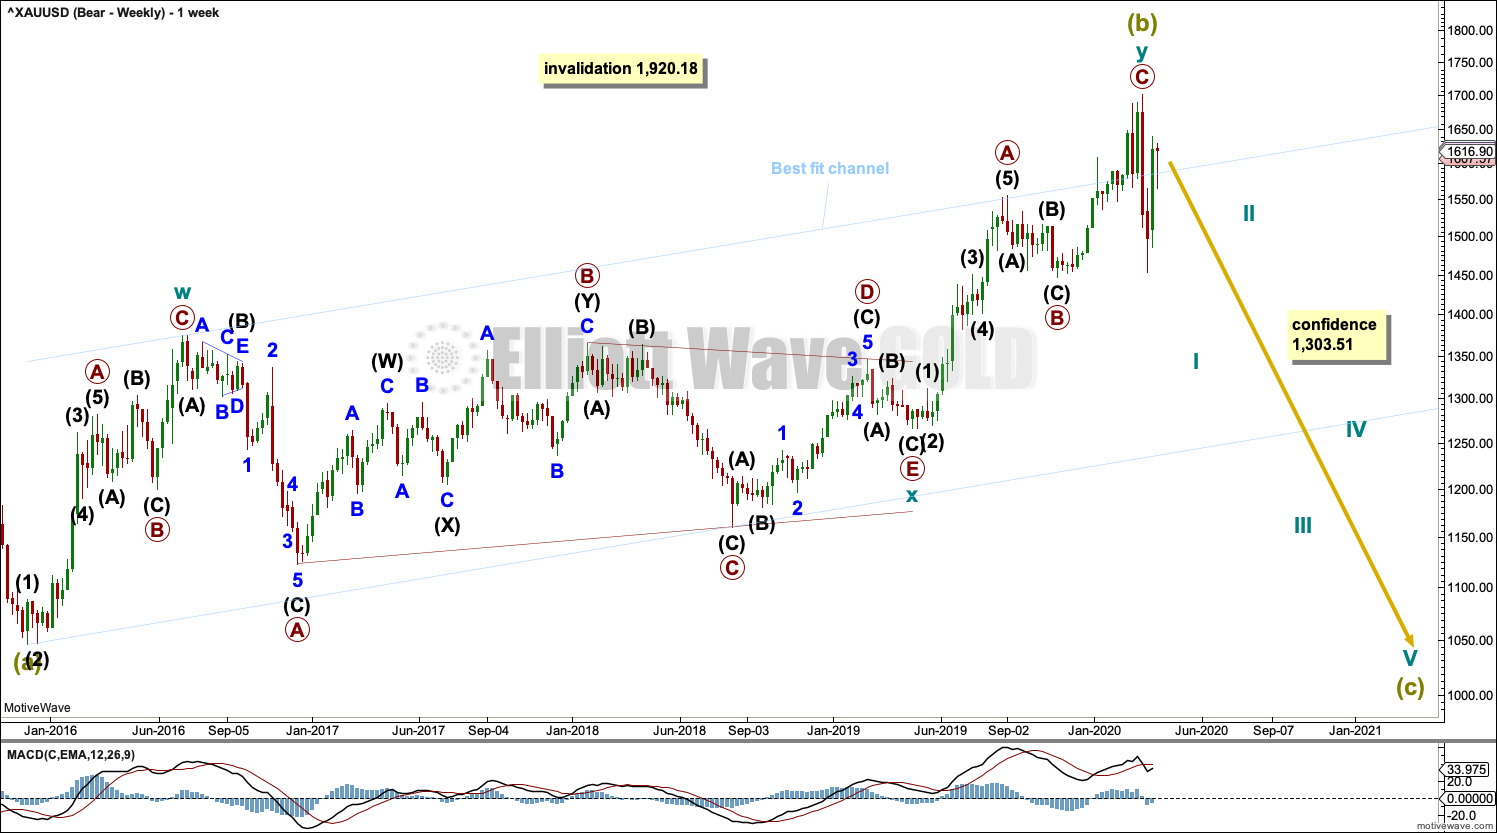
Super Cycle wave (b) may be a complete double zigzag.
The first zigzag in the double is labelled cycle wave w. The double is joined by a three in the opposite direction, a triangle labelled cycle wave x. The second zigzag in the double is labelled cycle wave y.
The purpose of the second zigzag in a double is to deepen the correction. Cycle wave y has achieved this purpose.
A wide best fit channel is added in light blue. Copy this channel over to daily charts. Price has now closed back below the upper edge of this channel.
DAILY CHART
Click chart to enlarge.
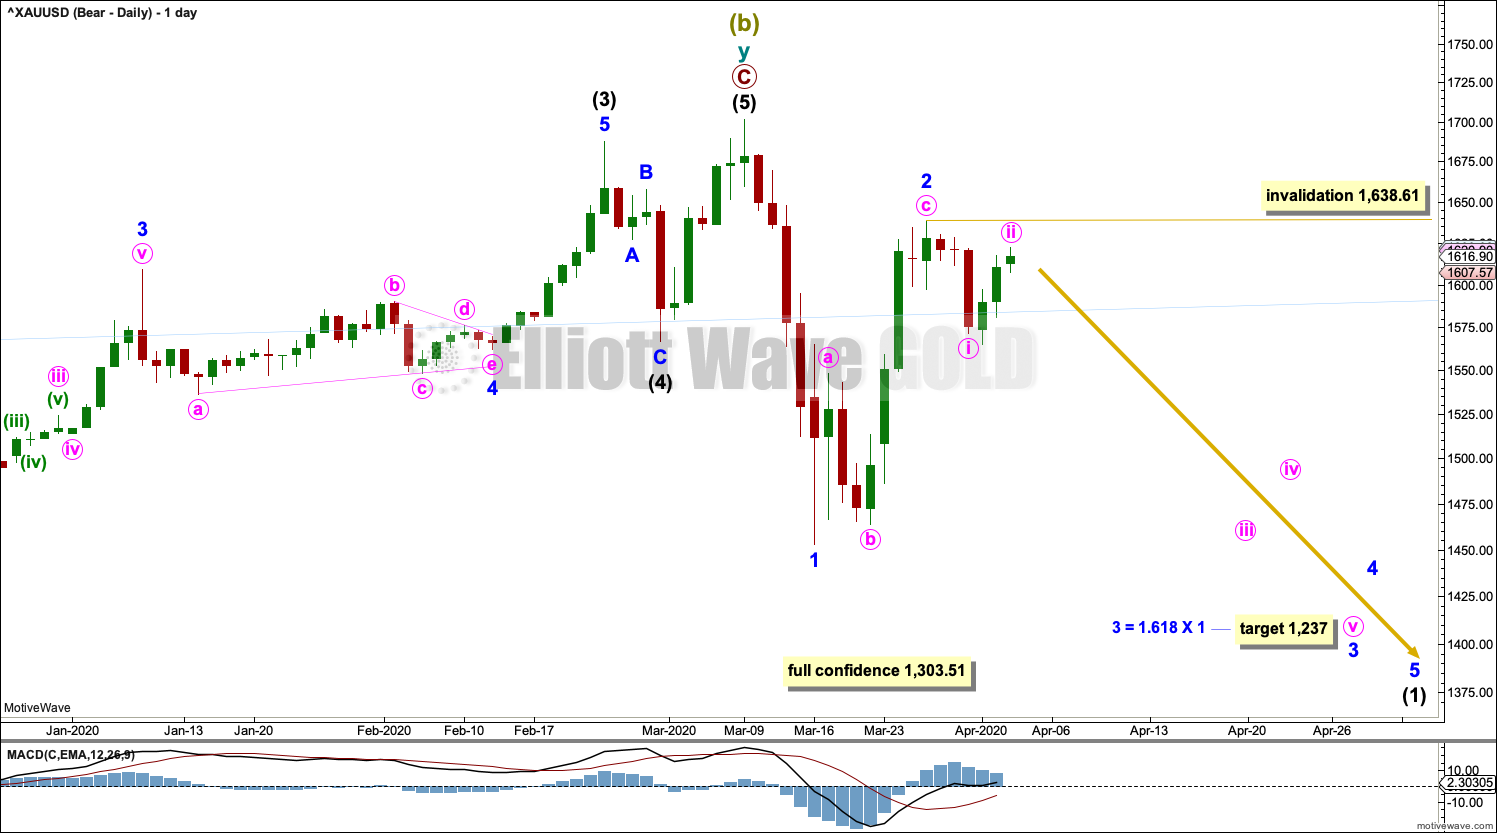
Super Cycle wave (b) may be complete.
The second zigzag in the double, labelled cycle wave y, may be complete. There is no Fibonacci ratio between primary waves A and C.
If there was a trend change at Super Cycle degree, then a five down should develop at daily, weekly and monthly time frames. The first five down at the daily chart level will be labelled intermediate wave (1), and it may be incomplete. Within intermediate wave (1), minor waves 1 and 2 may now be complete. Within minor wave 3, no second wave correction may move beyond its start above 1,638.61.
ALTERNATE BULLISH ELLIOTT WAVE COUNT
WEEKLY CHART
Click chart to enlarge.
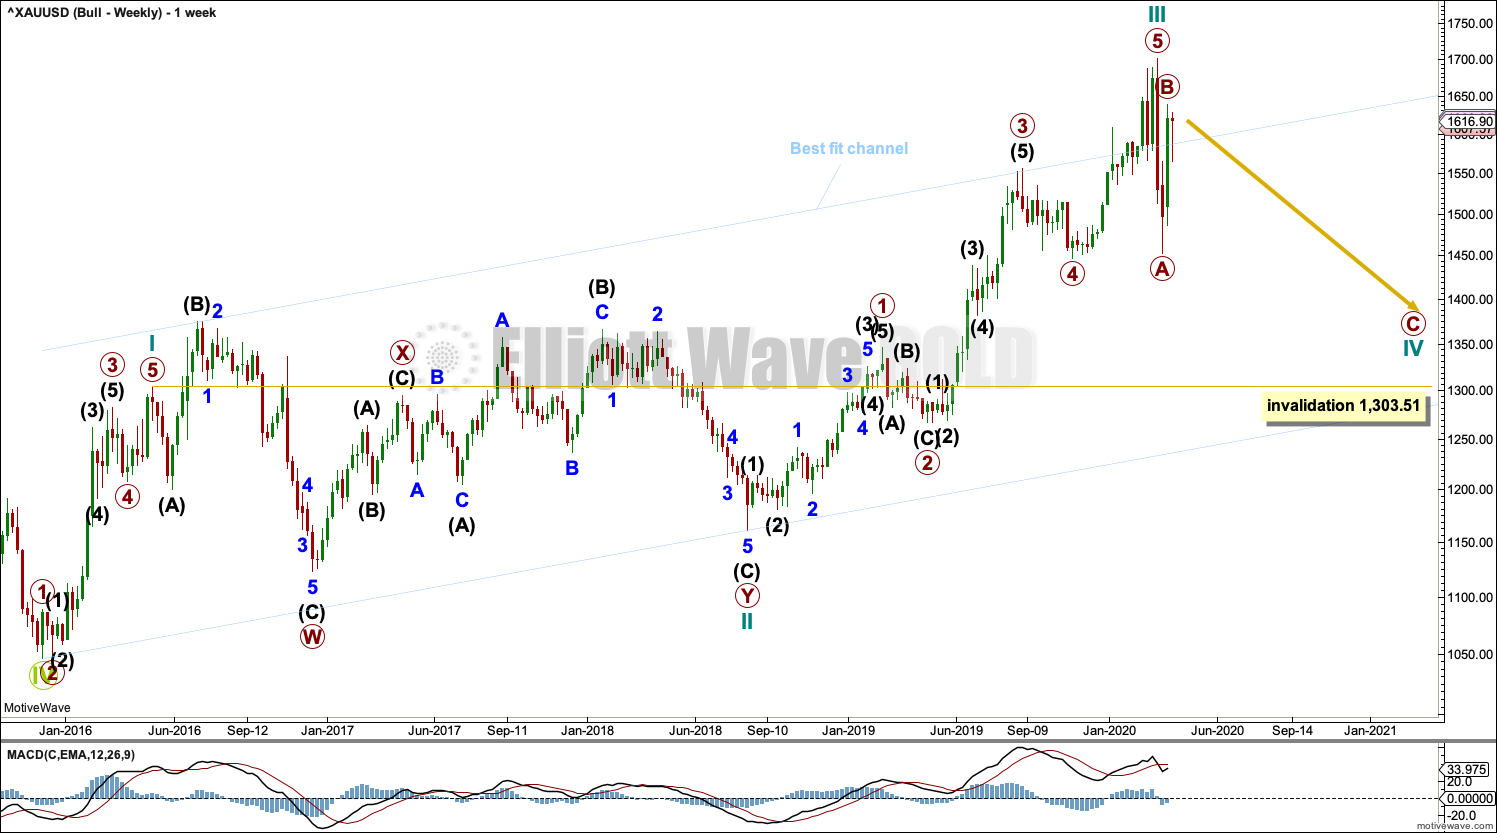
This wave count sees the the bear market complete at the last major low for Gold on 3 December 2015.
If Gold is in a new bull market, then it should begin with a five wave structure upwards on the weekly chart.
Cycle wave I fits as a five wave impulse with reasonably proportionate corrections for primary waves 2 and 4. This resolves a previous major problem with the bullish wave count.
Cycle wave II now fits as a double flat. However, a problem arises with the relabelling of this structure. Within the first flat correction labelled primary wave W, this wave count now needs to ignore what looks like an obvious triangle from July to September 2016 (this can be seen labelled as a triangle on the bear wave count above). This movement must now be labelled as a series of overlapping first and second waves.
Within the first flat correction labelled primary wave W of the double flat of cycle wave II, intermediate wave (B) is 1.69 the length of intermediate wave (A). This is longer than the common range of up to 1.38, but within an allowable guideline of up to 2. The length of intermediate wave (B) reduces the probability of this wave count.
Cycle wave III may be complete. Cycle wave IV may not move into cycle wave I price territory below 1,303.51.
DAILY CHART
Click chart to enlarge.
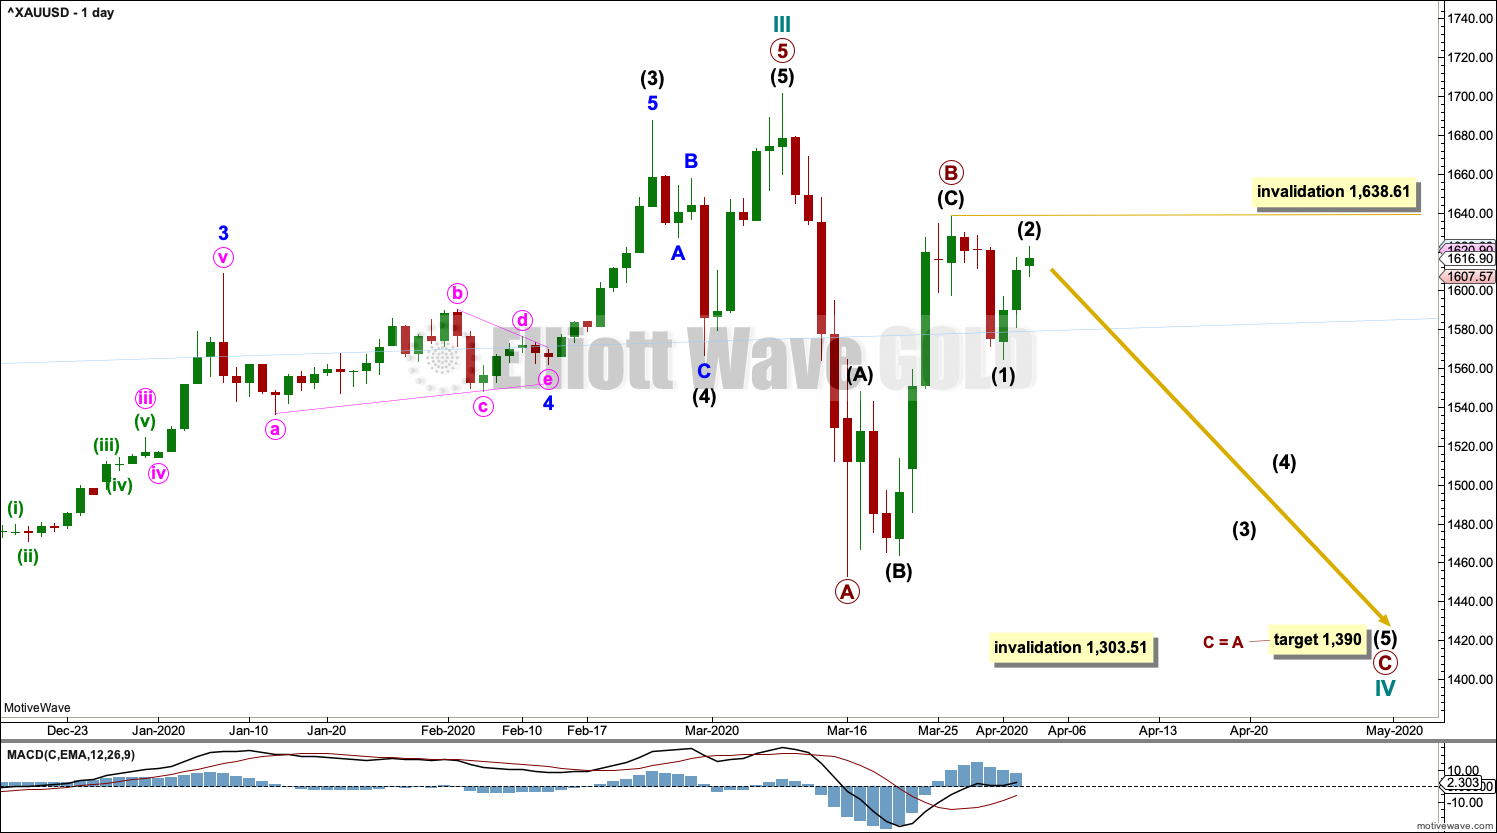
Cycle wave III may be complete. Cycle wave IV may not move into cycle wave I price territory below 1,303.51.
Cycle wave II was relatively deep at 0.55 of cycle wave I. If cycle wave IV exhibits alternation in depth, it may more likely be shallow; the first target at 0.382 of cycle wave III would be preferred.
Cycle wave II was a very long lasting double combination. It lasted 119 weeks. Cycle wave IV may most likely be a zigzag, which tend to be quicker structures, but it would still be expected to last several months.
TECHNICAL ANALYSIS
WEEKLY CHART
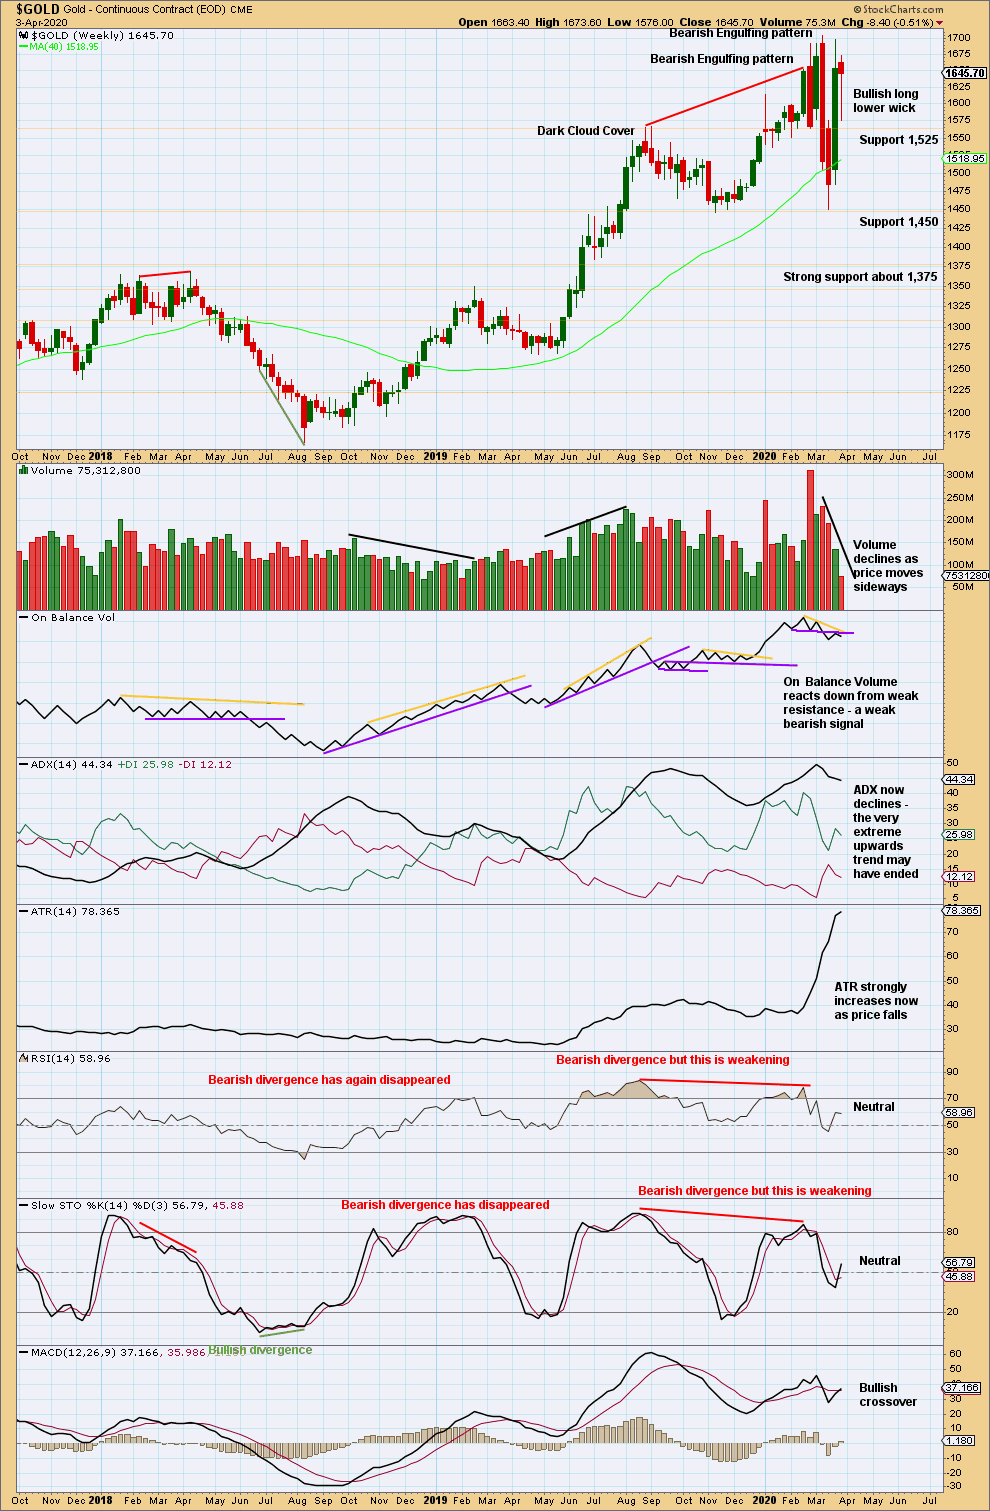
Click chart to enlarge. Chart courtesy of StockCharts.com.
The last Bearish Engulfing pattern is extreme. The pattern fully engulfs the prior nine weekly candlesticks, and it has some support from volume. This strongly indicates a trend change after the upwards trend reached very extreme and conditions reached overbought and exhibited bearish divergence.
Price does not move in straight lines. Look out for bounces and consolidations on the way down. The first major bounce within a new trend for Gold is often very deep.
This week completes an inside week with a red candlestick. Downwards movement within the week lacks support from volume.
DAILY CHART
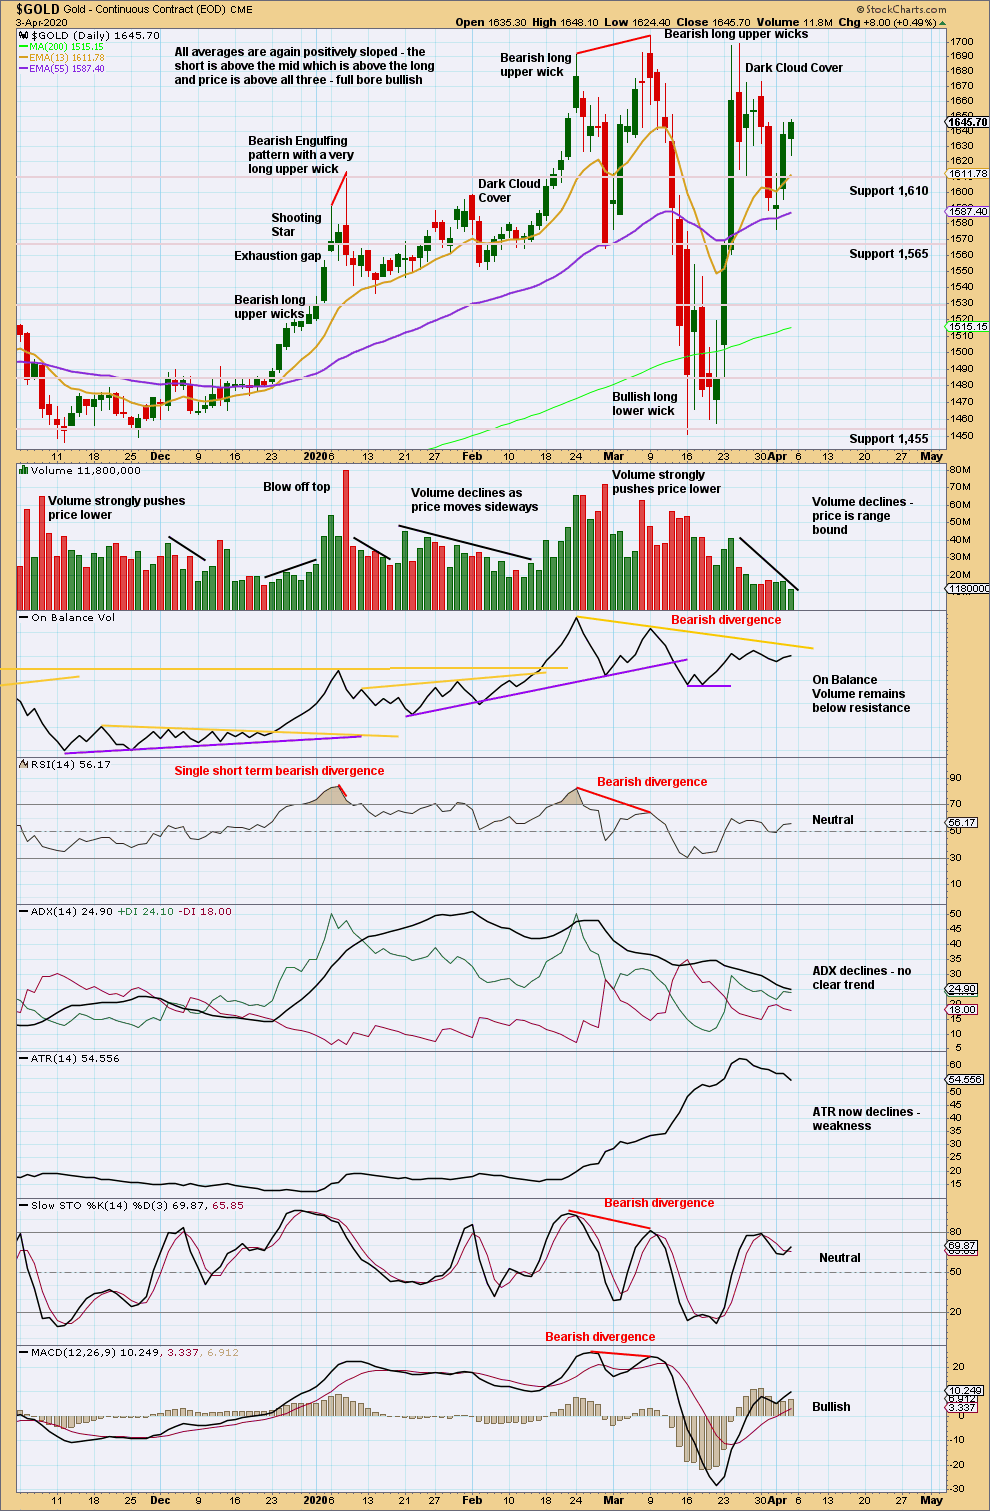
Click chart to enlarge. Chart courtesy of StockCharts.com.
Two bearish long upper wicks, weak volume for upwards sessions, and a bearish candlestick reversal pattern are together a warning that this bounce may be over.
Next support is about 1,565 and below that about 1,530.
Downwards days in recent weeks still have stronger volume than upwards days. The volume profile remains bearish so far. The last upwards day is particularly weak, which suggests another bounce may be over here.
GDX WEEKLY CHART
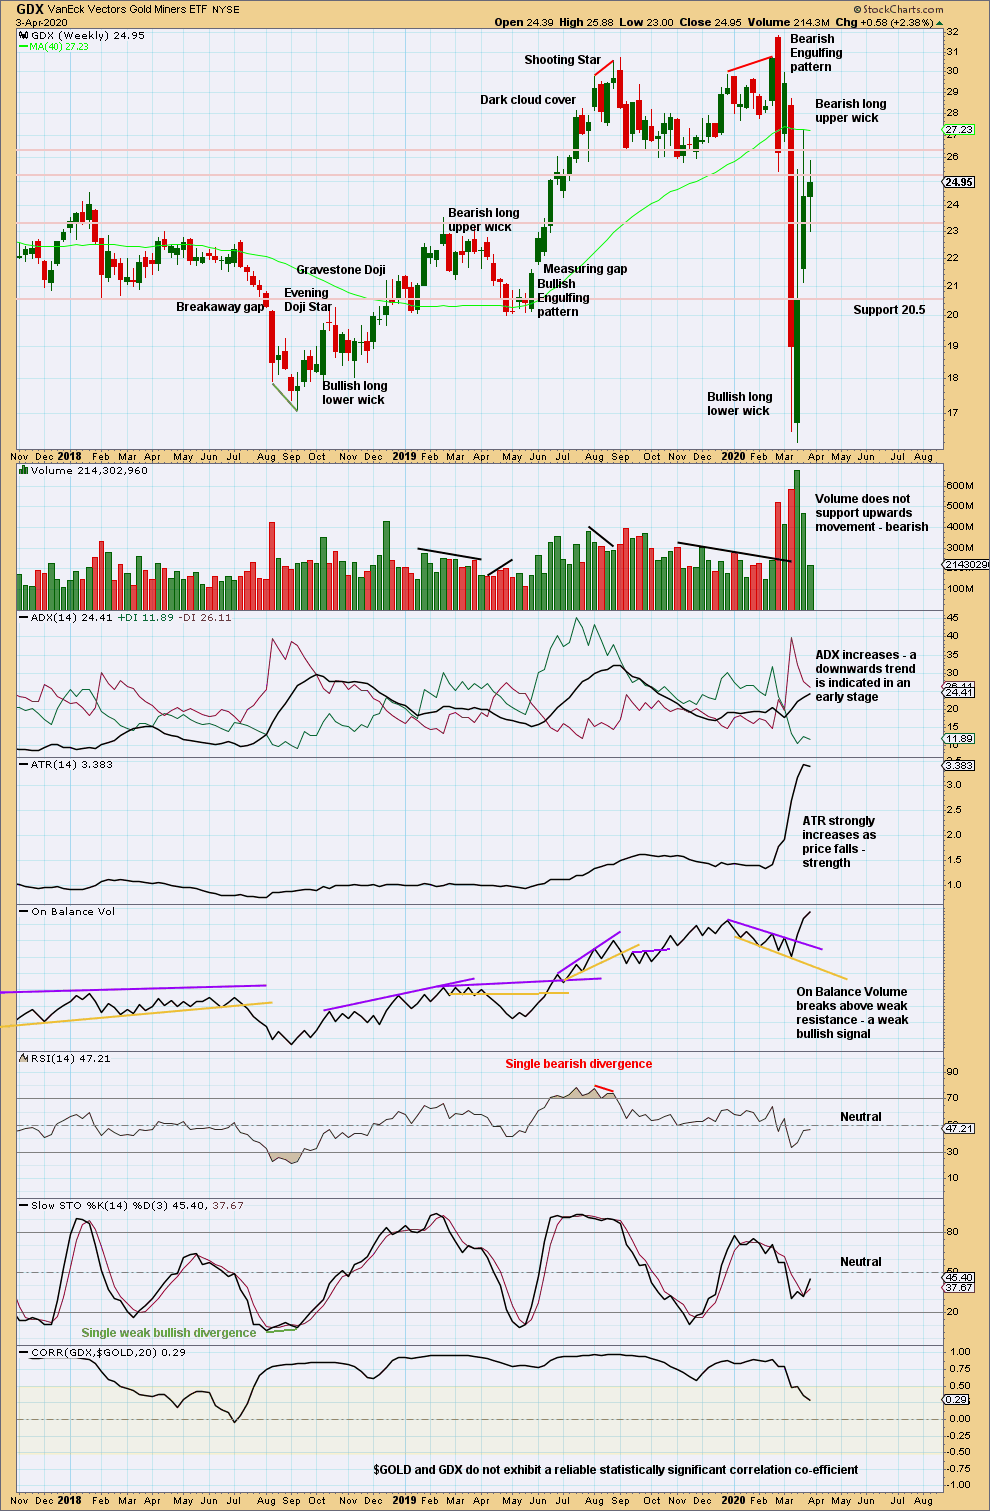
Click chart to enlarge. Chart courtesy of StockCharts.com.
There is support below in a zone about 16.75 to 15.85. Price has bounced up strongly again within this zone.
Further weakness in volume for another green weekly candlestick suggests upwards movement may be over here or very soon.
GDX DAILY CHART
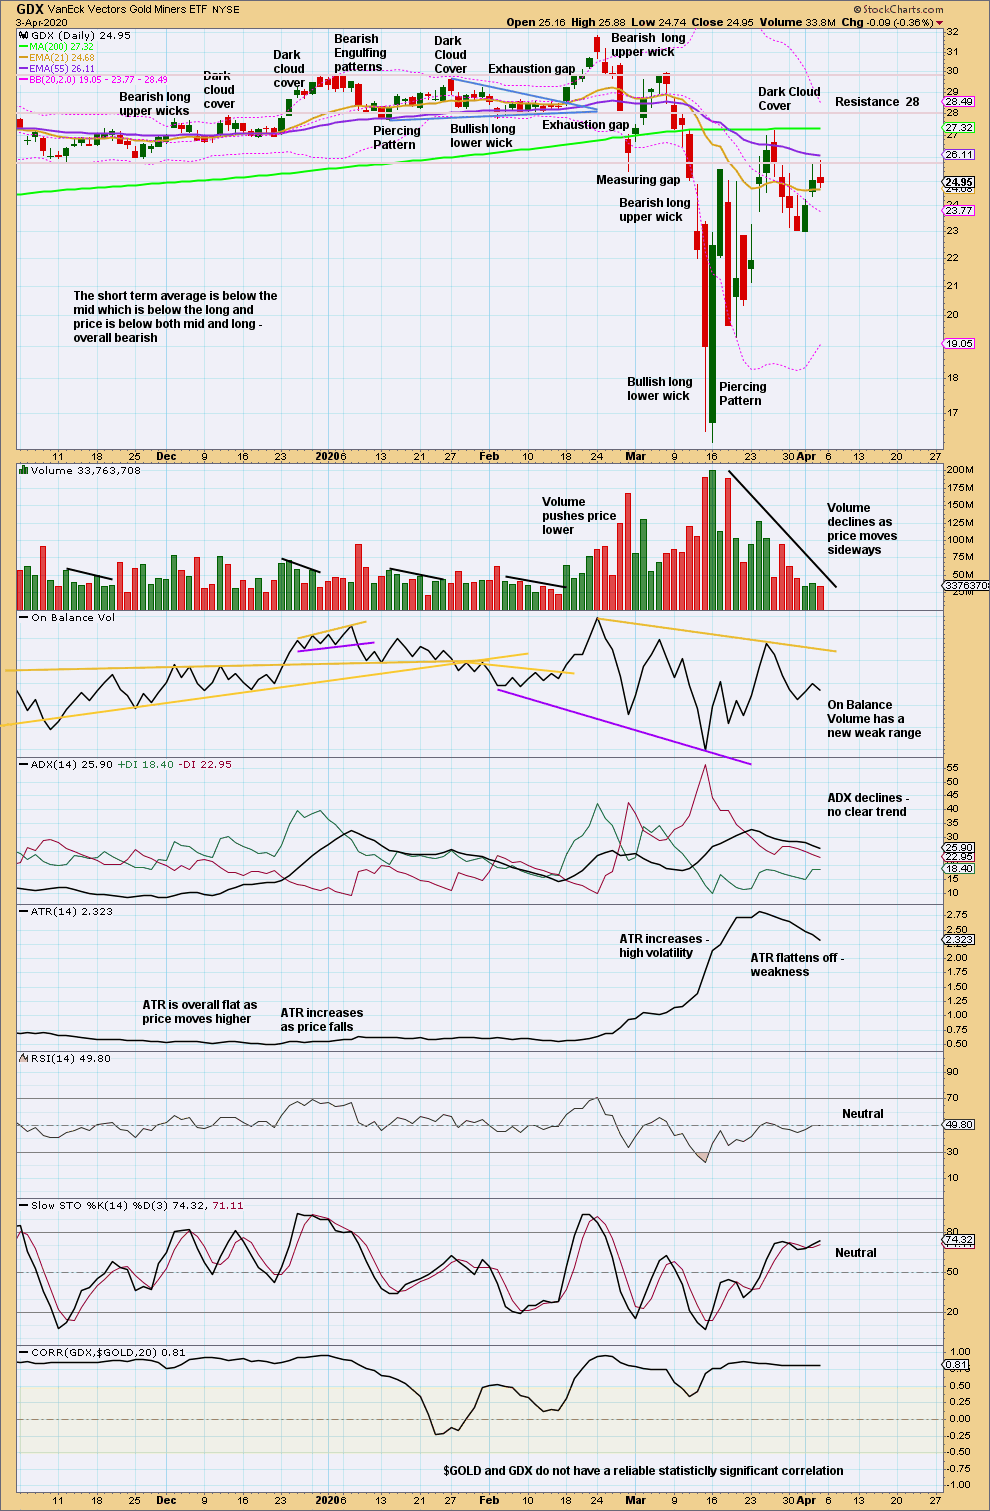
Click chart to enlarge. Chart courtesy of StockCharts.com.
There has been a trend change to downwards. This trend has support from volume pushing price lower and exhibits strength in increasing ATR.
The 55 day moving average has crossed below the 200 day moving average. This is fairly bearish.
US OIL
The bounce this week remains below the invalidation point on the main Elliott wave count and within the channel on the daily chart.
Summary: Assume the downwards trend remains while price remains within the channel on the daily chart. The final target remains at 9.77.
A new high now above the upper edge of the black channel the daily charts would suggest it could be possible a sustainable low may be in place. This view would require a new high above 49.32 for confidence.
MAIN ELLIOTT WAVE COUNT – BEARISH
MONTHLY CHART
Click chart to enlarge.
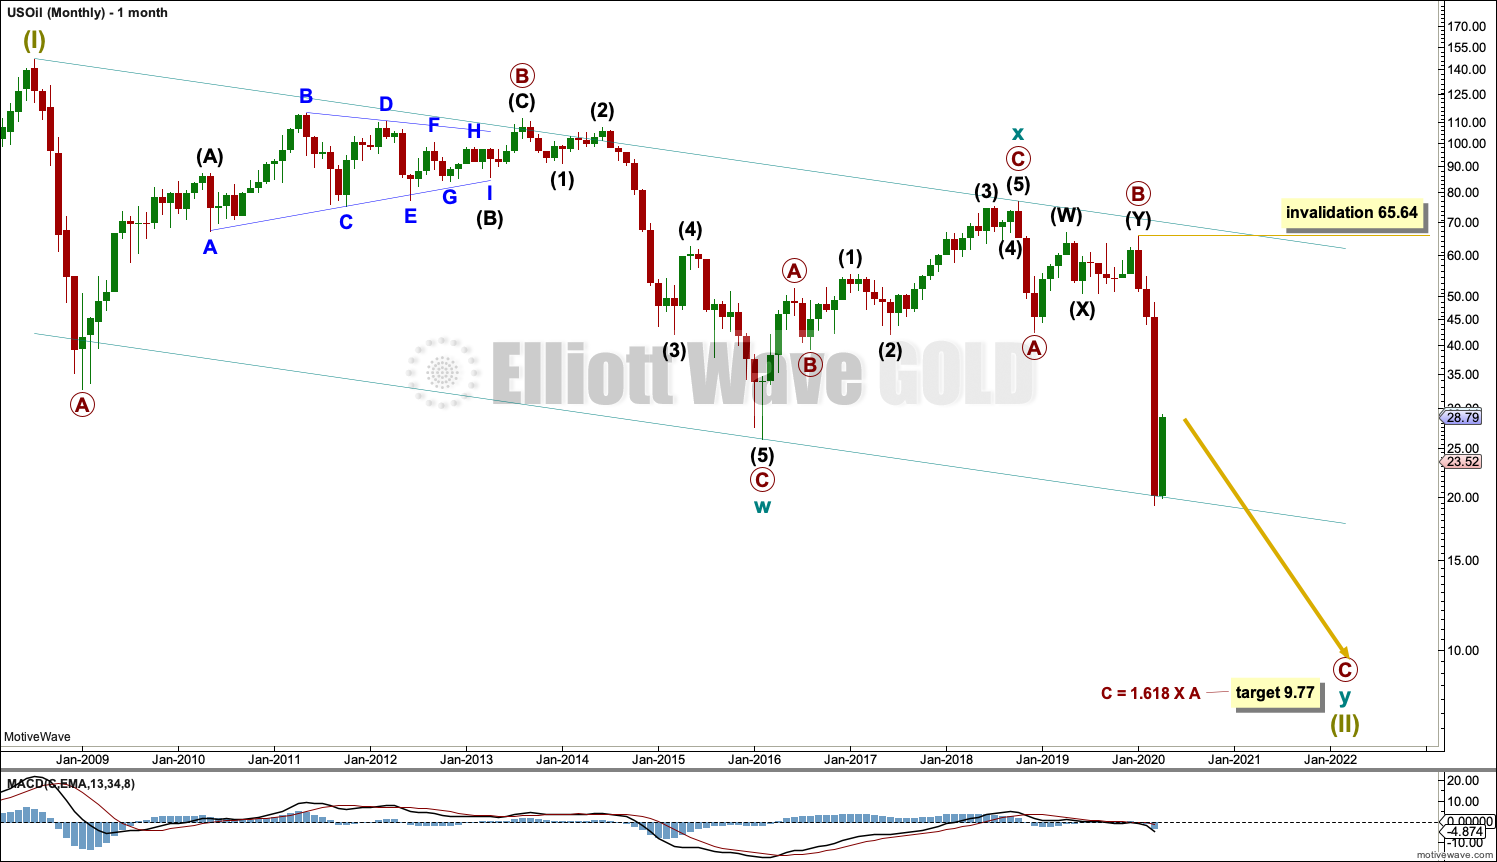
The basic Elliott wave structure is five steps forward and three steps back. This Elliott wave count expects that US Oil is still within a three steps back pattern, which began in July 2008. The Elliott wave count expects that the bear market for US Oil continues.
This Elliott wave corrective structure is a double zigzag, which is a fairly common structure. The correction is labelled Super Cycle wave (II).
The first zigzag in the double is complete and labelled cycle wave w. The double is joined by a three in the opposite direction labelled cycle wave x, which subdivides as a zigzag. The second zigzag in the double may now have begun, labelled cycle wave y.
The purpose of a second zigzag in a double zigzag is to deepen the correction when the first zigzag does not move price deep enough. To achieve this purpose cycle wave y may be expected to move reasonably below the end of cycle wave w at 26.06. This purpose has now been achieved. The next thing to look for is a complete structure within primary wave C.
Primary wave C has passed equality in length with primary wave A at 31.11. The next Fibonacci ratio of 1.618 is used to calculate a target for primary wave C and cycle wave y to end.
Cycle wave y is expected to subdivide as a zigzag, which subdivides 5-3-5.
Cycle wave w lasted 7.6 years and cycle wave x lasted 2.7 years. Cycle wave y now looks like it may be over within a few more months.
Within primary wave C, no second wave correction may move beyond the start of its first wave above 65.64.
A channel is drawn about Super Cycle wave (II): draw the first trend line from the start of cycle wave w to the end of cycle wave x, then place a parallel copy on the end of cycle wave w. Currently, price is bouncing up off the lower edge of the channel. Currently, price has bounced up off the channel. The target expects this trend line to be breached.
WEEKLY CHART
Click chart to enlarge.
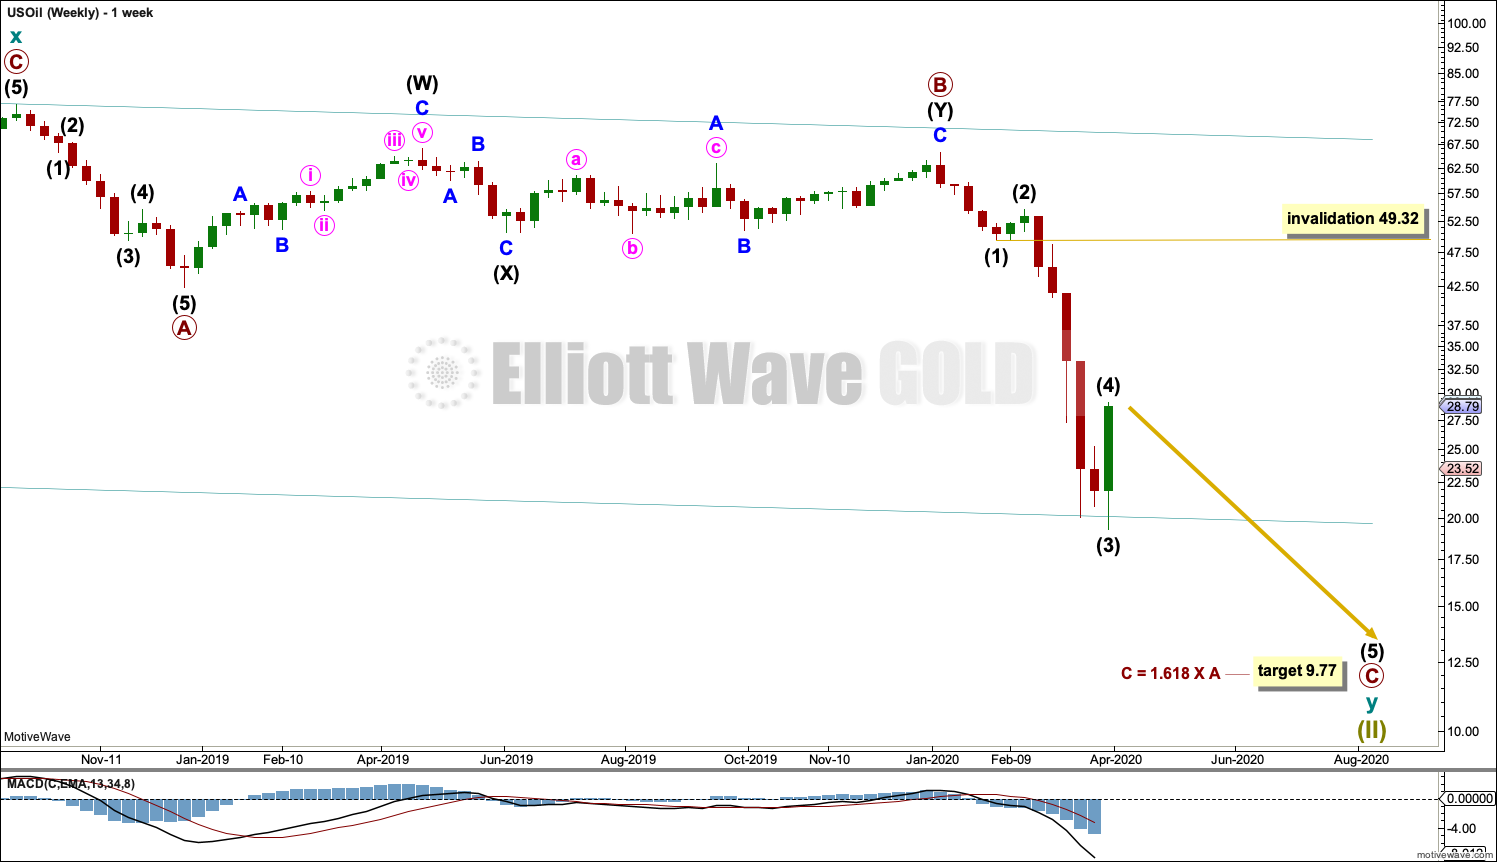
This weekly chart shows all of cycle wave y so far.
Cycle wave y is expected to subdivide as a zigzag. A zigzag subdivides 5-3-5.
Primary wave C must subdivide as a five wave motive structure, most likely an impulse. Within primary wave C, intermediate waves (1) and (2) may be complete. Intermediate wave (3) may be complete.
Intermediate wave (4) may not move into intermediate wave (1) price territory above 49.32.
DAILY CHART
Click chart to enlarge.
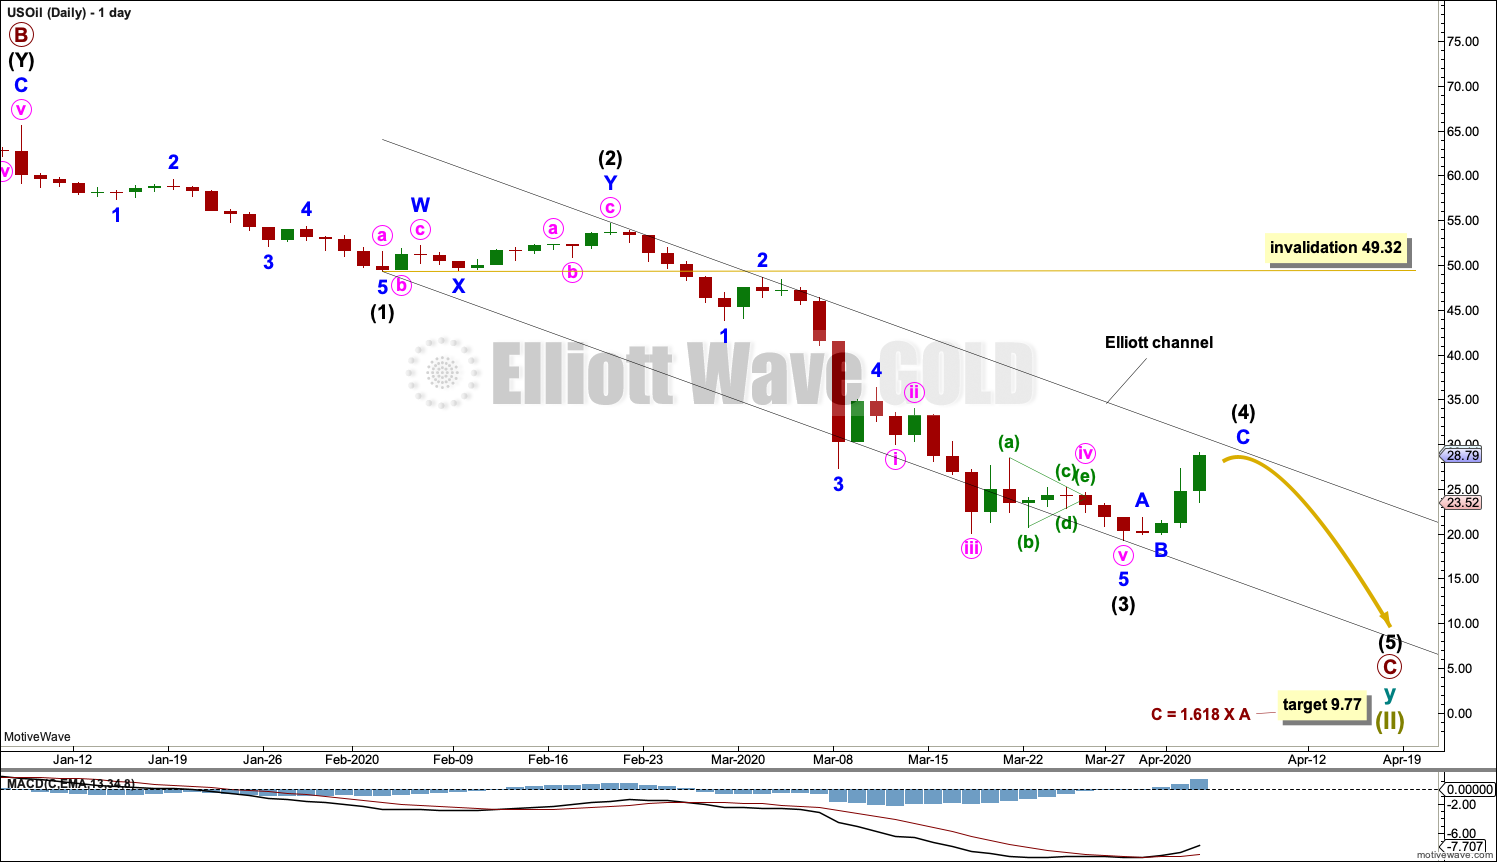
Primary wave C must subdivide as a five wave motive structure, most likely an impulse. Within primary wave C, intermediate waves (1) through to (3) may now be complete.
Draw an Elliott channel about primary wave C: draw the first trend line from the end of intermediate wave (1) to the end of intermediate wave (3), then place a parallel copy on the end of intermediate wave (2). Intermediate wave (4) may find resistance at the upper edge of the channel.
When intermediate wave (4) may be complete, then the final target may be calculated at intermediate, primary and cycle degrees. At that stage, the target may change or may widen to a zone.
If the Elliott channel is breached by upwards (not sideways) movement, then the alternate wave count below would increase in probability.
ALTERNATE DAILY CHART
Click chart to enlarge.
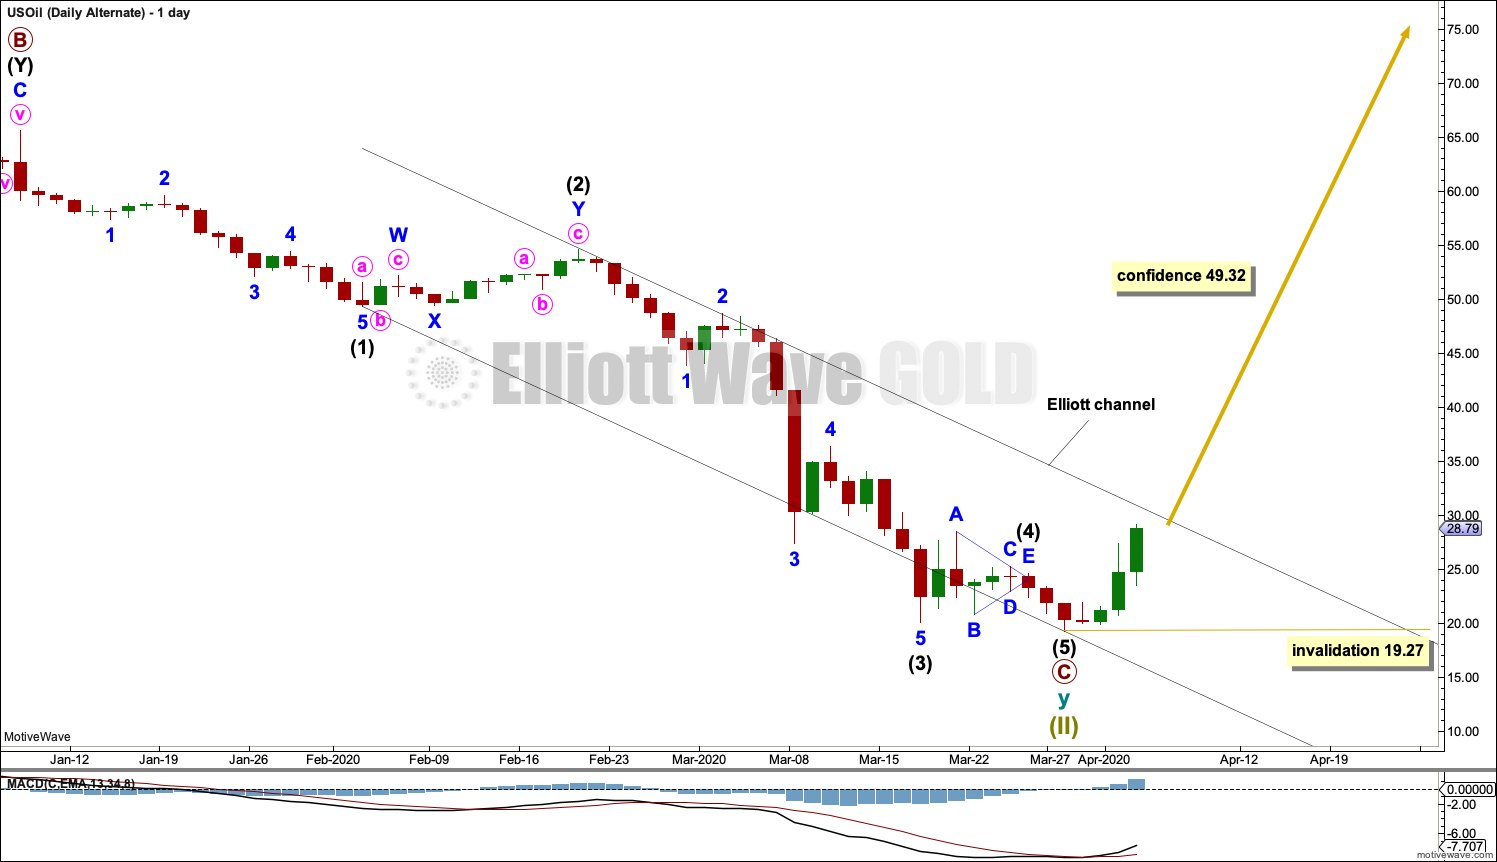
It is possible that the bear market may now be complete for Oil. Grand Super Cycle wave (II) may be complete at all degrees.
This wave count requires a new high above 49.32 for confidence.
TECHNICAL ANALYSIS
MONTHLY CHART
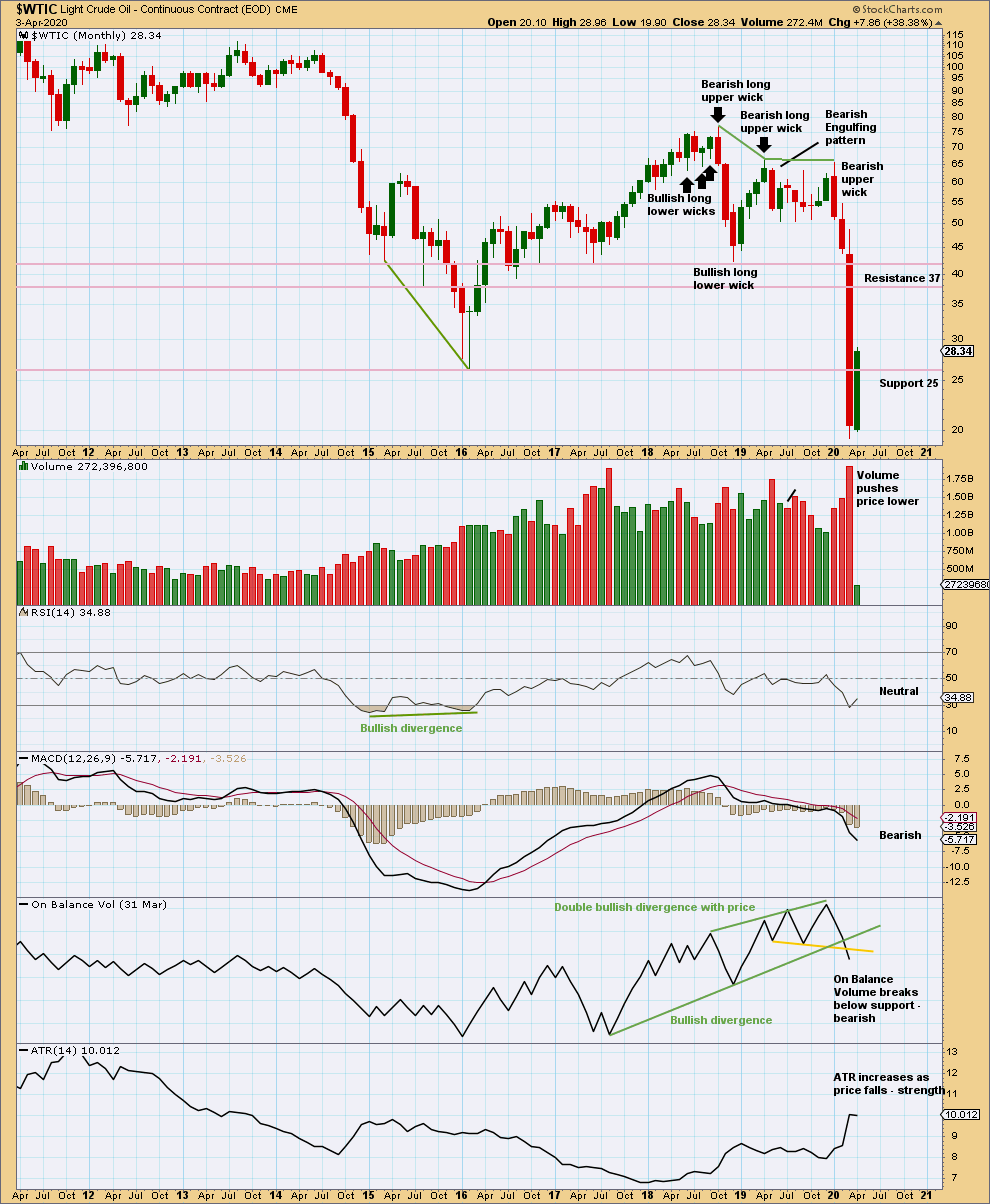
Click chart to enlarge. Chart courtesy of StockCharts.com.
When this market trends strongly down, it can reach extreme and yet price can continue for a reasonable distance.
A sustainable low may not yet be in place. Look for RSI to reach more deeply oversold and then to exhibit bullish divergence with price at swing lows.
WEEKLY CHART

Click chart to enlarge. Chart courtesy of StockCharts.com.
This measuring gap gives a target at 22.74, which has now been met and slightly exceeded. A bounce has developed here.
Overall, expect the downwards trend to continue (but keep in mind price does not move in straight lines).
A strong Bullish Engulfing pattern with support from volume suggests a possible trend change. If the measuring gap is closed with a new high above 41.05, then that would indicate a trend change.
DAILY CHART
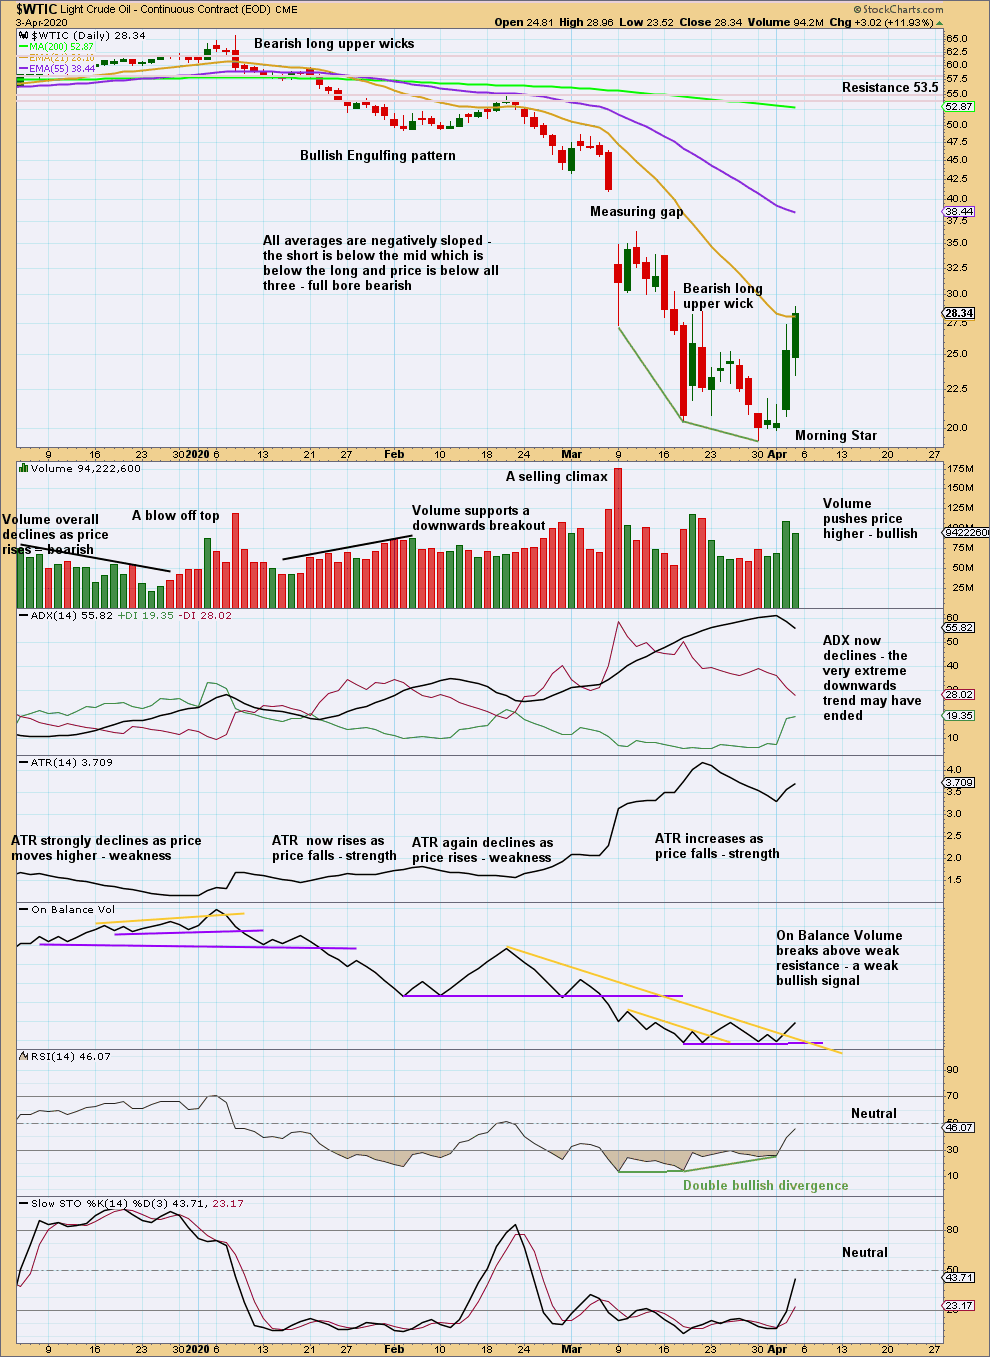
Click chart to enlarge. Chart courtesy of StockCharts.com.
A strong Morning Star suggests a trend change.
—
Always practice good risk management as the most important aspect of trading. Always trade with stops and invest only 1-5% of equity on any one trade. Failure to manage risk is the most common mistake new traders make.