
Lara’s Weekly: Elliott Wave and Technical Analysis of S&P500 and Gold and US Oil | Charts – March 6, 2020

S&P 500
Last analysis expected for very short-term movement to move at least slightly below 2,977.24 before an upwards swing began. Price did move lower reaching 2,901.55 and from there bounced up to end the session green.
Summary: There is no evidence to suggest the larger bull market is over. The current pullback is very deep and not likely to be finished yet. At its conclusion, it may present a good buying opportunity.
For the short term, a bounce or sideways consolidation may continue for wave B. A target zone for it to end next week is now at 3,182 to 3,188.
A new low below 2,728.81 would indicate a deeper correction that may end at the lower edge of the teal multi-year trend channel.
The biggest picture, Grand Super Cycle analysis, is here.
Monthly charts were last published here. Video here.
ELLIOTT WAVE COUNTS
FIRST WAVE COUNT
WEEKLY CHART
Click chart to enlarge.
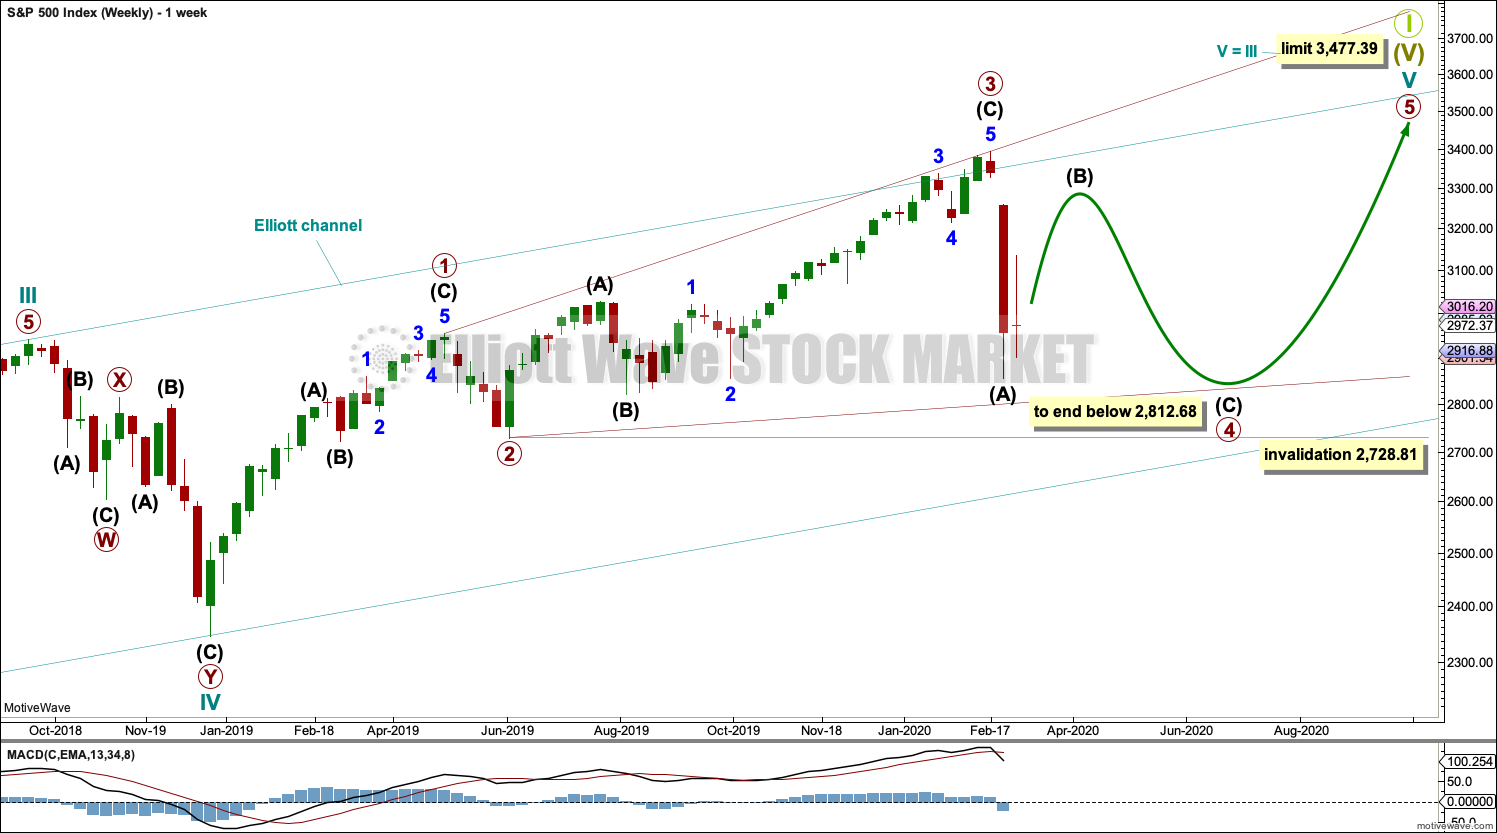
Cycle wave V may subdivide either as an impulse or an ending diagonal. This wave count considers a diagonal. The alternate considers an impulse.
A channel is drawn about the impulse of Super Cycle wave (V) using Elliott’s first technique. Draw this channel first from the high of 2,079.46 on the 5th of December 2014 to the high of 2,940.91 on the 21st of September 2018, then place a parallel copy on the low at 1,810.10 on the 11th of February 2016. Cycle wave IV found support about the lower edge.
The middle of the third wave overshoots the upper edge of the Elliott channel drawn about this impulse. All remaining movement is contained within the channel. This has a typical look.
Within Super Cycle wave (V), cycle wave III may not be the shortest actionary wave. Because cycle wave III is shorter than cycle wave I, this limits cycle wave V to no longer than equality in length with cycle wave III at 3,477.39. A new high by any amount at any time frame above this point would invalidate this main wave count in favour of one of the two alternate monthly charts which may be seen in last published monthly analysis.
At this stage, cycle wave V may end within this year or possibly into next year.
The daily chart below will focus on movement from the end of intermediate wave (B) within primary wave 3.
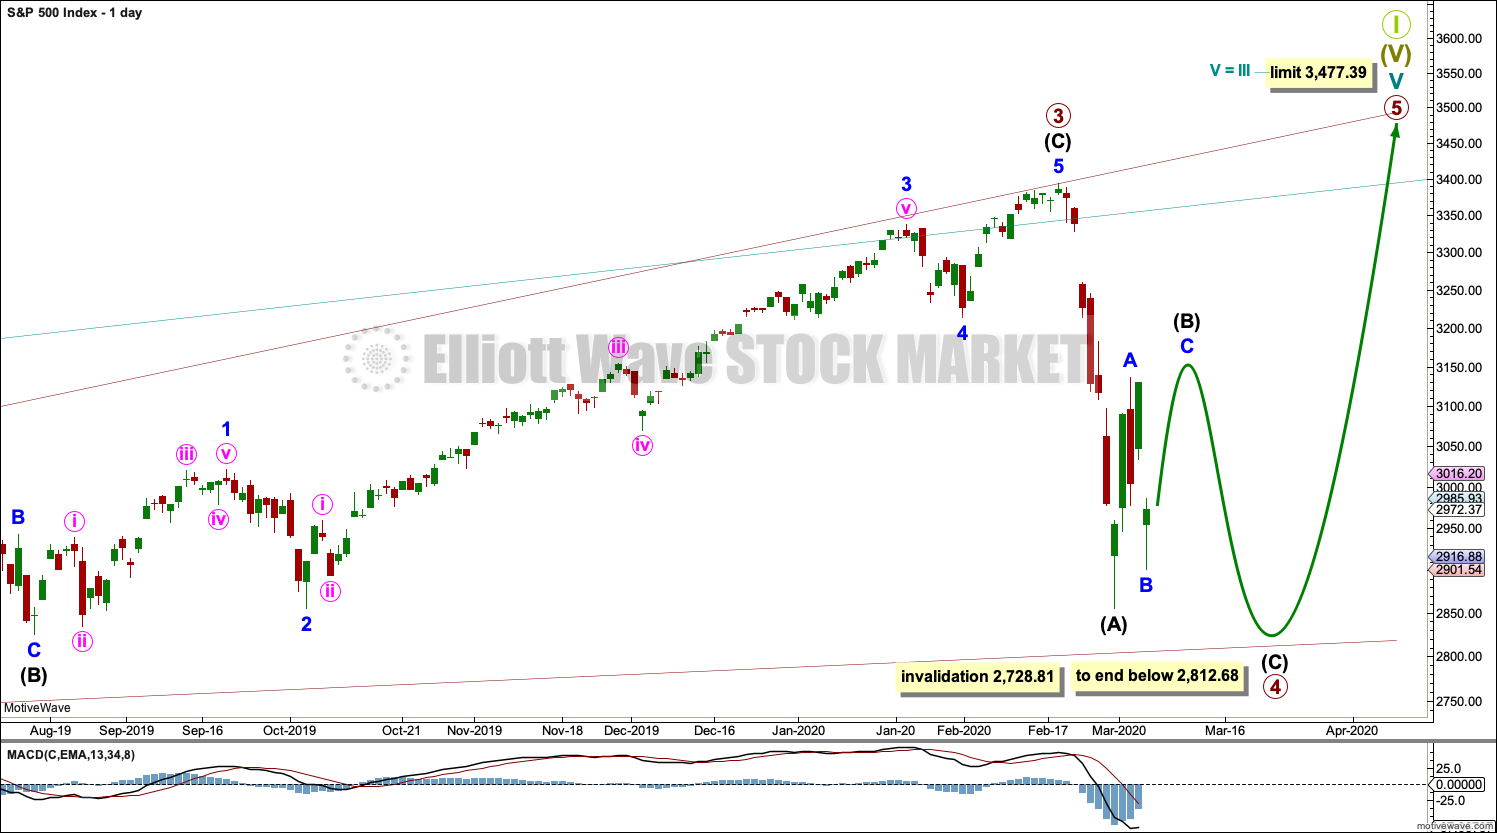
Ending diagonals require all sub-waves to subdivide as zigzags. Primary wave 4 of a diagonal must overlap primary wave 2. This rule is now met. Primary wave 4 may not move below the end of primary wave 2 below 2,728.81.
This ending diagonal would be expanding. Primary wave 3 is longer than primary wave 1, and primary wave 4 so far is longer than primary wave 2. Primary wave 5 would need to be longer than primary wave 3 for all rules regarding wave lengths of expanding diagonals to be met.
Fourth and second waves of diagonals most commonly end somewhere between 0.66 to 0.81 of the prior wave. This gives a target zone for primary wave 4 from 2,954.81 to 2,855.10. However, this diagonal is expanding and primary wave 5 needs to be longer in length than primary wave 3, which was 664.71 points for this rule to be met. This rule needs to be met prior to the upper limit for cycle wave V at 3,477.39, so primary wave 5 would need to begin below 2,812.68.
DAILY CHART
Click chart to enlarge.
All sub-waves of an ending diagonal must subdivide as zigzags. This is the only Elliott wave structure where a third wave sub-divides as anything other than an impulse.
Primary wave 4 must subdivide as a zigzag. Within the zigzag, a sharp bounce or a time consuming sideways consolidation for intermediate wave (B) may be underway. It may now end next week.
Diagonals normally adhere very well to their trend lines, which may be tested within the sub-waves. The upper 1-3 trend line is tested at the end of minor wave 3 within intermediate wave (C) within primary wave 3.
Primary wave 4 may not move beyond the end of primary wave 2 below 2,728.81.
SECOND WAVE COUNT
WEEKLY CHART
Click chart to enlarge.
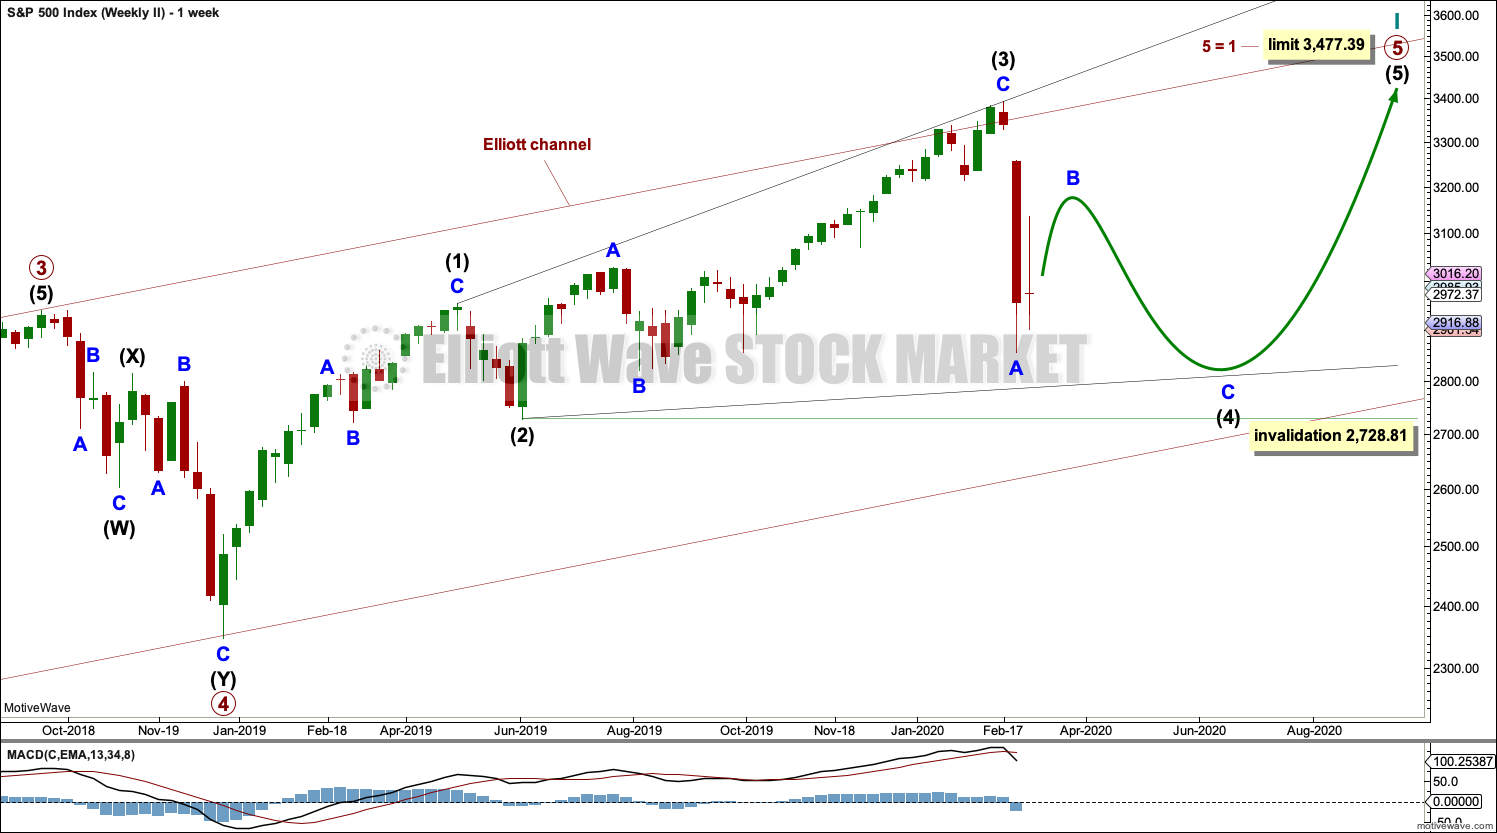
This second wave count sees all subdivisions from the end of the March 2009 low in almost the same way, with the sole difference being the degree of labelling.
If the degree of labelling for the entirety of this bull market is all moved down one degree, then only a first wave at cycle degree may be nearing an end.
When cycle wave I is complete, then cycle wave II should meet the technical definition of a bear market as it should retrace more than 20% of cycle wave I, but it may end about either the 0.382 or 0.618 Fibonacci Ratios of cycle wave I. Cycle wave II may end close to the low of primary wave II within cycle wave I, which is at 1,810.10. It is also possible that cycle wave II could be fairly shallow and only barely meet the definition of a bear market.
An ending expanding diagonal is still viewed as nearing an end. This wave count labels it primary wave 5. Primary wave 5 may still need another year to two or so to complete, depending upon how time consuming the corrections within it may be.
Primary wave 5 may be subdividing as a diagonal, in the same way that cycle wave V is seen for the first weekly chart.
ALTERNATE WAVE COUNT
WEEKLY CHART
Click chart to enlarge.
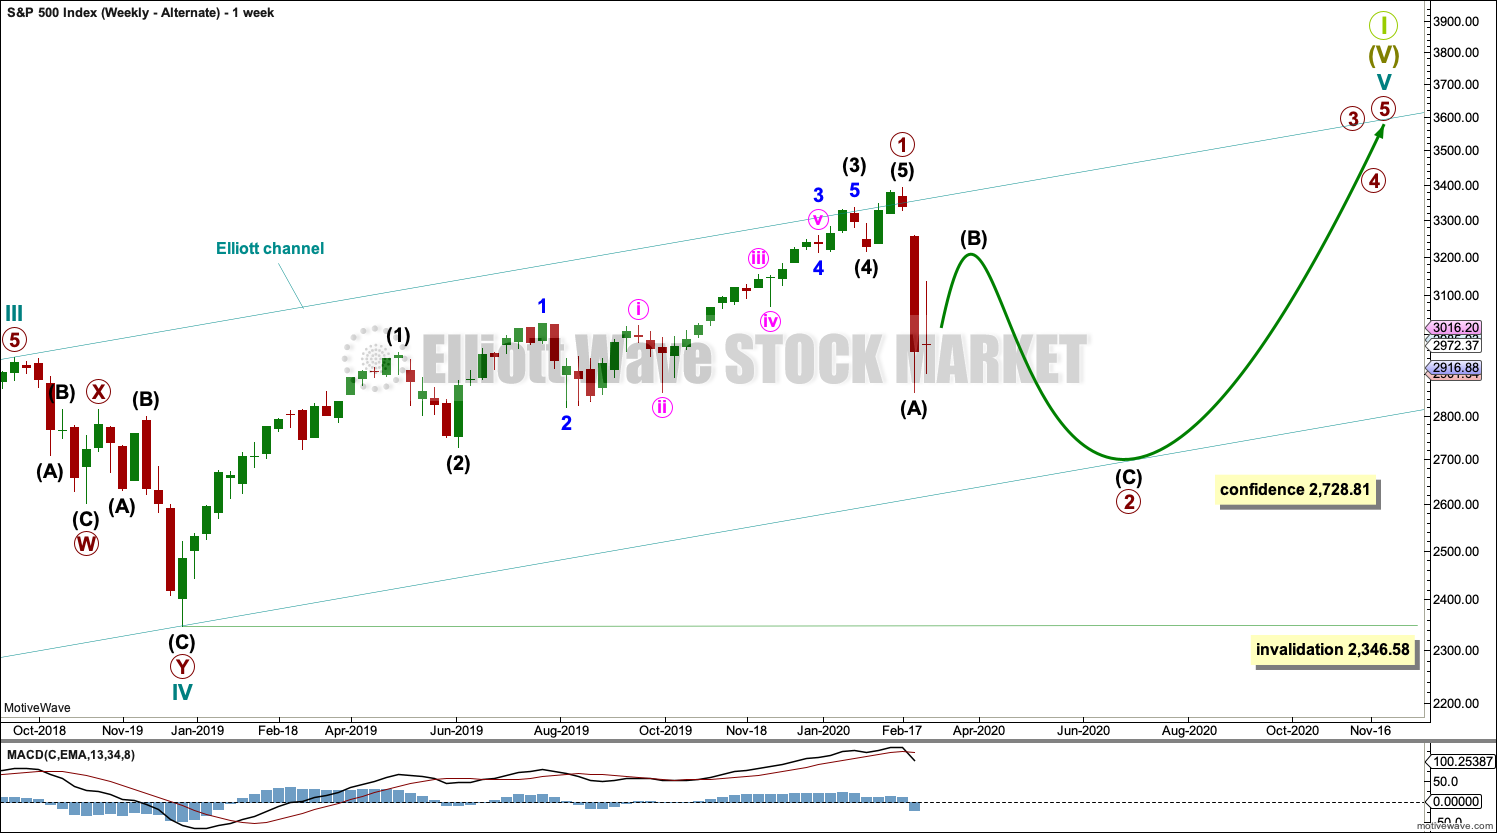
It is also possible that cycle wave V may still be unfolding as an impulse. Within the impulse, only primary wave 1 may be over at the last high.
Primary wave 1 is seen as an impulse. Within primary wave 1, there is poor proportion between the corrections of intermediate waves (2) and (4) and minor waves 2 and 4. This gives the wave count a forced look, but it is valid.
Primary wave 2 may be unfolding as a zigzag. It may find strong support about the lower edge of the multi-year teal trend channel.
Primary wave 2 may not move beyond the start of primary wave 1 below 2,346.58.
If the main wave count is invalidated with a new low below 2,728.81, then this alternate would then be used.
The limit is removed from this alternate. If only primary wave 1 is over at the last all time high, then more room would be required for the structure of cycle wave V to complete than the limit would allow. This alternate may fit with one of the alternate monthly charts.
TECHNICAL ANALYSIS
WEEKLY CHART
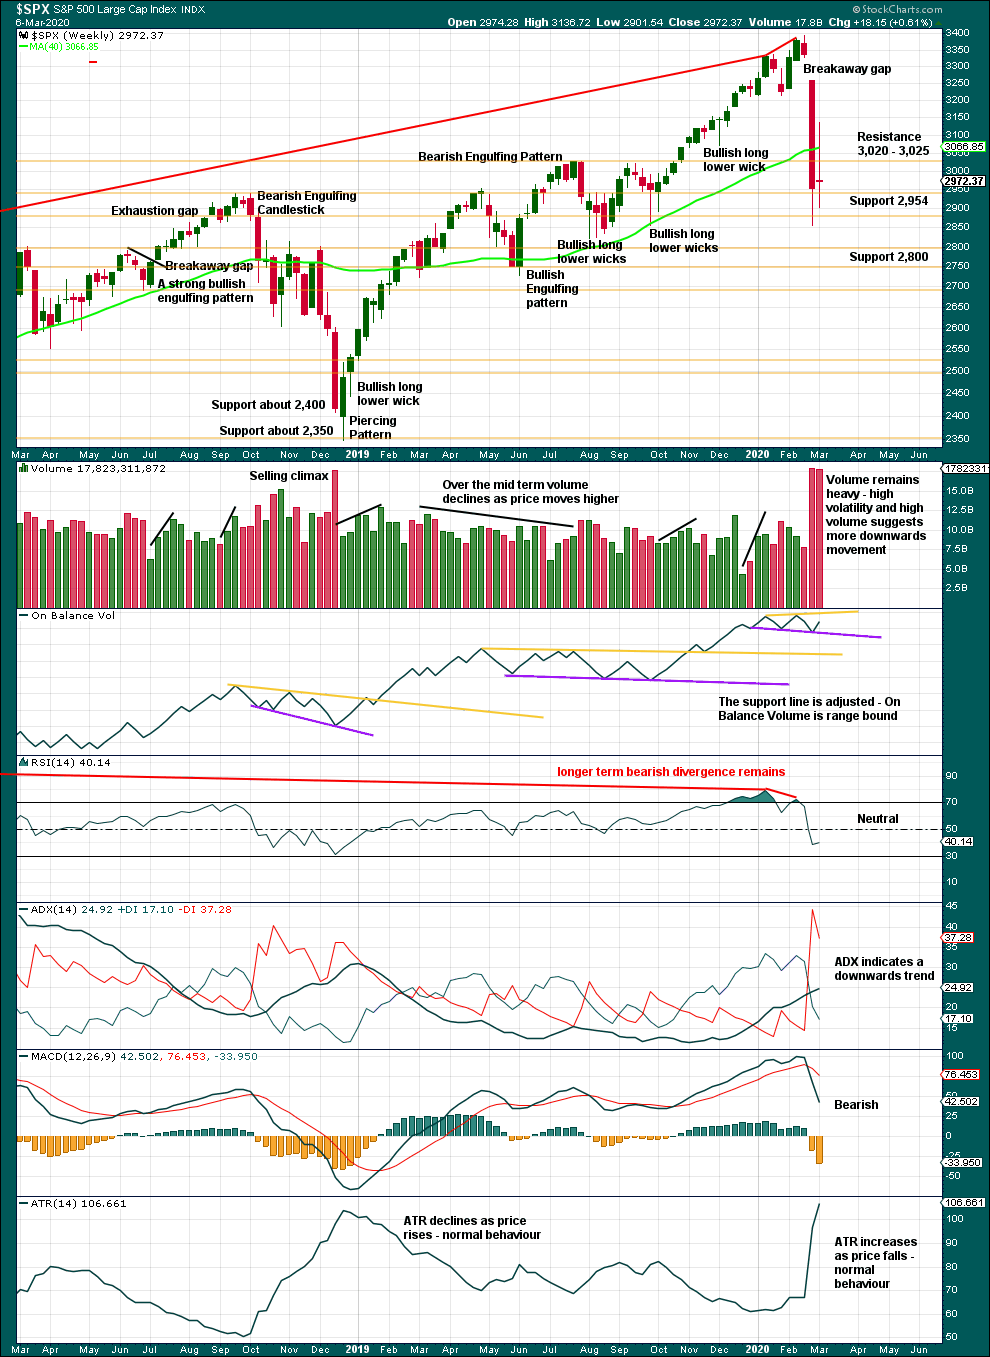
Click chart to enlarge. Chart courtesy of StockCharts.com.
A 15.8% drop in price (high to low) so far has precedent within the larger bull market. It does not necessarily mean the secular bull market must be over.
At the weekly chart level, conditions are not yet oversold; this pullback may be expected to continue further.
A long legged doji this week represents a pause, a balance of bulls and bears. This is not a reversal pattern; doji appear within trends or consolidations.
DAILY CHART
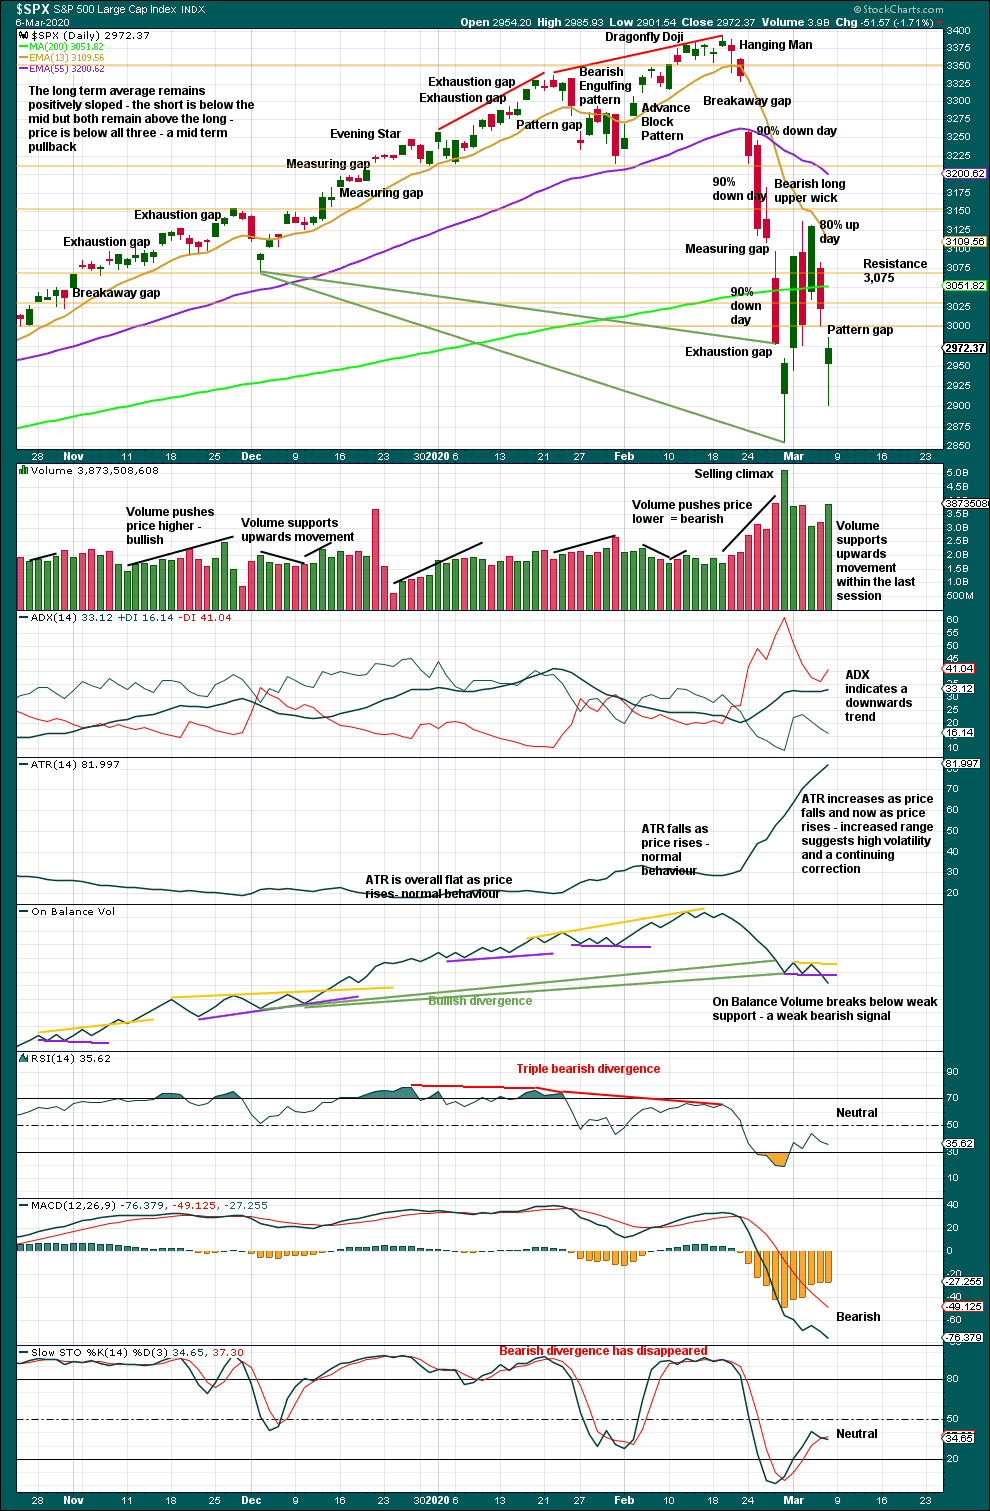
Click chart to enlarge. Chart courtesy of StockCharts.com.
There are now three 90% downwards days in this strong downwards movement.
In the absence of a 90% upwards day or two back to back 80% upwards days, there is no evidence here of strong buying needed to signal a sustainable low in place. The correction may be reasonably expected to continue sideways and / or lower.
For the very short term, a bullish long lower wick and a strong close to Friday’s session may suggest a little more upwards movement when markets open next week.
BREADTH – AD LINE
WEEKLY CHART
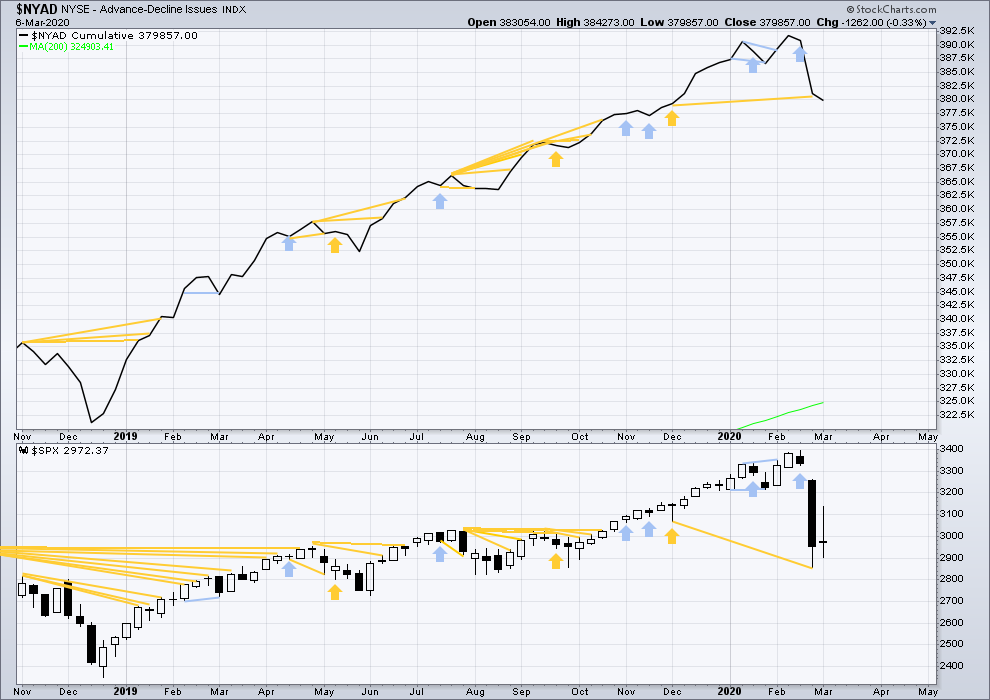
Click chart to enlarge. Chart courtesy of StockCharts.com. So that colour blind members are included, bearish signals will be noted with blue and bullish signals with yellow.
Bear markets from the Great Depression and onwards have been preceded by an average minimum of 4 months divergence between price and the AD line with only two exceptions in 1946 and 1976. With the AD line making new all time highs with last all time highs from price, the end of this bull market and the start of a new bear market is very likely a minimum of 4 months away, which is mid June 2020.
In all bear markets in the last 90 years there is some positive correlation (0.6022) between the length of bearish divergence and the depth of the following bear market. No to little divergence is correlated with more shallow bear markets. Longer divergence is correlated with deeper bear markets.
If a bear market does develop here, it comes after no bearish divergence. It would therefore more likely be shallow.
This week price has moved sideways and the AD line has slightly declined. This is very slight bearish divergence.
Large caps all time high: 3,393.52 on 19th February 2020.
Mid caps all time high: 2,109.43 on 20th February 2020.
Small caps all time high: 1,100.58 on 27th August 2018.
DAILY CHART
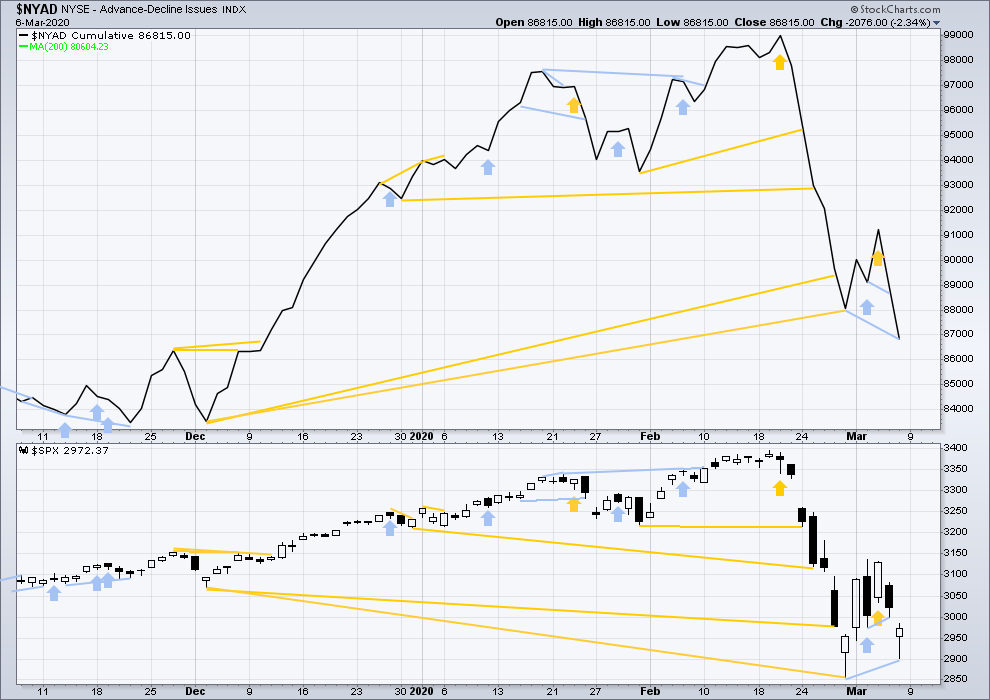
Click chart to enlarge. Chart courtesy of StockCharts.com. So that colour blind members are included, bearish signals will be noted with blue and bullish signals with yellow.
Breadth should be read as a leading indicator.
The AD line has made a new short-term low below the prior low of the 28th of February, but price has not. This divergence is bearish and supports the view that the pullback is not over.
VOLATILITY – INVERTED VIX CHART
WEEKLY CHART
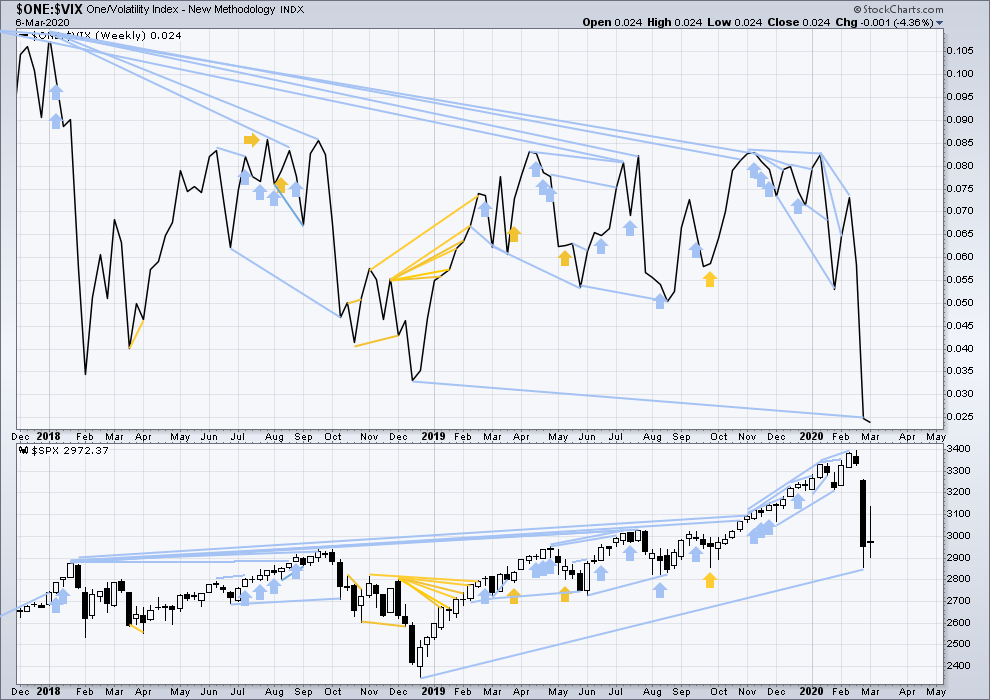
Click chart to enlarge. Chart courtesy of StockCharts.com. So that colour blind members are included, bearish signals will be noted with blue and bullish signals with yellow.
The all time high for inverted VIX was on 30th October 2017. There is now over two years of bearish divergence between price and inverted VIX.
The rise in price is not coming with a normal corresponding decline in VIX; VIX remains elevated. This long-term divergence is bearish and may yet develop further as the bull market matures.
This divergence may be an early warning, a part of the process of a top developing that may take years. It is clearly not useful in timing a trend change from bull to a fully fledged bear market.
This week price has moved sideways and inverted VIX has moved slightly lower. This divergence is bearish for the short term.
DAILY CHART
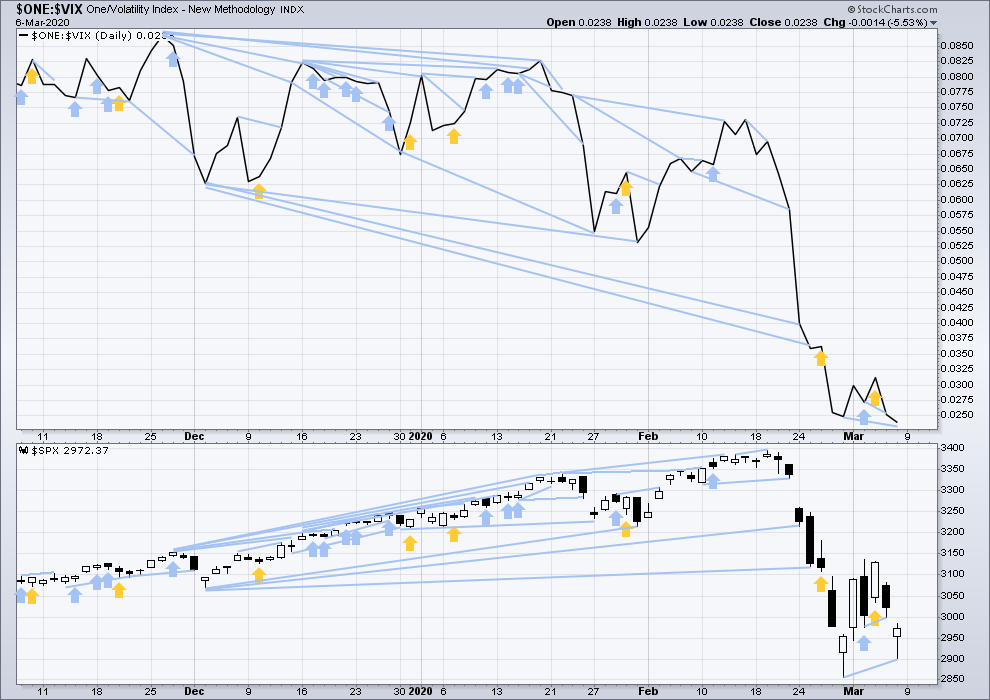
Click chart to enlarge. Chart courtesy of StockCharts.com. So that colour blind members are included, bearish signals will be noted with blue and bullish signals with yellow.
Inverted VIX has made a new low below the prior short-term low of the 28th of February, but price has not. This divergence is bearish and supports the view that the pullback is not over.
DOW THEORY
Dow Theory would confirm a bull market if the following highs are made:
DJIA: 26,951.81 – a close above this point has been made on the 3rd of July 2019.
DJT: 11,623.58 – to date DJT has failed to confirm an ongoing bull market.
S&P500: 2,940.91 – a close above this point was made on the 29th of April 2019.
Nasdaq: 8,133.30 – a close above this point was made on the 26th of April 2019.
Dow Theory would confirm a bear market if the following lows are made on a closing basis:
DJIA: 21,712.53
DJT: 8,636.79
S&P500: 2,346.58
Nasdaq: 7,292.22
GOLD
Barchart data has made a new high at the end of Friday’s session, but Stockcharts data has not
A new high invalidates the main Elliott wave count and confirms an alternate. Members were warned in last analysis that more upwards movement looked likely. The target is now the same for bull and bear wave counts.
Summary: A target for upwards movement to end is at 1,736.
Conditions are still extreme. This trend may reasonably be expected to end soon. If the target is wrong, it may be too high.
Grand SuperCycle analysis is here.
Monthly charts were last updated here.
BEARISH ELLIOTT WAVE COUNT
WEEKLY CHART
Click chart to enlarge.
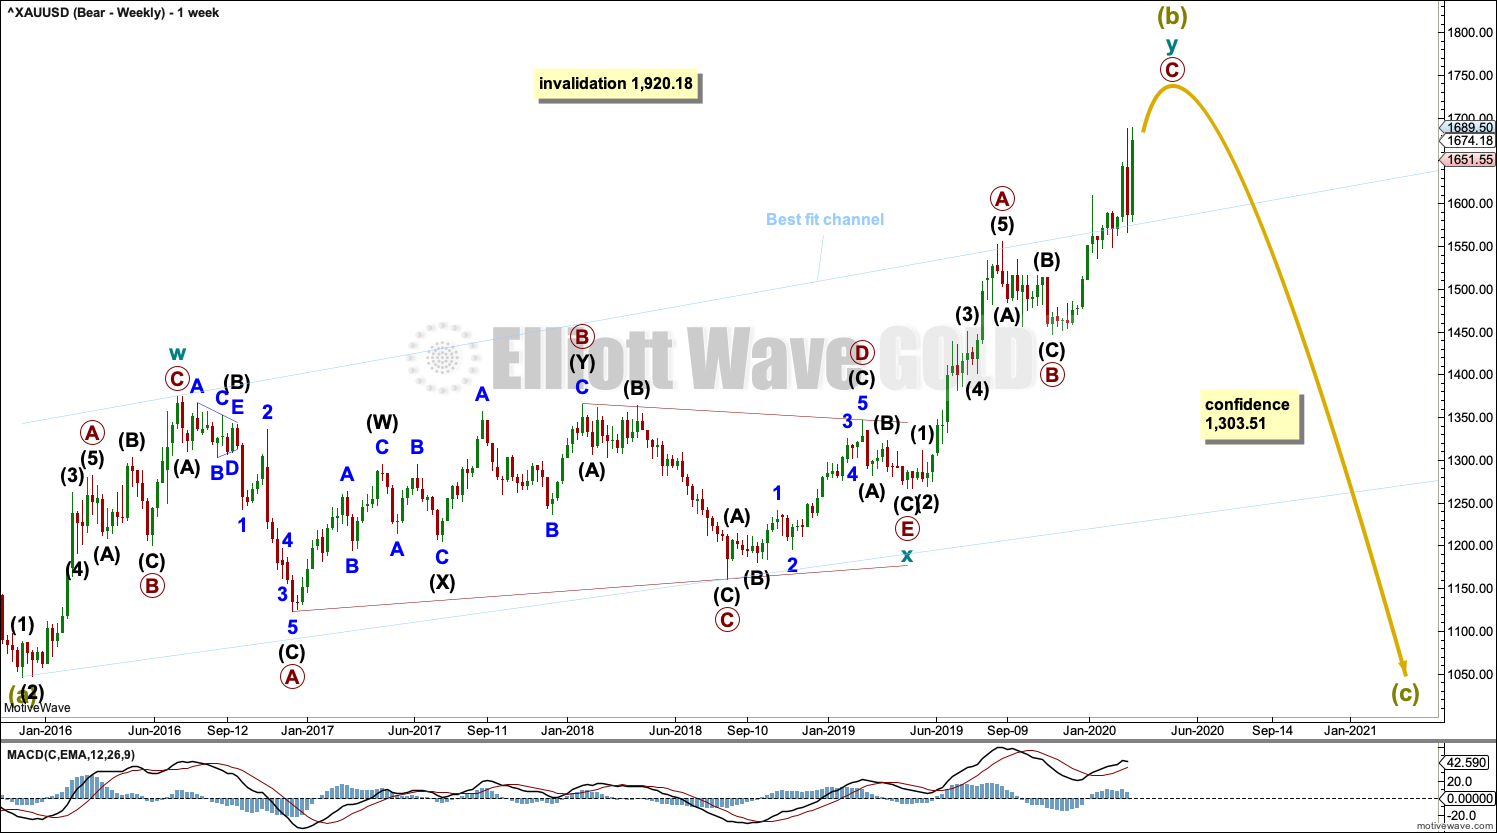
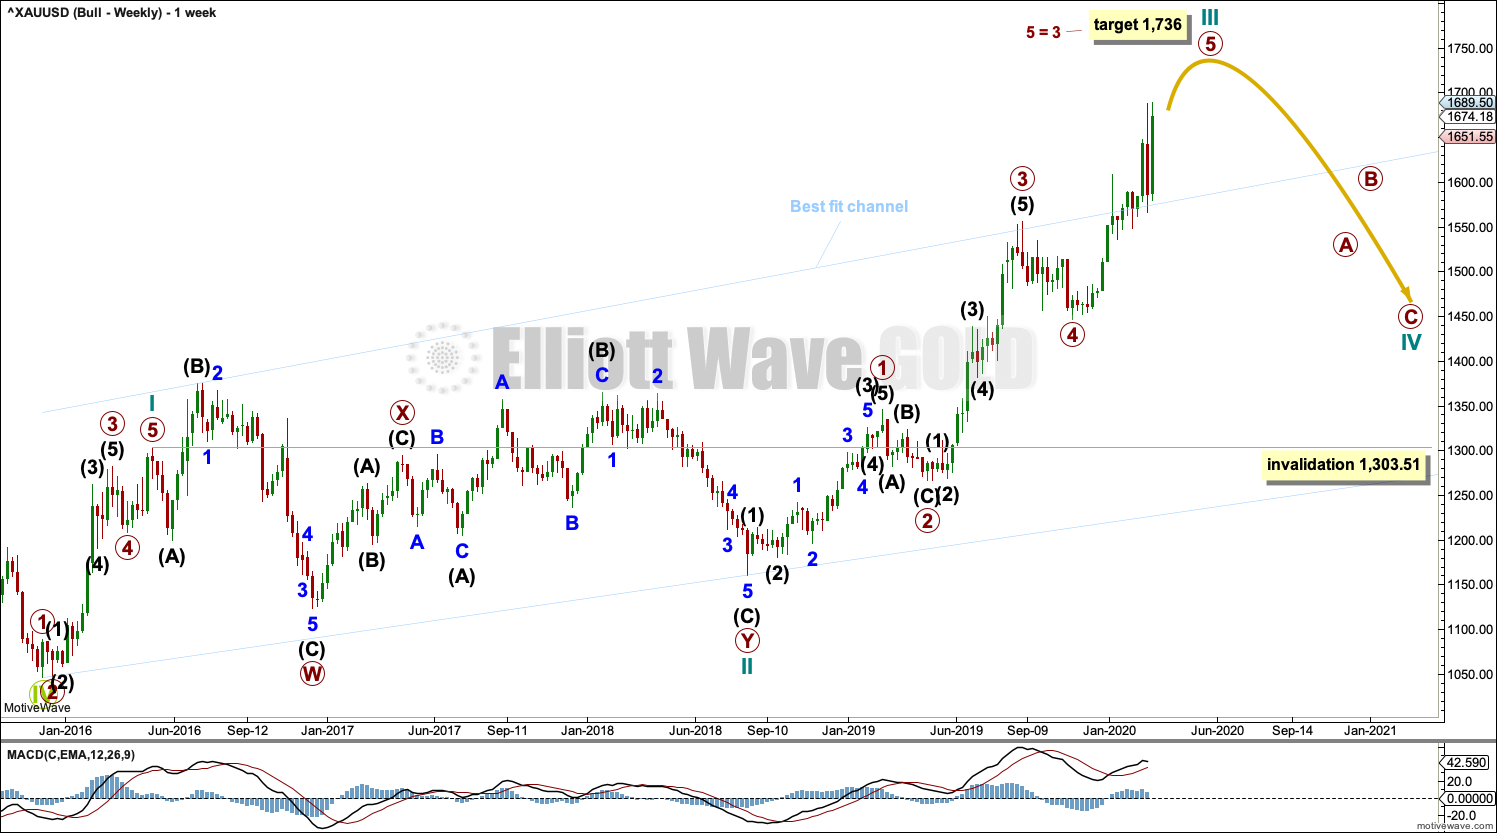
Super Cycle wave (b) may be an incomplete double zigzag.
The first zigzag in the double is labelled cycle wave w. The double is joined by a three in the opposite direction, a triangle labelled cycle wave x. The second zigzag in the double is labelled cycle wave y.
The purpose of the second zigzag in a double is to deepen the correction. Cycle wave y has achieved this purpose.
A wide best fit channel is added in light blue. Copy this channel over to daily charts. Price is now above the upper edge of this channel, which may now provide some support.
DAILY CHART
Click chart to enlarge.
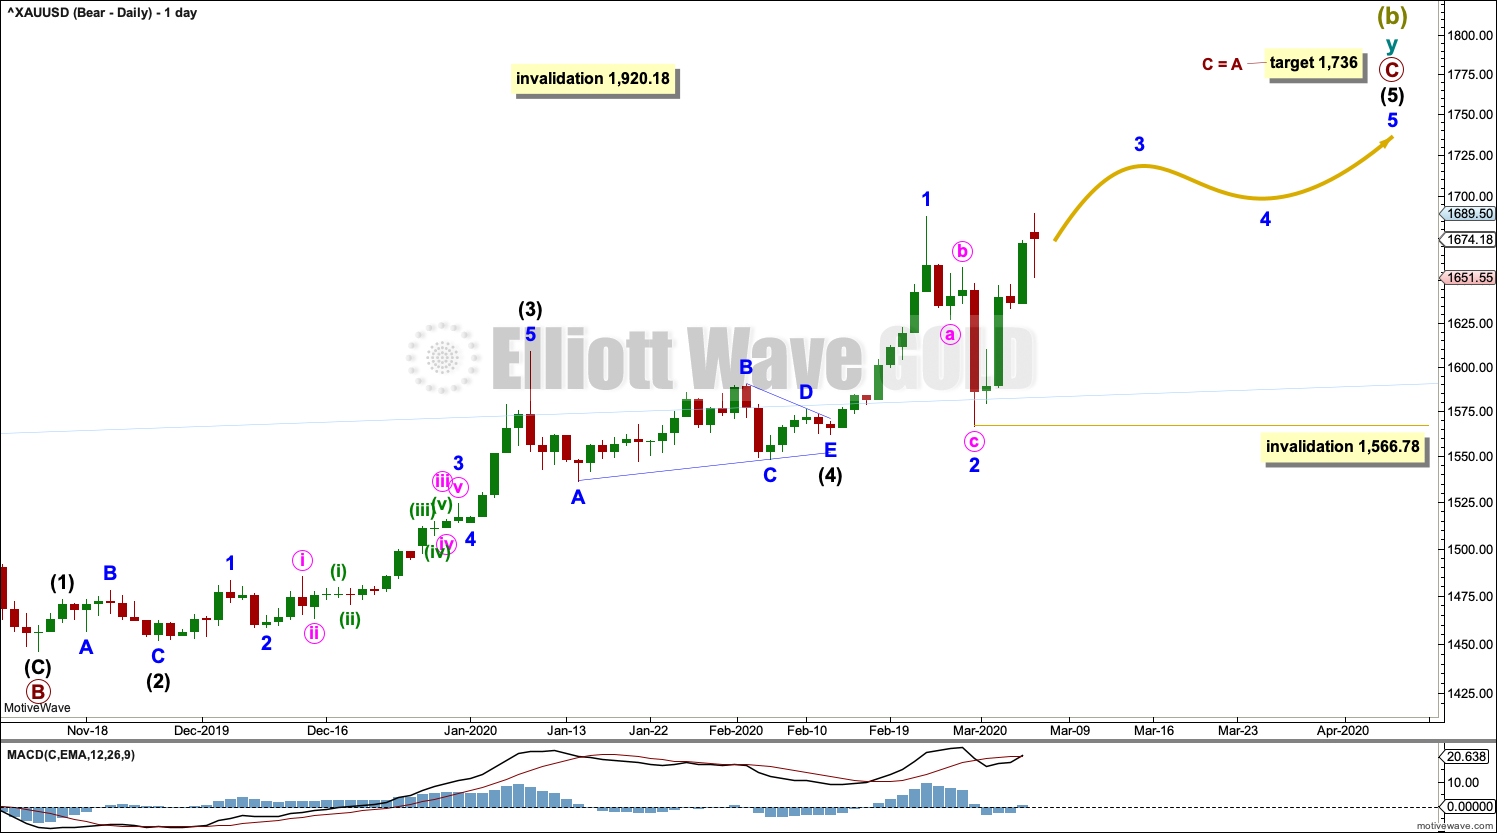
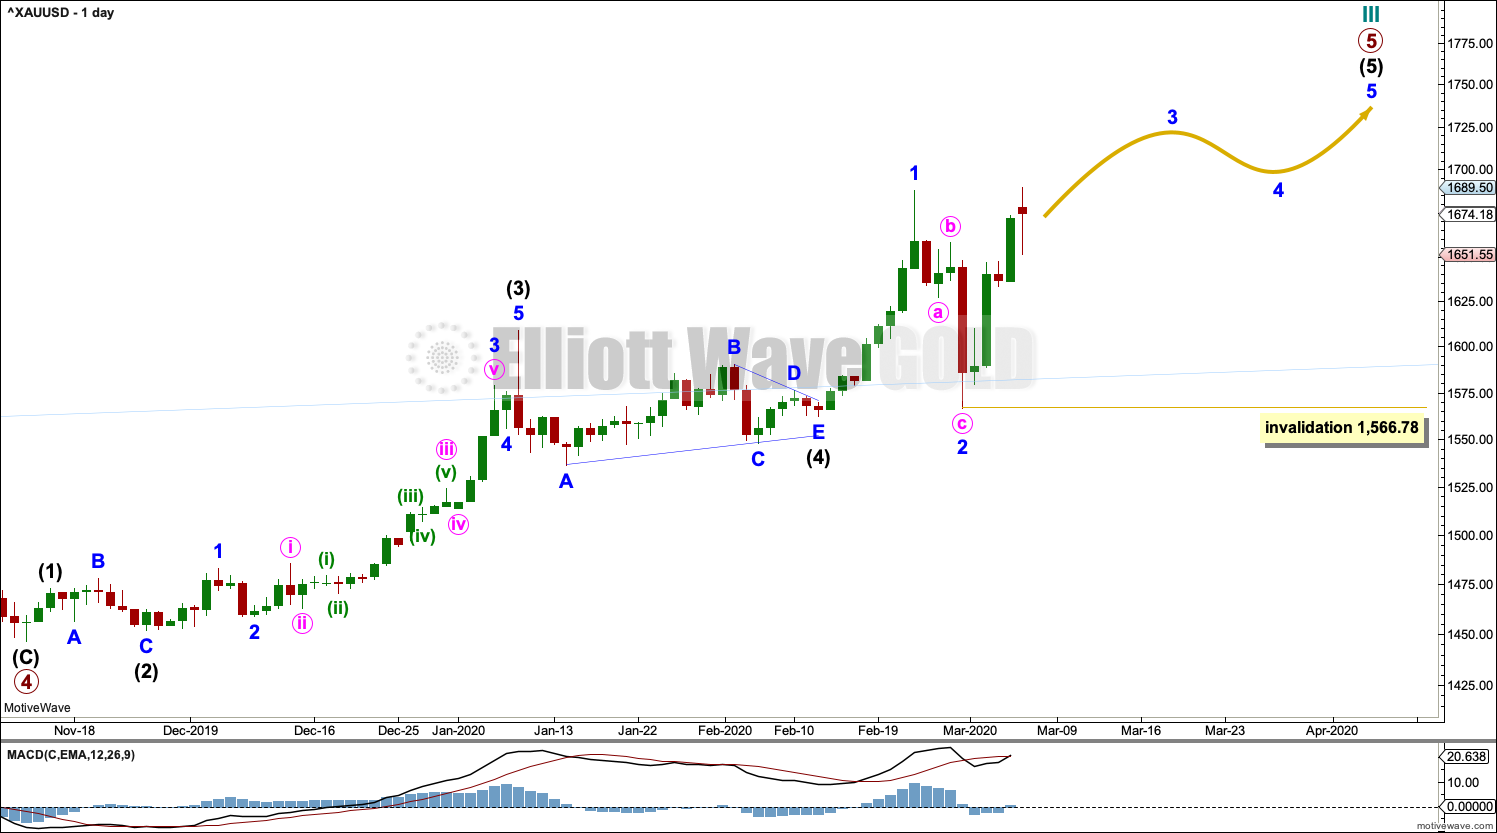
Super Cycle wave (b) may be incomplete.
The second zigzag in the double, labelled cycle wave y, may be continuing higher. Within cycle wave y, primary wave C may be an incomplete five wave impulse. Within primary wave C, intermediate wave (5) may be an incomplete five wave impulse.
Within intermediate wave (5), minor waves 1 and 2 may be complete. Minor wave 3 may now move above the end of minor wave 1, and it must move far enough above this point to allow room for minor wave 4 to unfold and remain above minor wave 1 price territory.
The target expects primary waves A and C to exhibit the most common Fibonacci ratio.
Within minor wave 3, no second wave correction may move beyond its start below 1,566.78.
BULLISH ELLIOTT WAVE COUNT
WEEKLY CHART
Click chart to enlarge.
This wave count sees the the bear market complete at the last major low for Gold on 3 December 2015.
If Gold is in a new bull market, then it should begin with a five wave structure upwards on the weekly chart.
Cycle wave I fits as a five wave impulse with reasonably proportionate corrections for primary waves 2 and 4. This resolves a previous major problem with the bullish wave count.
Cycle wave II now fits as a double flat. However, a problem arises with the relabelling of this structure. Within the first flat correction labelled primary wave W, this wave count now needs to ignore what looks like an obvious triangle from July to September 2016 (this can be seen labelled as a triangle on the bear wave count above). This movement must now be labelled as a series of overlapping first and second waves.
Within the first flat correction labelled primary wave W of the double flat of cycle wave II, intermediate wave (B) is 1.69 the length of intermediate wave (A). This is longer than the common range of up to 1.38, but within an allowable guideline of up to 2. The length of intermediate wave (B) reduces the probability of this wave count.
Cycle wave III may be incomplete. When it arrives, cycle wave IV may not move into cycle wave I price territory below 1,303.51.
DAILY CHART
Click chart to enlarge.
Cycle wave III may be incomplete. Intermediate wave (5) within primary wave 5 may be extending higher.
Within intermediate wave (5), minor waves 1 and 2 may be complete.
Minor wave 3 must move far enough above the end of minor wave 1 to allow room for minor wave 4 to unfold and remain above minor wave 1 price territory.
Within minor wave 3, no second wave correction may move beyond its start below 1,566.78.
TECHNICAL ANALYSIS
WEEKLY CHART
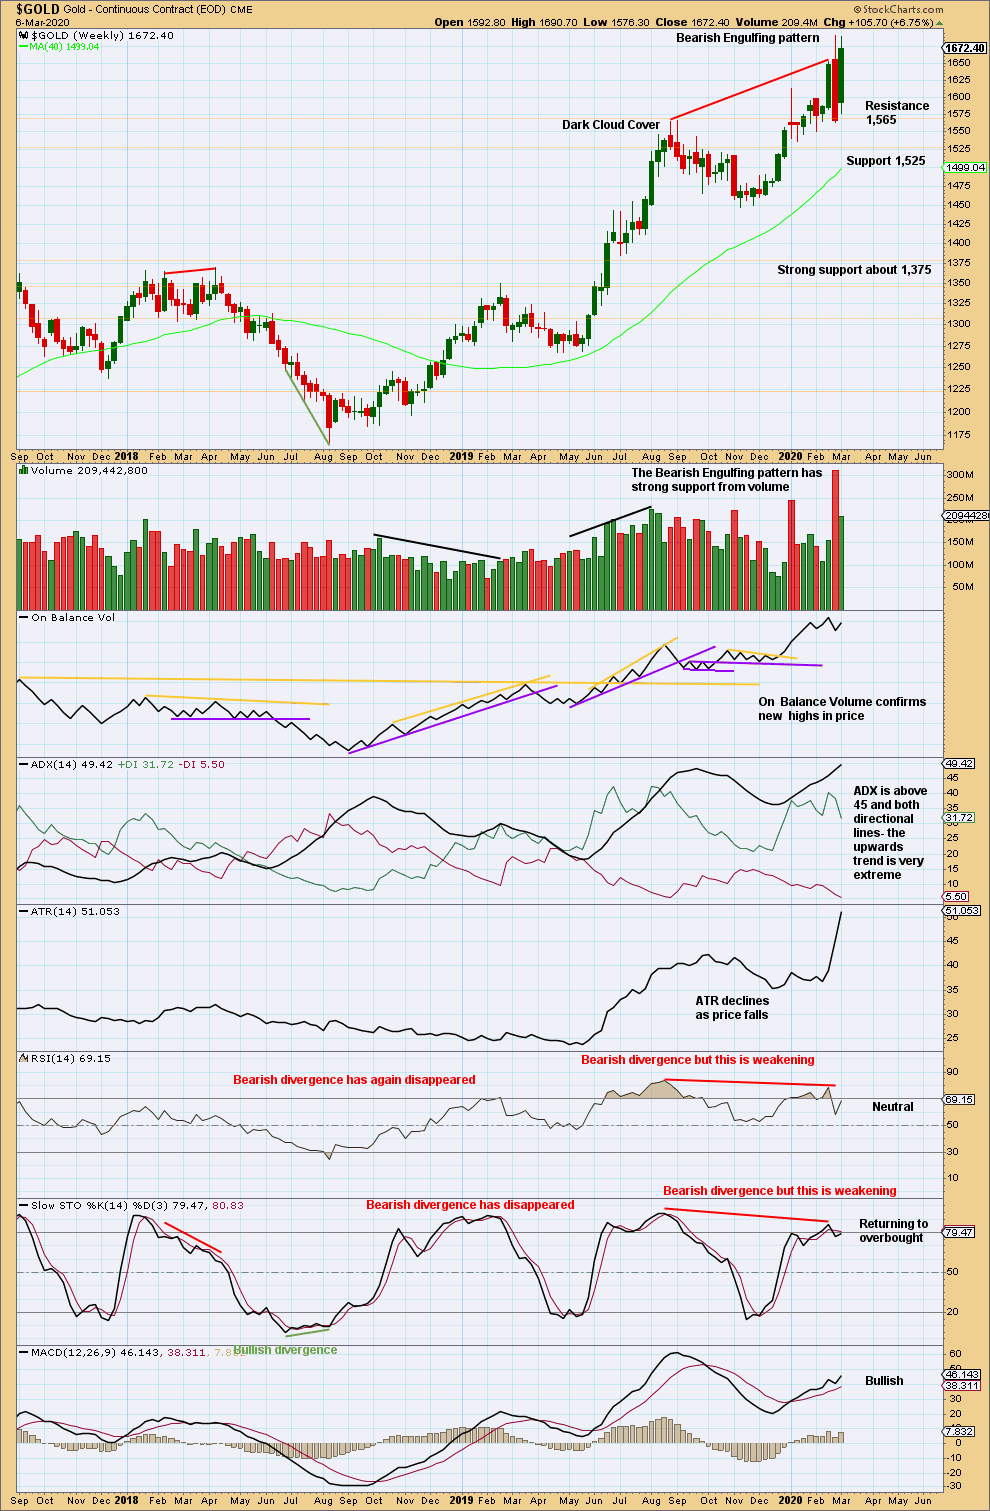
Click chart to enlarge. Chart courtesy of StockCharts.com.
The upwards trend remains very extreme. The risk of a deep pullback or a large consolidation, or a 180° trend change, is high.
DAILY CHART
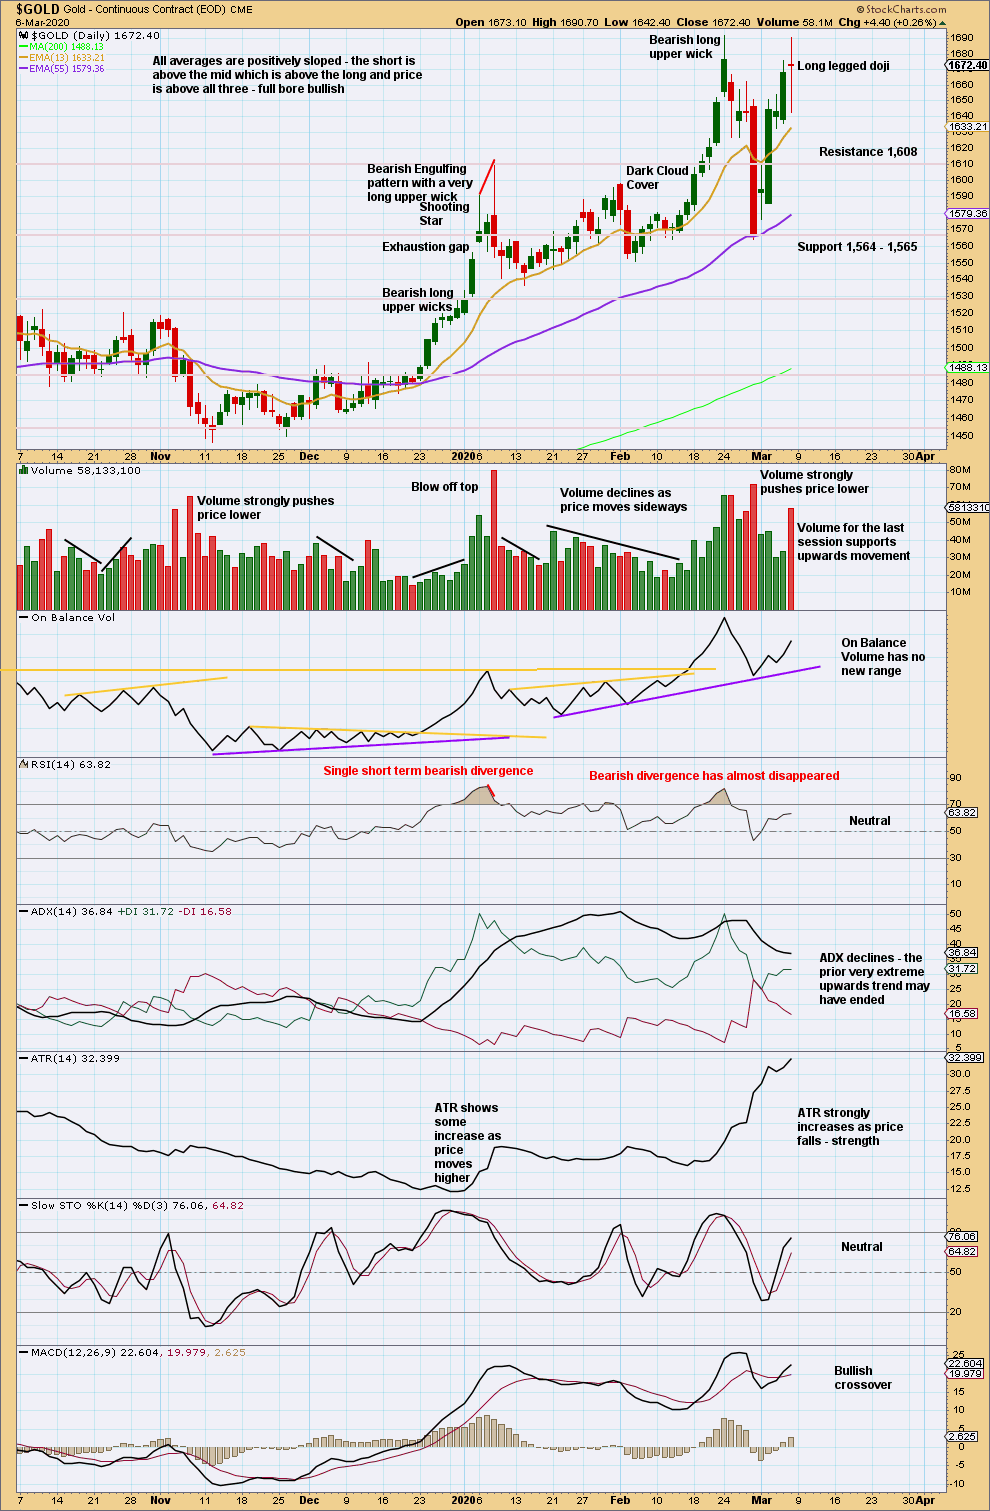
Click chart to enlarge. Chart courtesy of StockCharts.com.
While Stockcharts data has not made a new high, Barchart data has. When there is a discrepancy between these two data feeds, it is usually resolved in the direction of the more extreme data.
Volume supports upwards movement. With ADX now declining, if it turns to increase, the trend may not be extreme at this time frame. Conditions are no longer overbought. There is room for upwards movement to continue.
GDX WEEKLY CHART

Click chart to enlarge. Chart courtesy of StockCharts.com.
GDX is a reasonable distance off new highs. The last signal was very bearish from a strong Bearish Engulfing pattern.
GDX DAILY CHART
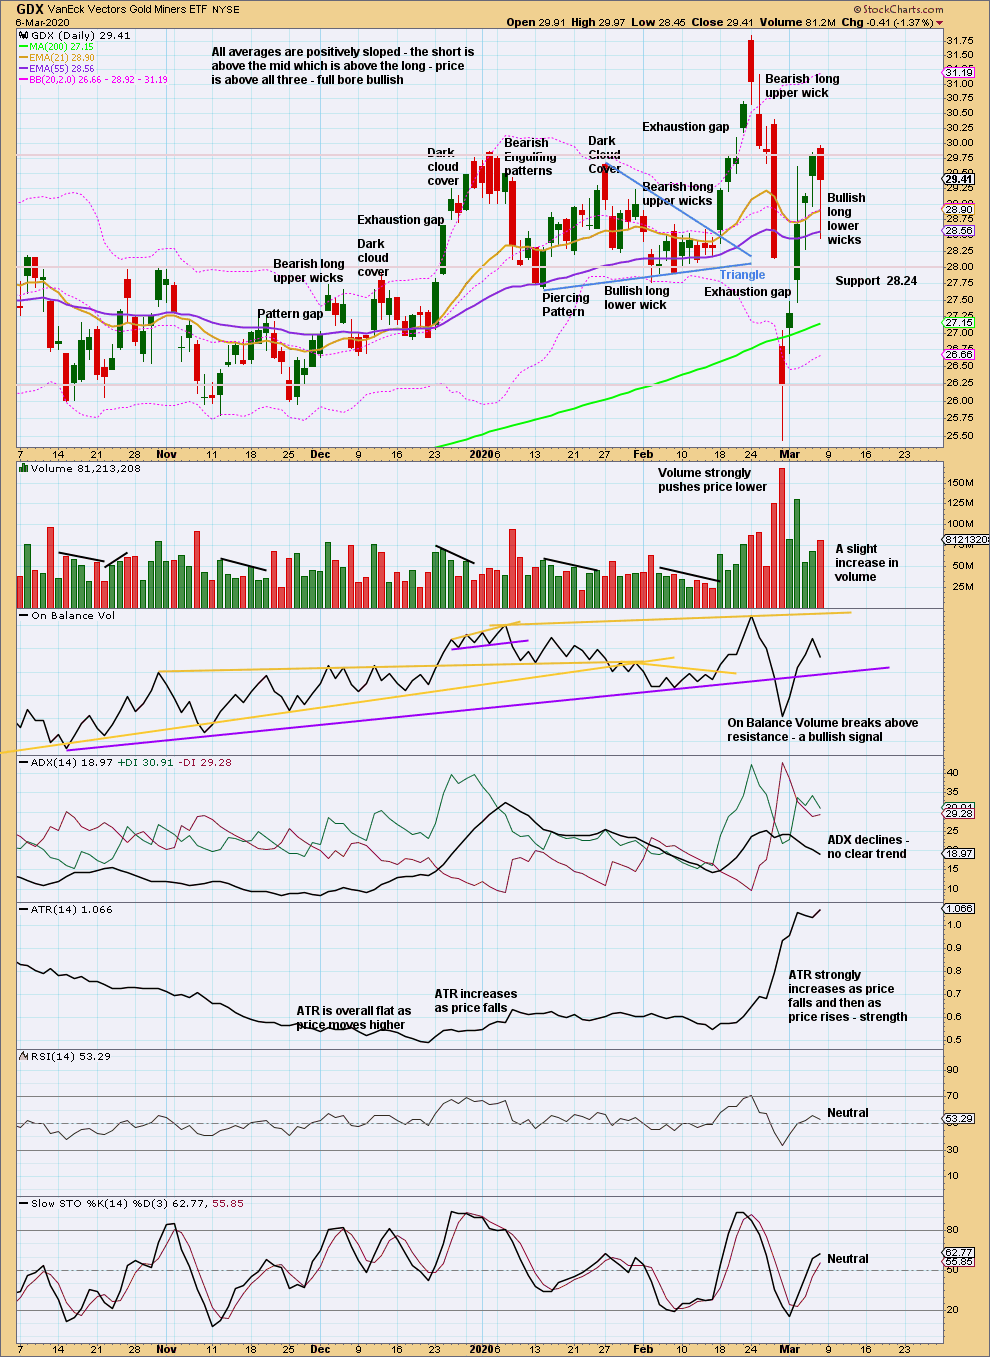
Click chart to enlarge. Chart courtesy of StockCharts.com.
Now three long lower wicks in a row suggest more upwards movement. Volume offers a little support to upwards movement.
US OIL
Downwards movement has continued for the week exactly as expected. A new low below 42.37 has reduced the probability of the alternate bullish Elliott wave count.
Summary: Next target for a multi-week interruption to the downwards trend is at 28.24.
MAIN ELLIOTT WAVE COUNT – BEARISH
MONTHLY CHART
Click chart to enlarge.
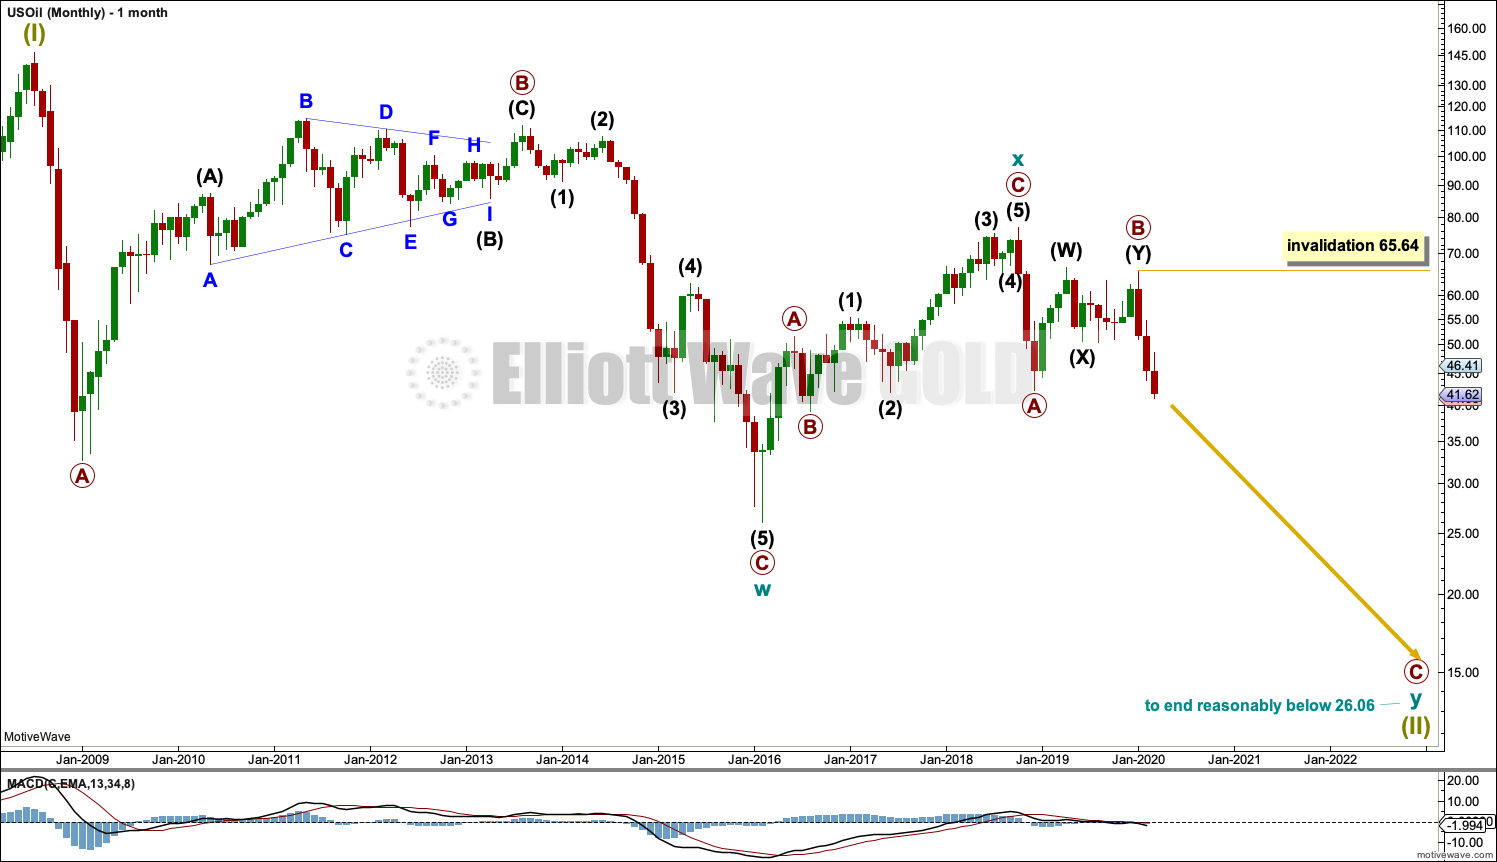
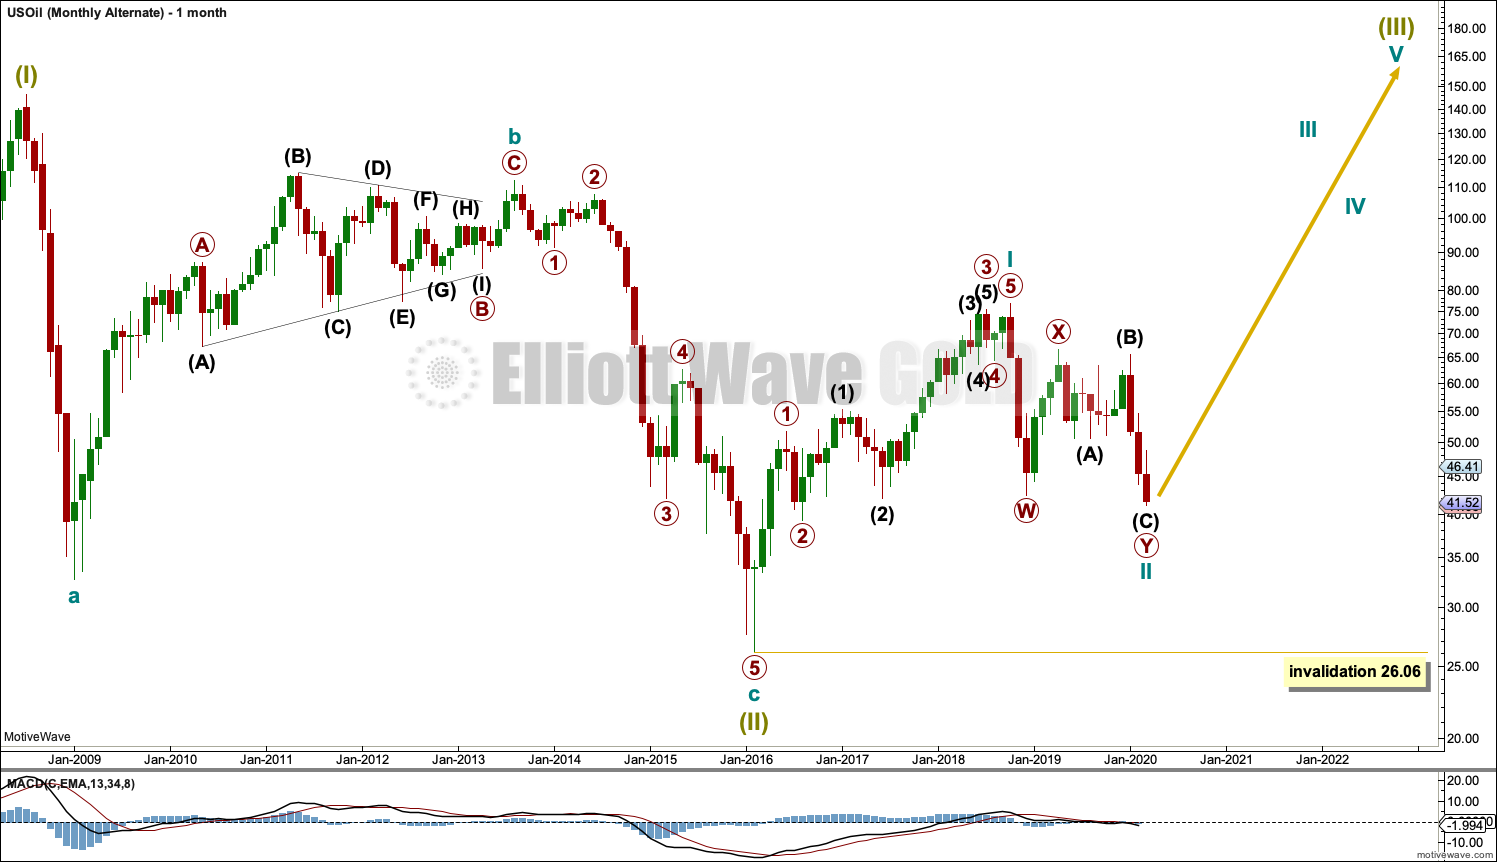
The basic Elliott wave structure is five steps forward and three steps back. This Elliott wave count expects that US Oil is still within a three steps back pattern, which began in July 2008. The Elliott wave count expects that the bear market for US Oil continues.
This Elliott wave corrective structure is a double zigzag, which is a fairly common structure. The correction is labelled Super Cycle wave (II).
The first zigzag in the double is complete and labelled cycle wave w. The double is joined by a three in the opposite direction labelled cycle wave x, which subdivides as a zigzag. The second zigzag in the double may now have begun, labelled cycle wave y.
The purpose of a second zigzag in a double zigzag is to deepen the correction when the first zigzag does not move price deep enough. To achieve this purpose cycle wave y may be expected to move reasonably below the end of cycle wave w at 26.06. When the alternate bullish Elliott wave count below is invalidated, then a target for this bearish wave count for primary wave C to complete cycle wave y and Super Cycle wave (II) will be calculated.
Cycle wave y is expected to subdivide as a zigzag, which subdivides 5-3-5.
Cycle wave w lasted 7.6 years and cycle wave x lasted 2.7 years. Cycle wave y may be expected to last possibly about a Fibonacci 5 or 8 years.
Within primary wave C, no second wave correction may move beyond the start of its first wave above 65.64.
WEEKLY CHART
Click chart to enlarge.
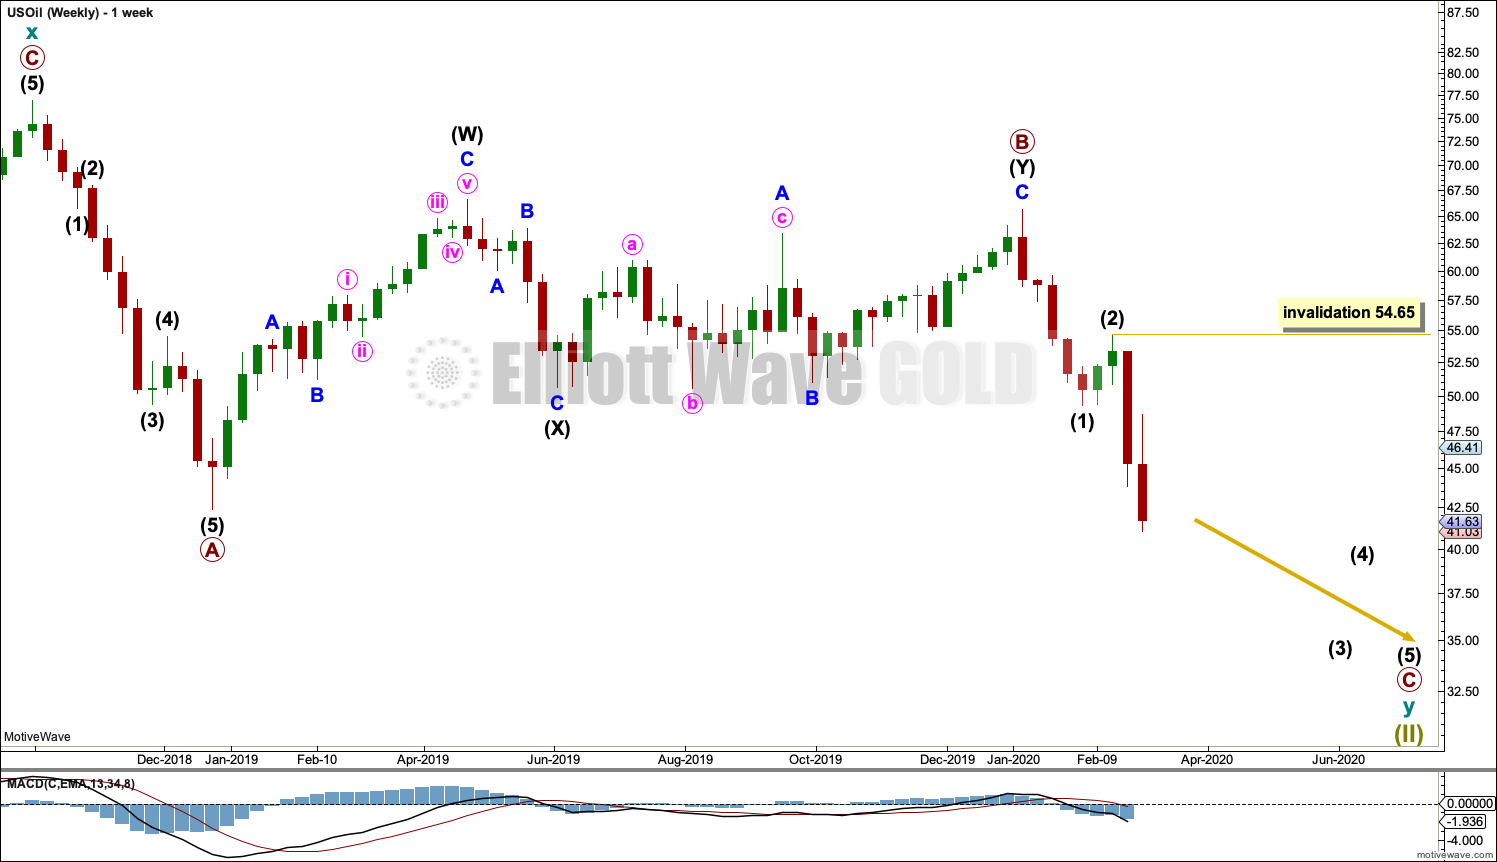
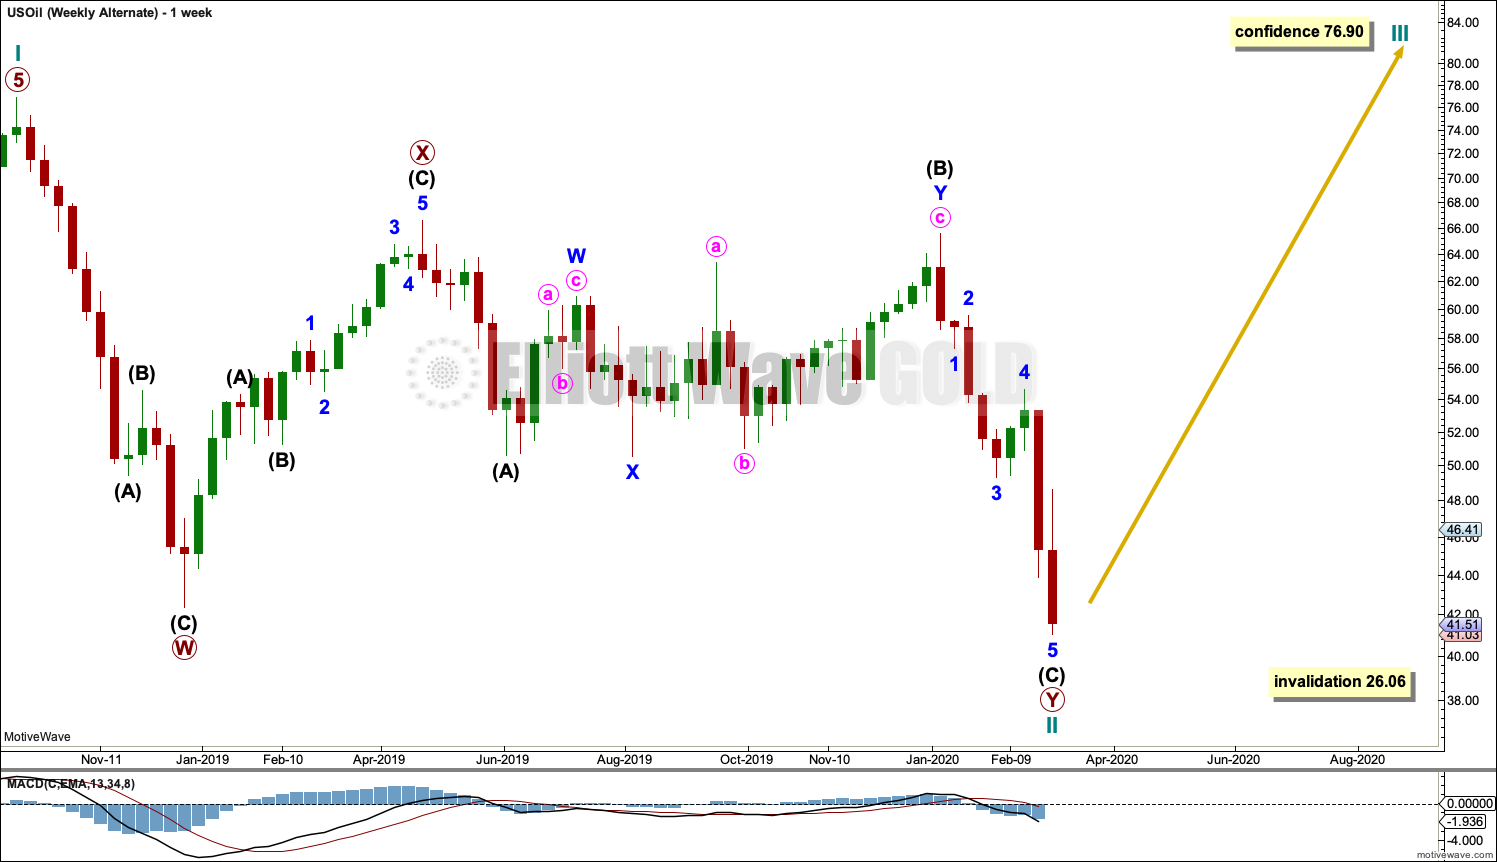
This weekly chart shows all of cycle wave y so far.
Cycle wave y is expected to subdivide as a zigzag. A zigzag subdivides 5-3-5. Primary wave A must subdivide as a five wave structure if this wave count is correct.
Primary wave A may be a complete five wave impulse at the last low.
Primary wave B may be a complete double combination: zigzag – X – flat. Intermediate wave (W) fits as a zigzag. Intermediate wave (Y) may be a complete regular flat correction.
Primary wave C must subdivide as a five wave motive structure, most likely an impulse. Within primary wave C, intermediate waves (1) and (2) may be complete. Within intermediate wave (3), no second wave correction may move beyond the start of its first wave above 54.65.
DAILY CHART
Click chart to enlarge.
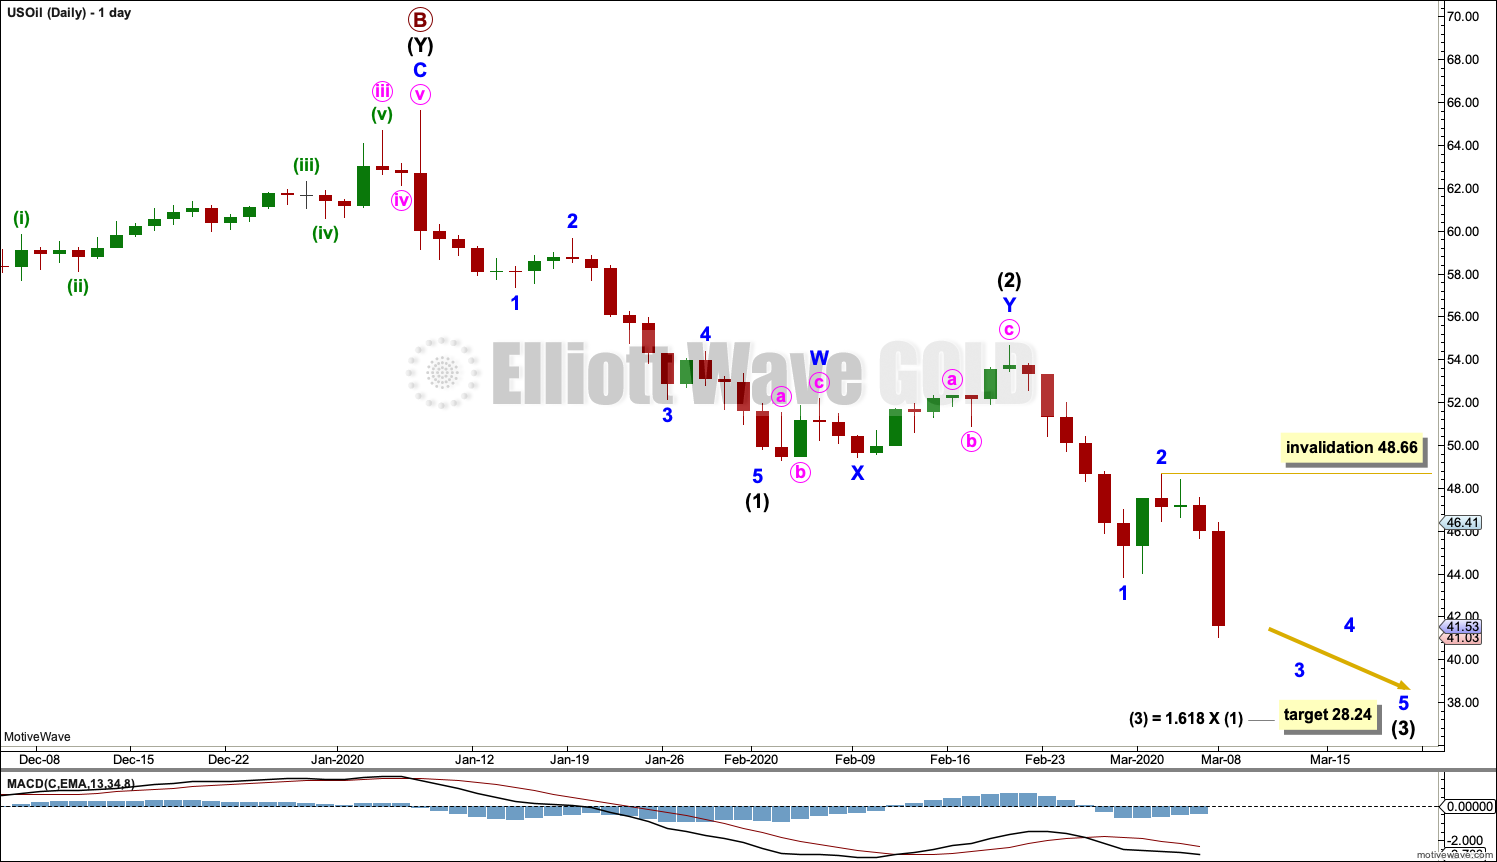
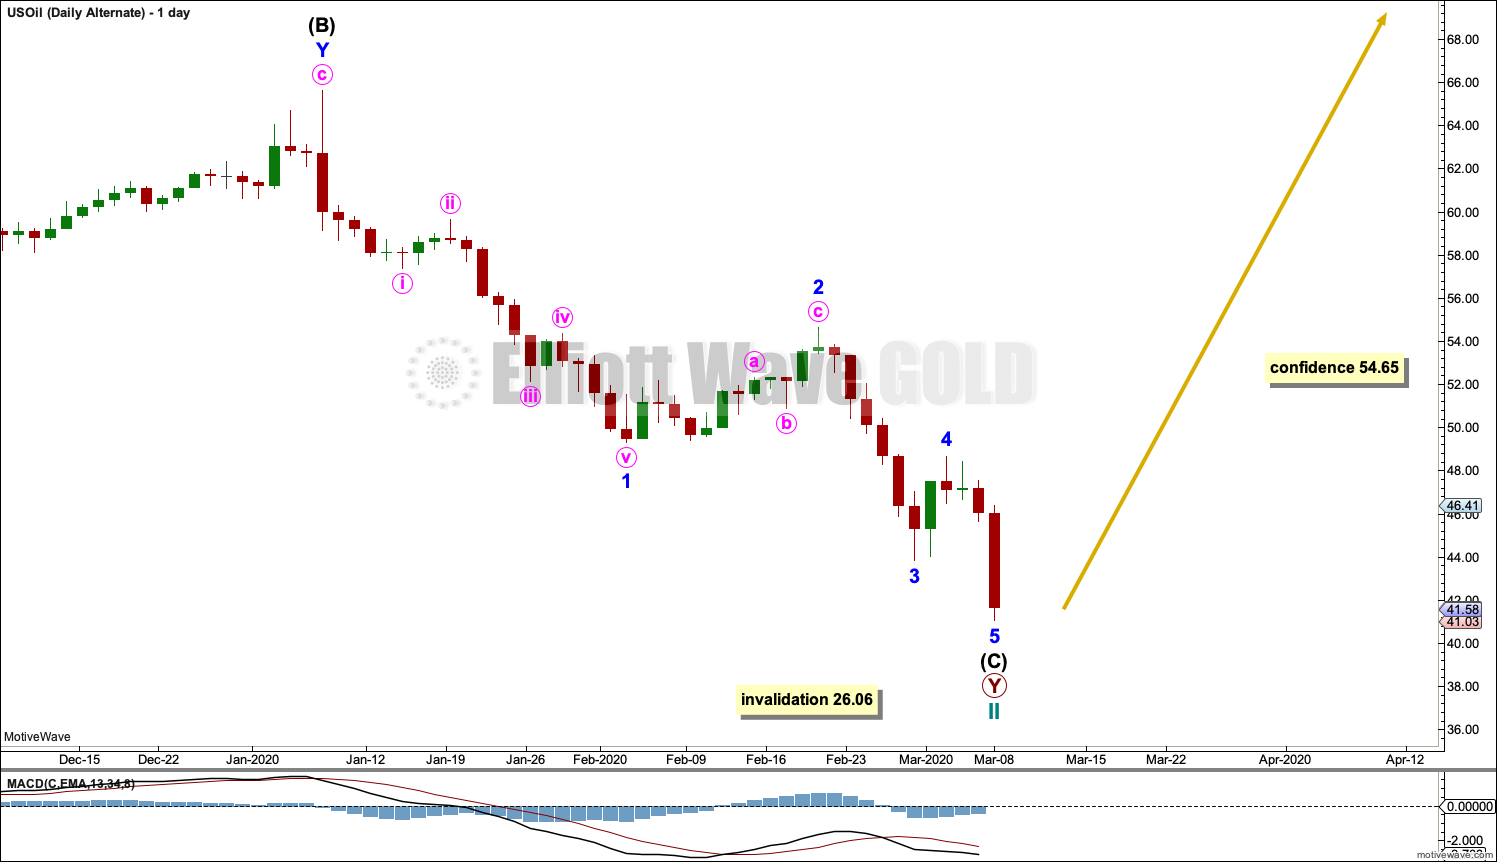
Primary wave C must subdivide as a five wave motive structure, most likely an impulse. Within primary wave C, intermediate wave (1) subdivides as a complete impulse, intermediate wave (2) may be a complete double zigzag, and intermediate wave (3) may have begun.
Within intermediate wave (3), minor waves 1 and 2 may now be complete.
Minor wave 3 may only subdivide as an impulse. Within minor wave 3, no second wave correction may move beyond the start of its first wave above 48.66.
The next wave down may exhibit a further increase in momentum as a third wave down at two degrees unfolds.
ALTERNATE ELLIOTT WAVE COUNT
MONTHLY CHART
Click chart to enlarge.
It is possible that the bear market is over for Oil and a new bull market has begun.
For a bullish wave count for Oil, the upwards wave from the major low at 26.06 in February 2016 must be seen as a complete five wave impulse. This is labelled cycle wave I.
Cycle wave II may be continuing lower as a double zigzag. Cycle wave II may no move beyond the start of cycle wave I below 26.06.
WEEKLY CHART
Click chart to enlarge.
Cycle wave II may be continuing lower as a double zigzag. The structure may be complete here, or minor wave 5 of intermediate wave (C) may continue lower.
Cycle wave II may not move beyond the start of cycle wave I below 26.06.
DAILY CHART
Click chart to enlarge.
The structure of intermediate wave (C) may be complete. This wave count now requires a new high above 54.65 for confidence.
TECHNICAL ANALYSIS
MONTHLY CHART
Click chart to enlarge. Chart courtesy of StockCharts.com.
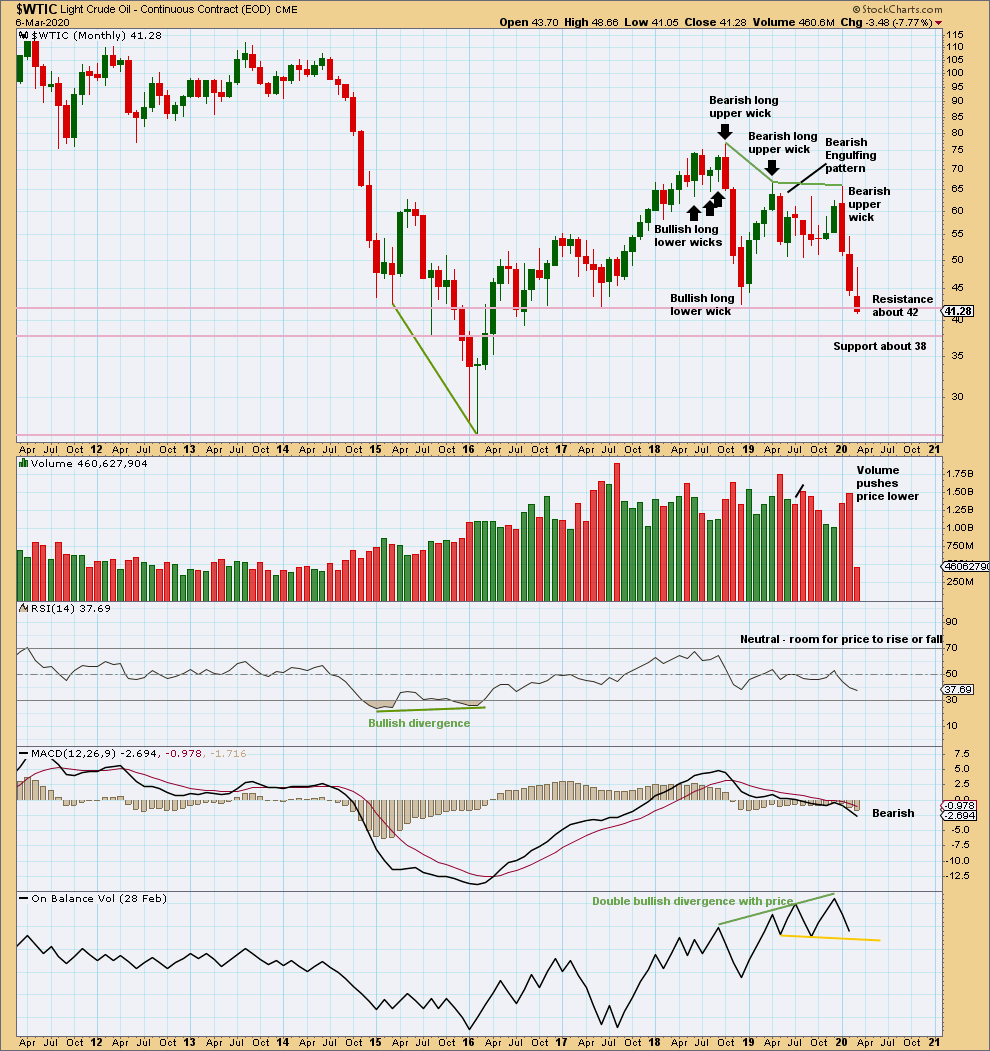
Both January and February have increased range and volume for downwards movement. This supports the main Elliott wave count.
A close below support about 42 on a downwards day with support from volume is significant downwards breakout at this time frame.
WEEKLY CHART
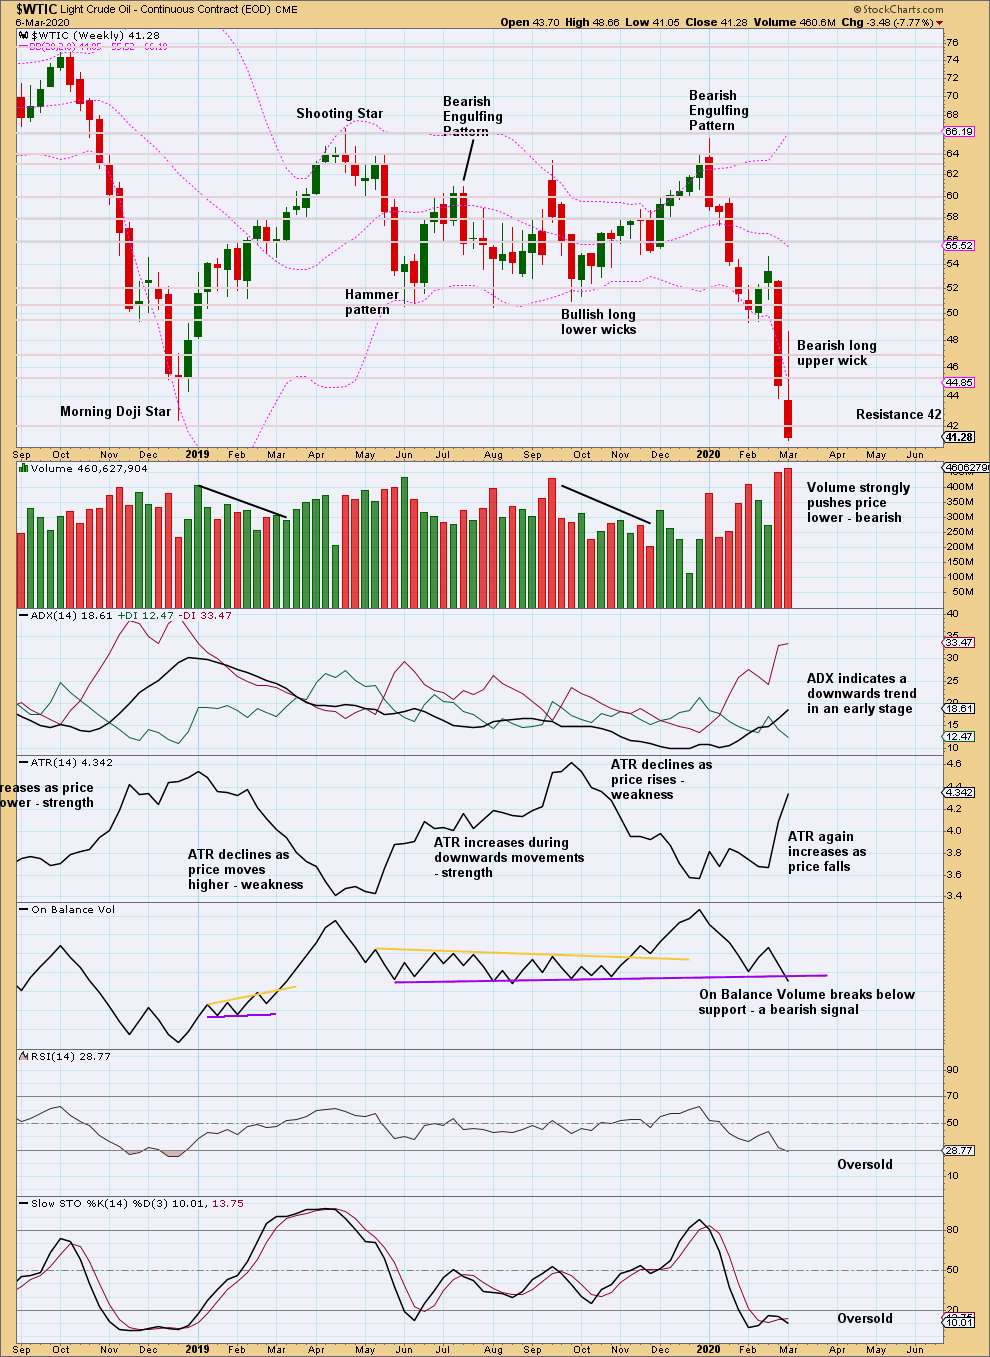
Click chart to enlarge. Chart courtesy of StockCharts.com.
A downwards breakout below prior support about 51 – 50 has been effected. This breakout has support from volume, so some confidence may be had in it. A target taken from the range of the prior consolidation would be about 34.37.
This week a close near lows, a long upper wick, and push from volume all suggest more downwards movement next week.
DAILY CHART
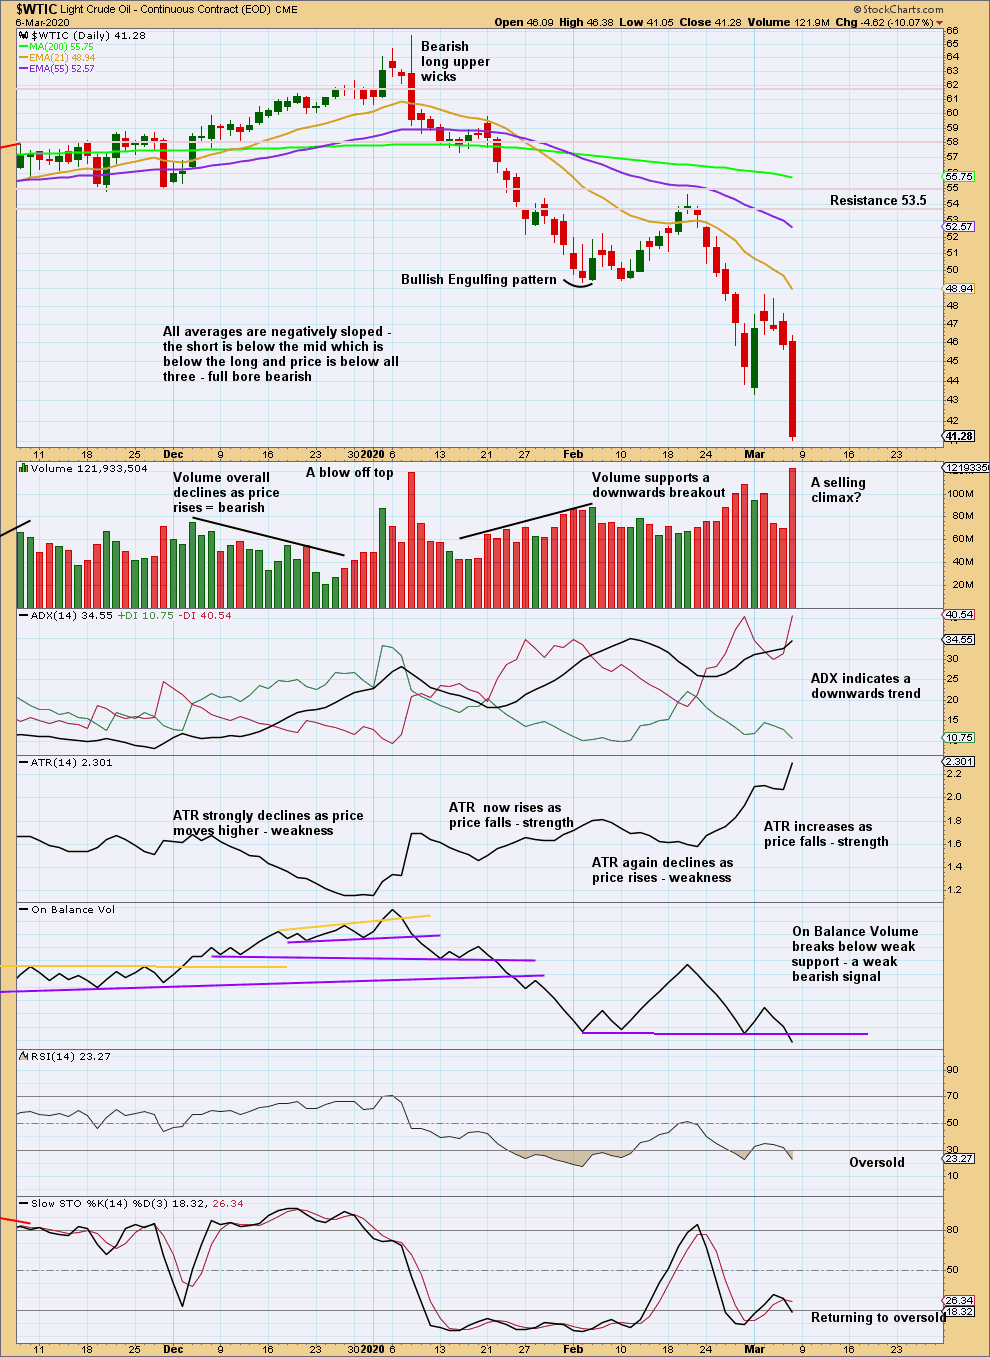
Click chart to enlarge. Chart courtesy of StockCharts.com.
A downwards trend is now in place at both daily and weekly time frames. Both volume and range support this trend.
RSI and Stochastics may remain very extreme for reasonable periods of time when this market trends.
Although strong volume for Friday suggests a selling climax, the selling climax may continue for a further one to very few days. A close near lows for the session suggests more downwards movement when markets open next week.
—
Always practice good risk management as the most important aspect of trading. Always trade with stops and invest only 1-5% of equity on any one trade. Failure to manage risk is the most common mistake new traders make.
Lara’s Weekly will be published Saturday morning this week.
I’m just too tired to complete the analysis required tonight. I’m sure you’d all rather I complete it rested than make mistakes because I’m too tired.
Lara
Its official now that S&P dipped below invalidation point for the main wave count. So safe to say for now that the alternative wave count at the weekly time frame is the main wave count. If theres anything else to add at this point let us know.
Thanks
Rich
You’ll be getting updated S&P charts shortly to be published in a separate post.
Thanks Lara…
I would think 2610 would be the next target.
Hello Lara,
I made a comment on the video that if we break 2822 area what is the alternative count you mentioned in the video you will explain, but I really ment to ask what if we break the limit the 2728.81 area for the primary count you are explaining in this update and so what is the alternative count for that scenario? I do not see any where posted that alternative count. Could you please direct me where I can find it or explain the alternative count if that level is broken next week or any other week fallowing? Thanks
Miro
Yes I’d like the alternative please too now that we’ve broken 2728 thanks
I got the low today as 2734.43 – so we haven’t invalidated the Main wave count yet (unless my data feed is incorrect).
If price goes below 2728.81 then the more bullish Alternate cycle wave V impulse wave count would come into play which doesn’t have the 3477.39 upper limit.
We do have a .618 retracement. Remaining on sidelines until 3136.7 is taken out higher.
I replied to your comment on the video:
The alternate is covered on the weekly chart at 6:31.
The price point which differentiates the main count and the alternate is 2,728.81. A new low below this point invalidates the main count and then the alternate becomes the main count.
If that happens then I would expect price to bounce up strongly from the lower edge of the teal channel
Apologies Lara, thanks for pointing it out.
Hi Lara,
Does SPX invalidation level of 2,728.81 considers prices during regular trading hours or does it consider futures prices also? In today’s regular session, 2,734.43 was the low. But after hours, futures show Low as 2,695.25. Which one would you consider in this case? If we ignore after hours prices, then primary count is still valid. Thank you for your response in advance & as usual, love your charts.
The wave count is done on the cash market for NY session only. Futures is a different market.
After hours price movement is not considered in the S&P wave count.
Thanks for clearing up Lara, I must have used after the hours price. Apologies all.
Hi Lara,
Within minor 3, where would you expect minute 1 to bounce from?
I’m super excited for the next few months of watching oil!!
It’s possible it could be over already. I see Oil is plummeting. Expect bounces may be brief and shallow.
Thank you for clarifying, Lara. Now I can rest easy knowing that it wasn’t me missing out.
This market has been so unpredictable – typical (b) wave, like you said.
Lara,
For GOLD, you noted in this weekly analysis that “Members were warned in last analysis that more upwards movement looked likely.” Where was this warning? How did I miss it? Please let me know, so I can be more watchful going forward.
I saw the statement last week “This indicates a high is in place for Gold.” I shorted GLD but got out with minor bruise, not much damage 🙂
I’m sorry Dave, that warning was given to the Gold daily members on 5th March after the strong upwards movement of the 4th of March.
I don’t always transfer that kind of information from the Gold daily to Lara’s Weekly, because sometimes it doesn’t happen. And sometimes by the end of the week it would have been better if I hadn’t done it.
Thank you for clarifying, Lara. Now I can rest easy knowing that it wasn’t me missing out.
This market has been so unpredictable – typical (b) wave, like you said.